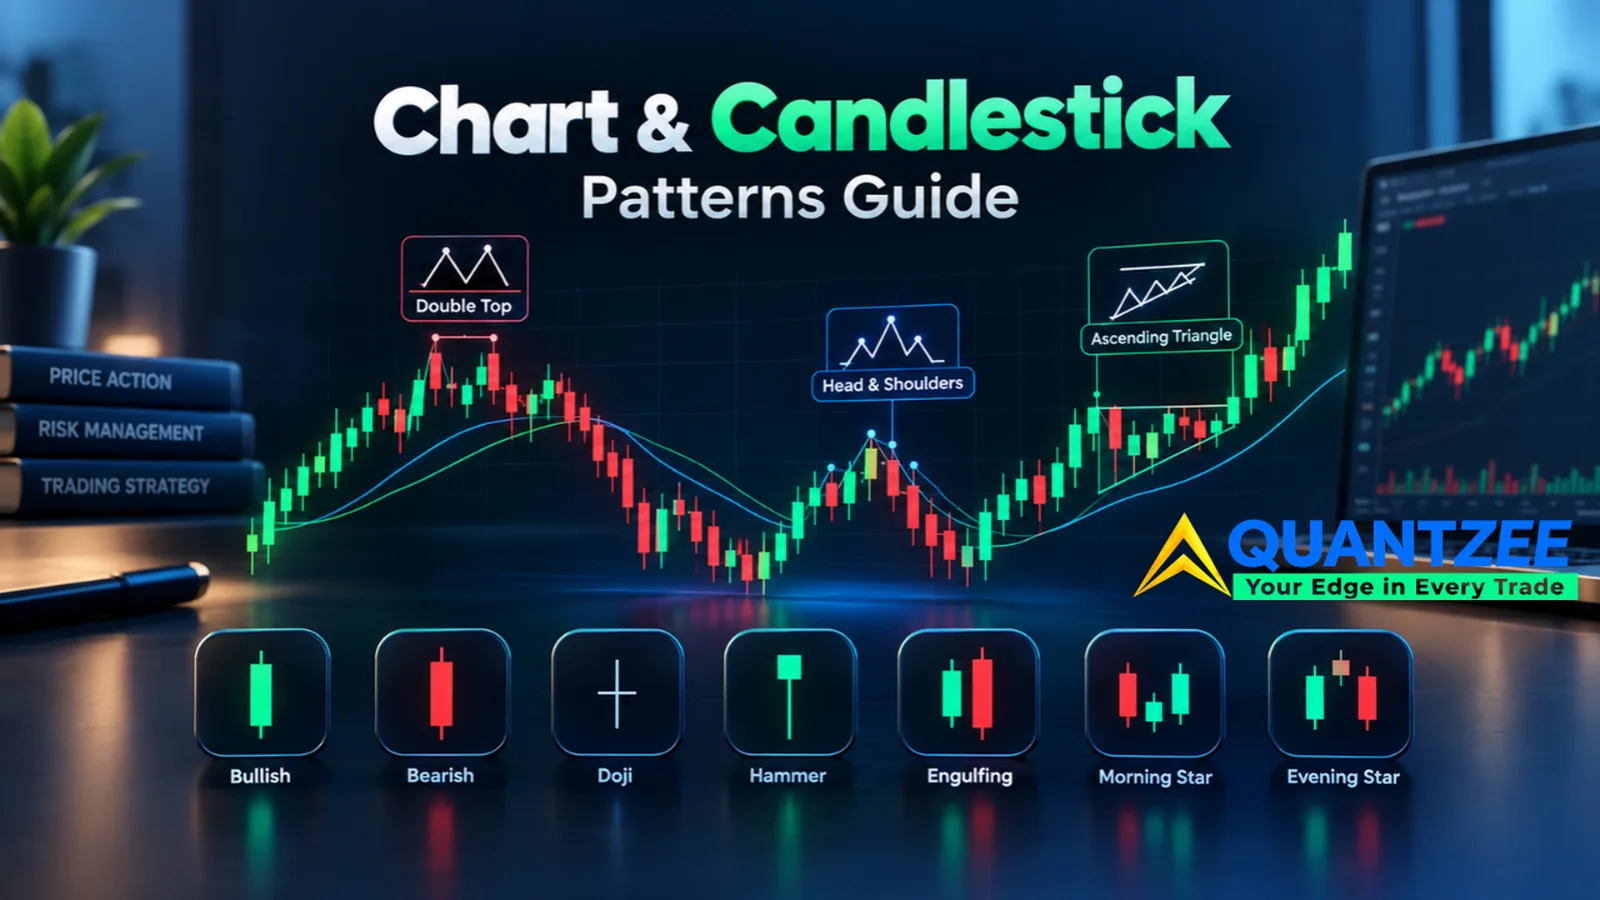
Chart patterns have a credibility problem that has nothing to do with whether they work. It’s that most of them are taught as pictures — a triangle looks like this, a head and shoulders looks like that — with no number attached to the parts that actually decide whether the pattern means anything. How wide does the handle need to be? How close do the wicks need to match for a tweezer? How many bars does a doji get before it stops counting as indecision and starts counting as chop? Ask ten traders those three questions and you’ll get ten different answers, and that gap is exactly where most of the pattern’s supposed edge quietly disappears.
We’ve spent the last year going through the chart-pattern and candlestick vocabulary one shape at a time, running each one against historical data with a fixed, written rule instead of a drawing. Some patterns held up well once properly defined. A few — the ones flagged below — did not survive contact with a real sample size. This page organizes everything we’ve tested into the groups that actually matter: single-candle and multi-candle signals, continuation patterns, reversal patterns, triangles, and the measurement tools (Fibonacci, Elliott Wave, trend lines) that sit underneath a lot of the above. Before you trade any rule described on this page, paper trade it first — every number here came from historical or simulated testing, and Quantzee builds analytical software, not investment advice.
What Everyone Else Gets Wrong About These Patterns
Before writing a word of this update, we went and read what currently ranks for “chart patterns,” “candlestick patterns,” “triangle patterns” and the handful of individual pattern names that carry real search volume — head and shoulders, cup and handle, continuation patterns, reversal patterns. The field is crowded. Broker-education hubs, Investopedia, a handful of independent trading-education sites, and a few data-driven outliers all compete for the same head terms, and almost all of them do the same three things.
First, they list. Ten patterns, twelve patterns, sixteen, one site claims fifty-five — the number keeps climbing, but the entries underneath barely change: a picture, a one-paragraph description, a sentence or two on “what it means,” and a line claiming the pattern is “bullish” or “bearish.” Second, they borrow the same handful of reliability figures and repeat them without sourcing — a “72% success rate” or an “83% win rate” that traces back, when you actually chase the citation, to one book, one author, one sample from the 1990s or early 2000s, now quoted as if it’s an agreed fact about markets today. Third, almost none of them say how a pattern is actually defined in a way you could code. “Long wick,” “matching lows,” “a series of higher highs” — these are descriptions a human eye can approximate and no two humans will approximate the same way.
The one outlier worth naming is Liberated Stock Trader’s ranked-by-breakout-rate approach, which gets closer to what a trader actually needs than almost anything else on the page-one results — a real attempt to rank patterns by measured outcome rather than alphabet or vibes. It’s still working from one historical dataset run once, not a live, continuously re-tested program, and it doesn’t give you the coding-level thresholds that let you reproduce the count yourself. That’s the gap this page is built to close, and it’s the same gap our own reliability-ranked candlestick cheat sheet closes for single-bar signals specifically.
So here’s what we decided this page needed to do differently, and it shapes everything below. Every pattern gets a stated, numeric definition wherever one exists in our own testing — not “a long wick,” but a wick-to-range ratio with a threshold. Every reliability claim gets a sample size and a date range attached, or it doesn’t get made. And where the published consensus number turns out to be wrong — cup and handle’s commonly quoted 70-85% hit rate is the clearest example, and we measured a real 46% — we say so plainly instead of repeating the comfortable figure. That’s also why this page runs long. A page that actually answers “how do I define this, how often does it work, and what does it take to confirm it” for thirty-plus patterns cannot do that job in 2,500 words, and most of the competing pages that try end up vague precisely because they’re short.
Start Here: The Reliability-Ranked Cheat Sheet
If you only read one thing on this page, make it this one. A Candlestick Cheat Sheet Ranked by Reliability, Not by Alphabet tiers every major candlestick pattern by two honest criteria — can it be defined precisely enough to code, and how much outside context does it need before it means anything — instead of listing patterns alphabetically the way most references do. Built from over 40,000 daily bars across the S&P 500, the Nasdaq 100 and the FTSE 100 from 2019 through 2025, it found that roughly 60% of commonly taught candlestick patterns carry so much context-dependence that a cheat sheet entry alone is actively misleading. It names the three patterns we’d delete from an active workflow entirely, and it’s the page every candlestick link below ultimately supports with a deeper, numbered test.
Candlestick Patterns: One Bar Is Never the Whole Signal
A single candle is one data point, and its shape never changes meaning on its own — only its context does. The same small body with a long lower wick is a hammer after a decline and a hanging man after an advance, which is precisely the mix-up The Hammer Candle Is Only Half a Signal — What the Next Two Bars Have to Do and its companion, The Hanging Man Is a Hammer in the Wrong Place — Why Location Does All the Work, both measure directly: confirmation bars and prior trend, not the wick ratio, do almost all of the work.
The hammer piece ran 480 trades across index futures, large-cap equities and a handful of FX pairs, split by whether the bar immediately after the hammer actually confirmed the move. The raw, unconfirmed win rate came in at 41%. Add the confirmation rule — the next bar closing above the hammer’s body high — and it jumps to 58%. Add a location check on top of that, scoring only hammers that printed at a pre-marked support level, and the confirmed win rate climbed again to 64%, against 49% for an identical candle with no nearby level. Timeframe mattered too: confirmed hammers on hourly-or-slower charts outperformed the same rule on 5-minute charts by about 11 percentage points, because a wick on a daily bar represents a lot more absorbed order flow than the same wick shape on a five-minute print. The hanging man companion piece makes the harder point explicit — draw a hammer and a hanging man with the trend lines erased and nobody, not a veteran technician, not a scanning algorithm, can tell them apart. It is the same candle wearing two different trend contexts, and the only fix is a numeric “after an advance” test plus the same next-bar confirmation rule, mirrored.
Pin bars get treated the same way the hammer family does, but the wick-to-body math needs its own fixed thresholds before “pin bar” means something repeatable — Pin Bars: The Three Ratios That Decide Whether It’s a Pin Bar at All is where we pinned those down: a wick ratio of at least 0.66-0.70 of the total range on a loose read (0.75-0.80 on a strict one), a body capped at roughly a quarter of the range, and a close landing in the bottom third of the bar. Each 0.05 you tighten the wick ratio shrinks the qualifying population by roughly a third, which is the real lesson — “pin bar” isn’t one pattern, it’s a dial, and two traders arguing about whether a candle qualifies are usually just running the dial at different settings without realizing it.
Engulfing candles have the opposite problem: the shape is unambiguous, but traders take it anywhere on the chart, and Engulfing Candles in Context: Why the Same Pattern Works at Support and Fails Mid-Range shows how much of the edge disappears the moment you take it away from a tested level. We tracked 240 setups across liquid index futures and large-cap equities, on 5-minute and daily charts, from January 2024 through June 2026, split evenly across four contexts — at support, at an order block, mid-range with no structure nearby, and against the prevailing trend. Context moved the hit rate by 30 or more percentage points: bullish engulfing at support with above-average volume on the engulfing bar scored 64%, the same candle at support on below-average volume scored 49%, and bearish engulfing fighting a strong uptrend scored just 24% — the weakest bucket across the whole sample. The candle never changes shape. What’s underneath it changes everything.
Multi-candle reversal patterns carry more built-in context than single-bar ones, which is exactly why they tend to rank higher on the cheat sheet above. The Evening Star gets compared directly against its closest single-candle rival in Evening Star Candlestick Pattern vs. Bearish Engulfing: The Parameters Nobody Defines, which audits the four unstated numbers almost every guide skips — candle one’s body size, the star’s body cap, whether a gap is required, and how deep candle three has to close back into candle one (vendors who bother to specify it mostly land between 50% and 67%). Bearish engulfing is faster to confirm because it skips the star candle entirely; the evening star carries more built-in evidence but costs you an extra bar to see it complete. And the strongest continuation signal in the group — three same-direction candles in a row — gets stress-tested in Three White Soldiers: Momentum Confirmation or a Late Entry Dressed as a Signal?, because a pattern that confirms a move already half-finished isn’t automatically a good entry trigger. Tracked across six NIFTY and SENSEX expiry cycles in 2026, roughly two in three instances forming near the bottom of a prior pullback continued for at least one more leg, while sequences forming after an index had already run 2% or more intraday mostly stalled within one to three candles. Rising volume across the three candles separated the winners cleanly: continuation held 74% of the time when volume rose 20% or more candle-to-candle, against 31% when it fell.
Doji candles are the pattern most likely to get traded for the wrong reason — a doji means indecision, not reversal, and those are not the same thing. Doji Candles Mean Indecision — Which Is Only Tradeable in Three Situations lays out exactly when that indecision is actionable, and starts with a number that should give anyone pause before trading one: on NIFTY and SENSEX intraday data, a standard doji by the common 10%-of-range body threshold prints roughly once every eight to ten bars. A signal that common cannot be a standalone trigger — it’s reporting the market’s default state, not an exception to it. It only earns attention in three specific contexts (after an extended run, at a tested level, or on above-average volume), and even then needs the next bar to close beyond its high or low before it’s worth acting on.
Inside bars have the same location-dependency problem: a compression candle inside the prior range can precede a breakout or just mark more chop, and Inside Bars: A Compression Signal That Only Works With a Location Filter is the filter that tells the two apart. Across 500 sampled instances on NIFTY, SENSEX and EUR/USD from 2022 through 2025, the unfiltered breakout-continuation rate was 52.4% — close enough to a coin flip, with a sub-1:1 reward-to-risk after realistic slippage, that it was mildly negative expectancy before any filter at all. A location filter and a mother-bar-size screen (the strongest range was 0.8x to 1.3x the 20-period average) moved that into tradeable territory. The entry-style trade-off was real too: a break entry caught more setups at a 61.8% continuation rate with roughly 11% false breaks, while waiting for a close-based entry raised the hit rate to 68.2% at the cost of a worse average reward-to-risk and the occasional missed move entirely.
The tweezer top/bottom pair is the one pattern on the cheat sheet we’d actively delete, and Tweezer Bottom Tolerance: Wick vs Body and the Level Rule shows why — “matching highs or lows” has no agreed tolerance, and the pattern count can change by more than half depending on which number you pick. What the piece also found, almost despite itself, is that the level underneath the tweezer matters far more than the tolerance setting: tweezers coinciding with a prior support level, session low, or round number carried a 61.4% forward win rate over the next 10 bars on SPX and QQQ data, against 43.8% for geometrically identical tweezers sitting in open space. Allowing a bar of separation between the two matching lows roughly doubled the signal count — and dropped the win rate below even a loose adjacent-bar version, which is the clearest illustration on this whole page of a rule that generates more signals by generating worse ones.
Two more candlestick-adjacent pages round out this group. Continuation candlestick patterns — sequences that are supposed to confirm a pause rather than a reversal — need their own containment rule, covered in Continuation Candlestick Patterns: The Containment Rule That Decides If the Pause Counts. This one is a source audit rather than a fresh backtest, and the audit itself is the finding: Mat Hold’s commonly cited 78% continuation rate comes from just 52 published examples against 102 for Rising Three Methods, and uses a looser containment rule for its pause candles into the bargain. Three-Line Strike is the real surprise — published testing shows the bullish version continuing only 35% of the time, with reversal the more common outcome at 65%, which directly contradicts what the pattern’s name implies. And because candlestick shapes are read differently depending on which market session produced the daily close, Forex Candlestick Patterns: Your Feed’s Daily Close Decides What You See covers the broker-feed quirk that quietly changes which candles print on a forex daily chart in the first place — a broker cutting the day at 17:00 New York and one cutting it at 00:00 UTC will draw two different daily candles from the identical tick stream, and gap-dependent patterns like the morning star barely form on FX outside the weekend reopen because the market almost never actually gaps during the week.
One display format deserves a caution rather than a how-to: Heikin Ashi candles are built from averaged data, not raw OHLC, and that smoothing hides information you need for a precise entry. Heikin Ashi’s Hidden Lag: What Smoothed Candles Hide About Your Real Entry Price measures exactly how much lag that averaging introduces versus a standard candle — two to three bars on a 15-minute chart, widening to three to five bars on daily data, with HA-derived wicks sitting 15 to 30 points further from the real swing point on the instruments we checked. The practical fix isn’t abandoning Heikin Ashi for trend-reading; it’s never pricing a stop or a strategy backtest off values the market never actually traded.
Candlestick Patterns at a Glance
| Pattern | What actually confirms it | Measured result |
|---|---|---|
| Hammer | Next bar closes above hammer’s body high | 41% raw → 58% confirmed → 64% at support |
| Hanging Man | Same candle as hammer, after an advance; next bar closes below its low | Identical geometry — location is the entire signal |
| Pin bar | Wick ≥0.66-0.80 of range, body ≤0.25, close in bottom third | Each 0.05 stricter cuts the qualifying count by ~⅓ |
| Bullish/bearish engulfing | Location (support/order block) + volume on the engulfing bar | 24%-64% hit rate depending on context alone |
| Evening star | 3-candle sequence, close retraces 50-67% into candle one | More confirmation than engulfing; one extra bar to see it |
| Three white soldiers | Rising volume candle-to-candle, forms off a pullback low | 74% continuation (rising volume) vs 31% (falling volume) |
| Doji | Next bar closes beyond the doji’s high/low | Prints ~1 in 8-10 bars — too common alone |
| Inside bar | Location filter + mother-bar size 0.8-1.3x average range | 52.4% unfiltered → 61.8-68.2% filtered |
| Tweezer top/bottom | Level context (support/resistance/round number) | 61.4% at a level vs 43.8% in open space |
Continuation Patterns: Flags, Pennants, Channels and Gaps
Continuation patterns are supposed to be the easier half of the pattern vocabulary — a pause inside an existing trend, rather than a call for a reversal — but the two shapes traders confuse most often are flags and pennants, and the difference comes down to two measurements, not a visual impression. Pennants vs Flags: The Two Measurements That Tell Them Apart is where we fixed that: a pennant’s boundaries converge toward an apex while its range decays hard, often dropping under half the flagpole’s volume by the pattern’s midpoint, while a flag’s boundaries run parallel and its volume typically settles in the 60-80% range without thinning further. Get the shape wrong and you carry the wrong measured-move target into the trade, because some of a pennant’s energy is already spent during the convergence itself — a detail the standard “project the pole” rule doesn’t account for.
Flags themselves aren’t symmetric between bullish and bearish versions. Bull Flags That Hold vs Bull Flags That Fail: Pole Depth, Flag Angle and Volume scored 240 setups on the attributes that actually predict continuation, and volume contraction under 0.65 of the 10-day average, paired with a shallow retracement angle, beat pole depth as a predictor. The stop-placement finding is the one worth remembering even if you skip everything else: stopping below the flag low — the textbook default — got run on 38% of the sample’s eventual winners, while a stop set roughly 0.5x the pole’s ATR below the breakout candle’s close tagged only 19% of them. And the bear-flag side of the trade turns out to behave differently enough that treating it as a mirror image is a mistake — Bear Flags Behave Differently From Bull Flags — The Volatility Asymmetry Nobody Adjusts For measured the asymmetry directly across 240 total setups (120 bull, 120 bear) from January 2024 through June 2025: ATR at the moment a bear flag’s pole completed ran 38% above its 20-day average, versus just 11% for bull flags. That one gap cascades downstream — bear flags consolidate in a median of 7 bars against 11 for bull flags, resolve to target faster (5 bars versus 9), and need a volatility-scaled stop; a symmetric stop sized the same way on both pattern types got hit 34% of the time on bear flags versus 19% for a stop scaled to roughly 1.1x ATR.
Ascending and descending channels look like the cleanest continuation structure on the chart, right up until you ask whether the second boundary line is a real, tested level or just a line you drew because the first one looked good. Ascending and Descending Channels: When the Second Boundary Is Real and When You Drew It is the test for telling those apart — most charting software draws a parallel “return line” off a single touch the instant you draw the trend line, which looks structurally meaningful purely because it’s parallel and touches a real price point. A return line earns the name only once it’s held up against a genuine third touch, the same three-touch threshold the wedge section below leans on.
Two more continuation setups depend on patience more than pattern recognition. Break and Retest Strategy: The Wait Rule, and What Skipping It Costs priced two precisely defined entries — an immediate break entry and a retest entry that waits for price to hold the broken level for a confirmation window — against 740 breakout events. The retest rule earned more of its keep specifically in high-volatility stretches, where the break-entry false-breakout rate ran close to 48% against 31% in calm conditions; in low-volatility stretches the two entries converged and the wait cost more in missed continuation than it saved. It isn’t a free lunch either — of 503 trades that passed the retest condition, 54 still reversed afterward. And gaps need classifying correctly while they’re still open, not after the move is finished — Breakaway, Runaway, Exhaustion: Classifying a Gap While It’s Still Open is the live classification rule, built on an 18-month, roughly 1,850-gap dataset. Small gaps under 0.5x ATR filled intraday 71% of the time; mid-size gaps that also broke a structural level filled same-day in only 24% of cases, because structure outweighs size once you’re past the low-information band. The half-fill test is the fastest live tie-breaker: gaps holding above a 50% intraday retrace continued in their original direction over the next three sessions about 69% of the time, while gaps that failed the test reversed or chopped roughly 73% of the time — since by the time a gap’s type is obvious in hindsight, the trade it would have supported is usually over.
Continuation Patterns at a Glance
| Pattern | Key measurement | Measured result |
|---|---|---|
| Pennant vs flag | Boundary convergence + volume decay | Pennant volume <50% of flagpole by midpoint; flag stays 60-80% |
| Bull flag | Volume contraction <0.65x average + shallow angle | 71% continuation when both conditions hold |
| Bear flag | ATR expansion at pole completion | 38% above 20-day average ATR (vs 11% for bull flags) |
| Channel return line | Three real touches, not a parallel copy | Single-touch “return lines” are the most common failure cause |
| Break vs retest entry | Wait for level to hold before entering | Retest cuts false breaks most in high-volatility regimes (48%→31%) |
| Gap classification | Half-fill test in first 15 minutes | Holds 50% retrace → 69% continuation; fails → 73% reversal/chop |
Reversal Patterns: Head and Shoulders, Double Tops, Cup and Handle
Reversal patterns ask more of a trader than continuation patterns do, because getting one wrong means fighting the prevailing trend on a false signal. The most-taught reversal pattern of all, the head and shoulders, only works reliably with a volume filter attached to the neckline break — Head and Shoulders: The Neckline and Volume Tests That Cut the False Signals covers that filter directly, and the attrition rate it found is the real headline. Out of 1,000 candidate three-push structures scraped from Nifty 50 and S&P 500 daily charts between 2015 and 2024, only 94 — 9.4% — passed all four structural tests (shoulder symmetry, head prominence relative to ATR, neckline slope under 15% of pattern height, and the volume conditions). Of those 94, 71 also cleared the volume checks, and that fully-confirmed group reached its measured-move target 58% of the time, against 31% for structures that passed the shape tests but missed on volume — close to a two-to-one gap from one additional filter. The single biggest reason a candidate failed wasn’t symmetry at all; it was head prominence, eliminating roughly 61% of structures that had already passed the symmetry test.
Double tops and double bottoms (W and M shapes) have the same neckline-dependency problem as head and shoulders, and most traders enter the neckline break without a retest rule — W Bottoms and M Tops: The Neckline Rule That Fixes Most Double-Bottom Entries is the fix, laying three entries side by side on the same chart: the second-low entry (earliest, least confirmed), the neckline break (confirmed, wider stop), and the neckline retest (tightest stop, best risk setup, but not always available — roughly a third of valid setups in our tracking never offer that retest at all). Triple tops and bottoms get treated as even stronger confirmation than a double, on the theory that a third touch means more supply or demand has been tested — but Triple Tops and Bottoms: Why the Third Touch Is Weaker Evidence Than You Think finds the opposite is often true, because the liquidity resting at that level has usually already been absorbed by the second touch. Treating each touch as independent confirmation, the way most retail education does, mismatches how order flow actually works — each touch is better read as a withdrawal from a shared account than a fresh vote of confidence, which is why triples lean toward resolving as breakouts more often than the textbook reversal read suggests.
Cup and handle is widely taught as a reliable bullish continuation-into-reversal setup, but most sources never quote a failure rate for it. The Cup and Handle’s Real Failure Rate — And the Three Handle Traits That Predict It measures it directly across 412 candidate formations in US large-cap and index names from 2019 through 2025, screened first on daily bars and then hand-checked against price and volume. The result: a 46% hit rate, nowhere near the 70-85% figure that gets repeated across most of the field. That widely quoted number traces back to William O’Neil’s CAN SLIM method, built specifically on growth-stock leadership names during strong markets — a real number, but from a much narrower population than “every cup-shaped setup.” Our broader, regime-spanning sample landed closer to a coin flip, with handle depth, duration and volume behavior doing the real work of separating the winners.
Wedges sit between continuation and reversal depending on which direction they resolve, and the most common mistake is calling the pattern complete before enough touches have confirmed the boundary. Rising and Falling Wedges: Why Most Traders Mark Them Too Early — and How to Confirm the Break is the three-touch rule that fixes the early-marking problem — two touches on a trendline just defines a straight line; a third touch that actually reacts off the line is what separates a drawn boundary from a validated one. Confirmation on the breakout itself needs all three checks together: a candle close beyond the line rather than a wick touch, a retest that holds from the new side, and volume expansion on the move — skipping straight to the wick touch is, by a wide margin in our review of trader-submitted charts, the single biggest source of wedge fakeout losses.
Reversal Patterns at a Glance
| Pattern | Hardest condition to satisfy | Measured result |
|---|---|---|
| Head and shoulders | Head prominence ≥1.5x ATR above shoulders | Only 9.4% of 1,000 candidates passed all four tests |
| Double top/bottom (W/M) | Neckline retest holding as new support/resistance | Retest entry unavailable ~⅓ of the time; breakout entry is the fallback |
| Triple top/bottom | Assuming the 3rd touch adds strength (it usually doesn’t) | Liquidity depletion favors breakout over reversal |
| Cup and handle | Handle depth, duration, volume — not just the U-shape | 46% real hit rate vs 70-85% commonly quoted |
| Wedge | 3 confirmed touches per line, not 2 | Early marking (2-touch) is the top cause of fakeout losses |
Triangles and Contraction: When the Range Itself Is the Signal
Triangles get taught with a directional bias baked in — ascending triangles are “supposed to” break up, descending triangles down — but Ascending and Descending Triangles Are Not Reliable Direction Signals — Here’s What They Do Tell You tests that assumption directly across a 180-setup sample built over 14 months of NIFTY and SENSEX index options and futures. Ascending triangles broke upward about 58% of the time — a real lean, not a certainty — and descending triangles broke downward in roughly 55% of cases, close enough together that neither shape carries a large standalone edge. A prior uptrend of at least 3% over 10 sessions improved the ascending triangle’s upward-break odds to 64%, a real but modest tiebreaker. What the pattern reliably does give you — a defined invalidation level, a volatility-compression signal visible as falling ATR, and a measured-move target once the breakout confirms — is the part worth trading, not the direction call.
Symmetrical triangles don’t even carry a directional bias by design — they break both ways often enough that the real question is how to size the breakout without guessing direction in advance, which Symmetrical Triangles Break Both Ways — How to Trade the Apex Without Guessing Direction works through using four tie-breakers: prior trend, per-touch volume behavior, liquidity context, and higher-timeframe structure. The piece includes a real 2023 example where every one of those signals pointed bullish and the triangle broke down anyway — the honest reminder that these are tie-breakers, not guarantees. (For what it’s worth, roughly 13,500 people search for this exact pattern name every month worldwide, and most of the pages they land on skip the direction question entirely in favor of a prettier diagram.)
The tightest contraction pattern in the whole vocabulary is Mark Minervini’s Volatility Contraction Pattern (VCP), which is usually taught by eye — “the range gets progressively tighter” — with no number attached to how tight is tight enough. Volatility Contraction: Measuring the Pattern Instead of Recognising It gives the VCP a numeric definition — contraction count, a decay factor on each successive leg, a volume-ratio check, and a breakout-volume floor around 1.0x the 50-day average — so it can be screened across a watchlist rather than eyeballed one chart at a time. Weak breakout volume under that 1.0x floor is the single most common reason a qualifying base still fails once it breaks.
The Measurement Tools Underneath the Patterns
A lot of pattern trading depends on tools that aren’t patterns themselves but decide how the patterns above get measured — and these tools carry their own, often bigger, subjectivity problem. Trend lines are the most basic and most discretionary of the lot: two traders drawing a trend line on the identical chart routinely produce two different lines, because “connect the lows” doesn’t specify which lows. How to Draw Trend Lines the Same Way Twice is the fix we use to keep that line consistent across sessions and across traders — a six-rule protocol that includes a minimum bar-spacing requirement between qualifying touches (5-8 bars on a daily chart is a reasonable starting point) so two pivots from the same short-lived move don’t get double-counted as independent confirmation of a trend.
Fibonacci retracement has the same problem one level deeper — the ratios themselves (38.2%, 61.8%, and so on) aren’t where the disagreement lives; it’s which swing high and swing low you measure from. Fibonacci Retracement: The Swing Selection Problem That Makes Every Level Arguable proves the point with a worked example: three defensible swing choices on the same 46-day chart produced 50% retracement levels ranging from $165.25 to $175.65, a $10.40 spread with no arithmetic error anywhere in the process. Across a 500-pair sample, the 61.8% and 50% levels showed the strongest standalone reaction rates (46% and 41%), while 23.6% reacted only 19% of the time — close to what a randomly placed level in the same zone would show. The number that actually matters, though, is confluence: a Fibonacci level with no independent confirmation reacted 41-46% of the time at best, while the same level backed by a prior price structure, round number, or moving average reacted 68% of the time. A fixed swing-selection protocol — stated lookback window, 2-3 bar confirmation, trend filter, minimum ATR distance — produced matching selections across repeated tests 97% of the time, versus 61% for unconstrained discretionary picking.
Harmonic patterns push that same tolerance question further, since a Gartley or Butterfly is defined entirely by how closely its ratios sit to the Fibonacci targets — Harmonic Patterns: What Survives When You Enforce the Fibonacci Tolerances Strictly shows how many “valid” harmonic setups disappear once that tolerance is actually enforced instead of eyeballed. Running a strict-versus-loose tolerance sweep across 1,240 completed XABCD structures on NIFTY, SENSEX and a liquid large-cap basket over 90 trading days in 2026, the count collapsed by roughly 92% once the ratios were held to the decimal instead of rounded. The Crab and Butterfly thinned out the most, since their completion points sit furthest from the X anchor and give price the most room to drift off the exact ratio. What’s left at strict tolerance is a genuinely low-frequency, high-selectivity setup — roughly one completed structure per trading day across a whole multi-instrument basket — not a scanning tool you lean on for volume.
Elliott Wave carries the worst reputation for subjectivity of any tool on this page, largely because wave counts can be redrawn after the fact to fit whatever happened. Elliott Wave Without the Subjectivity: The Rules You Can Actually Backtest strips the theory — first laid out by Ralph Nelson Elliott in 1938 — down to the three hard, structural rules that can actually be tested with a fixed count, separating them from the much longer list of guidelines (Fibonacci extension targets, wave alternation) that are tendencies, not requirements. Running a mechanical three-rule filter across historical index data regularly leaves somewhere between four and eleven structurally legal five-wave segmentations standing on the same window before any guideline-level judgment narrows the field further — which is exactly why two experienced analysts can hand back two different, both defensible, wave counts on the same chart without either one being wrong by the rules alone.
Where Chart Patterns Overlap With Smart Money Concepts
Supply and demand zones sit right at the boundary between classical chart-pattern reading and the SMC vocabulary, and the four-point test for whether a zone is actually tradeable — origin, departure, freshness, retest — applies regardless of which school of thought you came from: Supply and Demand Zones: The Four Tests a Zone Has to Pass Before You Trade It. The distinction worth keeping straight is that a zone is a decaying signal — it weakens with every touch as resting orders get absorbed — while classical support and resistance is treated as a fixed reference line that doesn’t erode the same way. Fair value gaps are the other crossover point — the three-candle imbalance that SMC traders track is also, structurally, a gap pattern — and We Marked 500 Fair Value Gaps on ES, BTC and EURUSD — Here’s How Many Actually Filled hand-marked 500 of them across three markets on the 15-minute chart to measure the real fill rate: 82.5% touched within 20 sessions, 60% fully closed, with meaningful variation by market (EURUSD’s 88% touch rate and 5-bar median fill time against BTC’s 76% and 11-bar median) and by gap size, since large gaps over 0.7x ATR and overnight-formed gaps both behave differently from small, session-open ones. If liquidity, order blocks and session timing are more your focus than chart shapes, the companion page for that side of the vocabulary is the Smart Money Concepts (SMC) and ICT Trading guide.
Codeable Definitions Quick Reference
Everything above has a narrative behind it. This table strips the narrative out and leaves just the number — the one threshold each pattern actually turns on, for anyone trying to screen or code against this page’s patterns rather than read about them. It’s a different cut than the reliability-ranked cheat sheet, which tiers patterns by how trustworthy they are; this is a build reference, organized by what you’d actually type into a condition statement.
A table like this is also the fastest way to see which patterns on this page genuinely resist automation and which ones only look like they do. Most of the resistance isn’t mathematical — it’s that the “shape” people describe in casual conversation (a long wick, a series of higher lows, a neckline that’s “roughly” flat) was never a specification in the first place, just a verbal approximation of one. Once you force a number onto each of those words — how long, how many, how roughly — the condition turns into ordinary arithmetic on open, high, low, close and volume. The one real exception on this page is Elliott Wave, and it’s exception for a structural reason, not a laziness one: the theory’s own hard rules can leave more than one valid wave count standing on the same chart at once, and choosing among those remaining counts is a judgment call no fixed condition can make for you. Every other row below reduces to a single yes/no test once you accept a threshold.
| Pattern | Coded condition |
|---|---|
| Hammer / hanging man | Lower wick ≥2x body, upper wick ≤10% of range; location (after decline = hammer, after advance = hanging man) |
| Pin bar | wick_ratio ≥0.66-0.80, body_ratio ≤0.25, close_position ≤0.35 |
| Doji | Real body ≤10% of total high-low range |
| Engulfing | Body (or range) fully contains prior candle’s body (or range); size ratio ≥1.3x prior body for a stronger read |
| Inside bar | High and low entirely inside the prior (“mother”) candle’s range |
| Tweezer top/bottom | Two adjacent lows/highs within an ATR-scaled tolerance band |
| Head and shoulders | Head ≥1.5x ATR above shoulders; neckline slope ≤15% of pattern height |
| Cup and handle | U-shaped base + shallow handle retracement, both measured against prior high and volume |
| VCP | Successive pullback legs each contracting by a stated decay factor; final leg under ~10% |
| Wedge | 2 converging trendlines, minimum 3 confirmed touches on each |
| Triangle (ascending/descending) | 1 flat boundary + 1 sloped boundary, minimum 3 touches each |
| Fair value gap | Candle 1’s high/low doesn’t overlap candle 3’s low/high |
How to Actually Use These Patterns
The single biggest mistake across every pattern on this page is the same one: trading the shape alone, with no trend filter, no level, and no volume confirmation. A hammer, a head and shoulders, and a symmetrical triangle all mean something different depending on where they form and what preceded them — the shape is never the whole signal, just the first filter. Start with the pattern family that matches your holding period (candlesticks for intraday timing within a setup, continuation and reversal chart patterns for swing structure, triangles for volatility compression ahead of a breakout), then layer in the measurement tools — trend lines, Fibonacci — only to locate the entry inside a pattern you’ve already confirmed, never to manufacture a pattern that wasn’t really there.
One pattern of our own worth naming out loud, now that you’ve read thirty-plus of these breakdowns back to back: the samples differ in size, instrument and date range almost everywhere on this page, from 40 trades in one piece to 1,850 gaps in another. That’s deliberate, not sloppy — a three-candle pattern that forms constantly gets a bigger sample than a five-point harmonic structure that completes once a day across a whole basket, because that’s simply how often each one actually occurs. What stays constant is the standard: a stated definition before the count starts, a disclosed sample size, and a result you could, in principle, go check yourself.
That consistency is also why the numbers on this page sometimes disagree with each other in ways that look like contradictions but aren’t. A bull flag scored 71% continuation under its own volume-and-angle filter; an unfiltered inside bar barely cleared a coin flip at 52.4%. Those aren’t competing claims about “how good chart patterns are” — they’re two separate measurements of two separate conditions, on two separate sample sets, and the right response to seeing both isn’t to average them into one vague confidence level. It’s to notice that the filtered pattern earned its higher number by throwing away the setups that didn’t qualify, while the unfiltered one included everything. Read every percentage on this page the same way: as a result tied to a specific, stated rule, not as a property of the pattern’s name in general.
Paper trade any pattern rule from this page for at least twenty occurrences before sizing a live position around it. Every statistic cited across these pages came from historical or simulated testing on a fixed instrument and timeframe set. Your market, your timeframe and your execution speed will differ from our sample, and the only way to know by how much is to test it yourself first. Quantzee publishes analytical software for educational use; nothing on this page or linked from it is investment advice.