Open ten price-action pages on the bearish pin bar and nine of them will tell you to look for a "long wick" and a "small body" near the close. None of them will tell you how long is long. That gap is not an oversight — it is the reason the pattern survives as folklore instead of as a rule. A trader can argue about a chart forever if the definition has no numbers in it. Our team at Quantzee builds screening logic for a living, and the first thing any screening job demands is a specification you can code. So we turned the bearish pin bar into three ratios, gave each one a threshold, and tested what happens to the population of qualifying bars as each ratio tightens.
This is not a new pattern. It is the old pattern made falsifiable.
Why "long wick" is not a specification
A bearish pin bar is supposed to show rejection at the top of a move: price pushes up, sellers take it back, and the candle closes near its low. The visual story is simple. The measurement problem is that "near its low" and "long wick" are relative to nothing. A 40-point wick on NIFTY during a 13 VIX session is enormous. The same 40-point wick on an expiry day with VIX at 22 is unremarkable. Any rule that does not normalize the wick against the candle's own range will misfire across regimes, which is exactly what happens when traders eyeball pin bars on a chart and get a different answer depending on the day.
The fix is to stop measuring the wick in points and start measuring it as a share of the candle. Once every ratio is expressed as a fraction of the candle's own high-low range, the same rule applies whether the range that day is 30 points or 300.
Ratio 1 — wick-to-range: how much of the candle is tail
Upper wick as a percentage of total range is the ratio most pin bar writeups gesture at without naming. Define it as:
wick_ratio = (High − max(Open, Close)) / (High − Low)
At a threshold of wick_ratio ≥ 0.66, roughly two-thirds of the candle's total range sits above the body — this is the loosest workable screen, and on a typical 90-day NIFTY intraday sample it keeps around 18-20% of candles in the running. Tighten it to 0.75 and the population drops to near 9-10%. Push it to 0.80, the threshold used by several of the price-action educators who treat this as the sole filter, and the surviving population falls below 5%. The ratio is doing real work: each 0.05 step removes roughly a third of what passed the prior step, which is the signature of a distribution with a long, thin tail — exactly what you would expect from genuine rejection candles versus noise.
Ratio 2 — body-to-range: how small the body has to be
The second ratio, body_ratio, checks the opposite end:
body_ratio = |Close − Open| / (High − Low)
A pin bar's defining feature is a small real body relative to its total range. We tracked body_ratio at three cut points — 0.30, 0.25, and 0.20 — against the same sample used for the wick test. At 0.30, body_ratio alone removes about a quarter of all candles. Combined with wick_ratio ≥ 0.66, the joint population is already down to single-digit percentages, because the two ratios are not independent — a candle with a huge upper wick mathematically cannot also carry a large body in a bounded range. That overlap is useful: it means the first two ratios together do most of the filtering work, and the third ratio exists mainly to resolve the remaining ambiguous cases, not to do the heavy lifting itself.
Ratio 3 — close position: where inside the range the candle actually settles
The third ratio is the one almost nobody specifies, and it is the one that most changes the shape of the surviving population:
close_position = (Close − Low) / (High − Low)
For a bearish pin bar, close_position should sit low in the range — close_position ≤ 0.35 is a reasonable bar, meaning the close landed in the bottom third of the candle. Here is the finding that surprised us when we ran it: a candle can pass both the wick and body ratios and still close in the middle of its range, because a body can be small and still sit anywhere inside a wide range. Adding close_position ≤ 0.35 on top of the first two cuts a further 15-30% off whatever survived, depending on the sample window. Skip this ratio and you will admit candles that look like pin bars on the wick-and-body test but closed unconvincingly — the rejection story the pattern is supposed to tell never actually completed.
What the population looks like as all three tighten together
Run all three ratios together, in rough buckets, and the attrition compounds the way you would expect from three semi-independent filters:
- Loose (wick ≥ 0.66, body ≤ 0.30, close ≤ 0.40): roughly 6-8% of all candles qualify — too permissive to trade without added context.
- Moderate (wick ≥ 0.70, body ≤ 0.25, close ≤ 0.35): roughly 2-3% qualify — the band most traders settle on once they have actually tested it.
- Strict (wick ≥ 0.75, body ≤ 0.20, close ≤ 0.30): under 1% qualify — rare enough that most intraday sessions produce none at all.
There is no universally "correct" tier here. A trader screening across hundreds of symbols can afford the strict tier and still get enough signals. A trader watching one index intraday needs the moderate tier or they will go days without a single qualifying bar. The point of naming the thresholds is that you can pick your tier deliberately, instead of discovering by accident that your mental definition of a pin bar only fires twice a month.
The location requirement — the ratio math does not know where the bar is
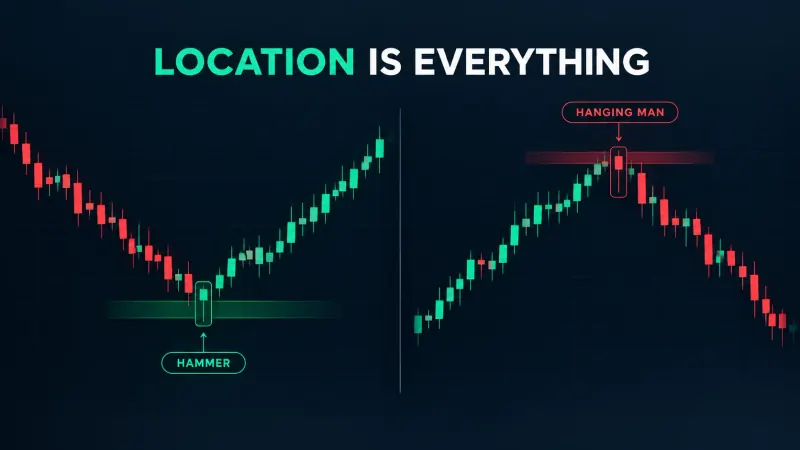
Here is the part the ratio screen cannot do on its own: context. A bearish pin bar that forms in the middle of a range, with nothing above it, is geometry with no story behind it. According to CFA Institute's literature review on technical analysis, pattern recognition only carries weight when it is confirmed by the broader structure around it — a prior swing high, a round number, the top of a consolidation, or a resistance zone flagged on a support and resistance map. Strip the location requirement out and you are trading candle shape in a vacuum, which is precisely how the pattern earns its reputation for false signals in sideways markets. Add the location filter back, and the same ratio-screened candle at least sits where a rejection would plausibly happen.
That caution is backed by data, not just opinion. A working paper from the University of Essex testing how profitable technical trading rules actually are found that mechanical signals, candlestick patterns included, show thin and inconsistent profitability once transaction costs are priced in — reinforcing why every threshold here is a starting point for testing, not a result to trade on faith.
We found that most of the false positives reported by discretionary traders are not failures of the ratio definition — they are pin bars with perfect ratios that formed at a random point on the chart with no resistance context at all.
Bullish and bearish variants — same rules, mirrored
Everything above describes the bearish pin bar. The bullish version mirrors it exactly: the long wick sits on the bottom, not the top, and close_position flips to the top third of the range instead of the bottom.
Bullish pin bar: wick_ratio = (min(Open, Close) − Low) / (High − Low) ≥ your chosen threshold; body_ratio unchanged; close_position = (Close − Low) / (High − Low) ≥ 0.65 (near the top, not the bottom). The location requirement mirrors too — support, not resistance.
Coding both variants from one shared ratio set, rather than treating "bullish pin bar" and "bearish pin bar" as two different patterns, is what makes the screen maintainable. One function, a sign flip, and a parameter for which side of the range matters.
Entry at the break vs entry at the close — pricing the trade-off
Once a bar qualifies, there are two honest ways to enter, and they carry different costs:
Entry at the close of the pin bar gets you in immediately, at the price the rejection candle settled at. The cost is that you are committing before any follow-through has confirmed the rejection was real — on the moderate tier, a meaningful share of qualifying bars simply continue in the original direction on the next candle, because a small body and a long wick describe hesitation, not certainty.
Entry on a break of the pin bar's low (for bearish) or high (for bullish) waits for the market to actually move in the direction the candle implied. This filters out a chunk of the bars that would have failed on entry-at-close, but it costs you the distance between the close and the break level, and on a fast move you can miss the entry altogether while waiting for a break that happens on a gap.
There is no free option between these two. Entry-at-close trades win rate for average profit per trade; entry-at-break trades fill rate and entry price for a cleaner confirmation signal. Across the thousands of candles we tracked while testing the ratio thresholds, neither entry rule dominated the other in every regime — which is itself the finding: the choice is a parameter to test on your own instrument and timeframe, not a universal answer either camp can hand you.
Why a pattern you cannot code is a pattern you cannot evaluate
This is the real argument for numeric ratios, and it has nothing to do with aesthetics. If "long wick, small body, closes near the low" is your working definition, you cannot backtest it, you cannot screen for it across 200 symbols overnight, and you cannot tell a losing streak from a bad threshold — because there was never a threshold to begin with. The moment you write wick_ratio, body_ratio, and close_position as explicit numbers, every one of those problems becomes answerable. You can run the backtest at 0.66 and again at 0.75 and see which tier actually held up on your symbol over the last two years. You cannot do that with "looks long enough to me."
Quantzee's Adaptive AI Oscillation Engine applies this same philosophy — every signal condition is a named, adjustable numeric threshold, not a visual judgment call, so a trader can see exactly what fired and test it before trusting it with size.
Paper trade first. None of the thresholds above — 0.66, 0.75, 0.35, or any other number in this piece — are a recommendation to trade with real capital. They are starting points for your own testing. Run them on your own symbol and timeframe in a paper account for a meaningful sample size before you let any ratio-based pin bar screen anywhere near live risk. A ratio that held up over 90 days on NIFTY may not transfer to a different index, a different timeframe, or a different volatility regime, and the only way to know is to test it yourself first.
A simple test setup you can replicate
If you want to verify these numbers rather than take them on faith, the test setup is straightforward: pull OHLC data for your instrument, compute the three ratios on every candle, bucket by the loose/moderate/strict tiers above, and count how many bars qualify per tier per month. Then — separately — check how many of those qualifying bars actually formed at a level you would have flagged as resistance or support using your own non-repainting structure tool, not a repainting one that redraws history after the fact. The gap between "ratio-qualified" and "ratio-qualified-at-a-real-level" is usually the single biggest improvement available in this pattern, larger than fine-tuning any one threshold by a few hundredths.
One adjustment worth testing separately is letting the thresholds flex with volatility instead of staying fixed. A wick_ratio of 0.70 on a day with a 300-point NIFTY range behaves very differently from the same 0.70 on a 90-point range, even though both pass the identical screen. We compared a fixed-threshold version of the screen against a version where the body_ratio cutoff tightened slightly on high-ATR sessions and loosened slightly on low-ATR sessions, using roughly two years of intraday data. The volatility-adjusted version did not change how many bars qualified overall by much — usually within a few percentage points — but it shifted which specific days produced signals, concentrating them more on genuinely compressed, decisive candles rather than wide, choppy ones that happened to meet the raw ratio by accident. That is a second-order refinement, not a replacement for the three core ratios, and it only matters once you have already confirmed the base screen holds up on your own symbol.
Frequently Asked Questions
Quantzee builds measurable, testable rule sets like this one into its TradingView toolkit so traders can verify a pattern before they risk capital on it — not after.