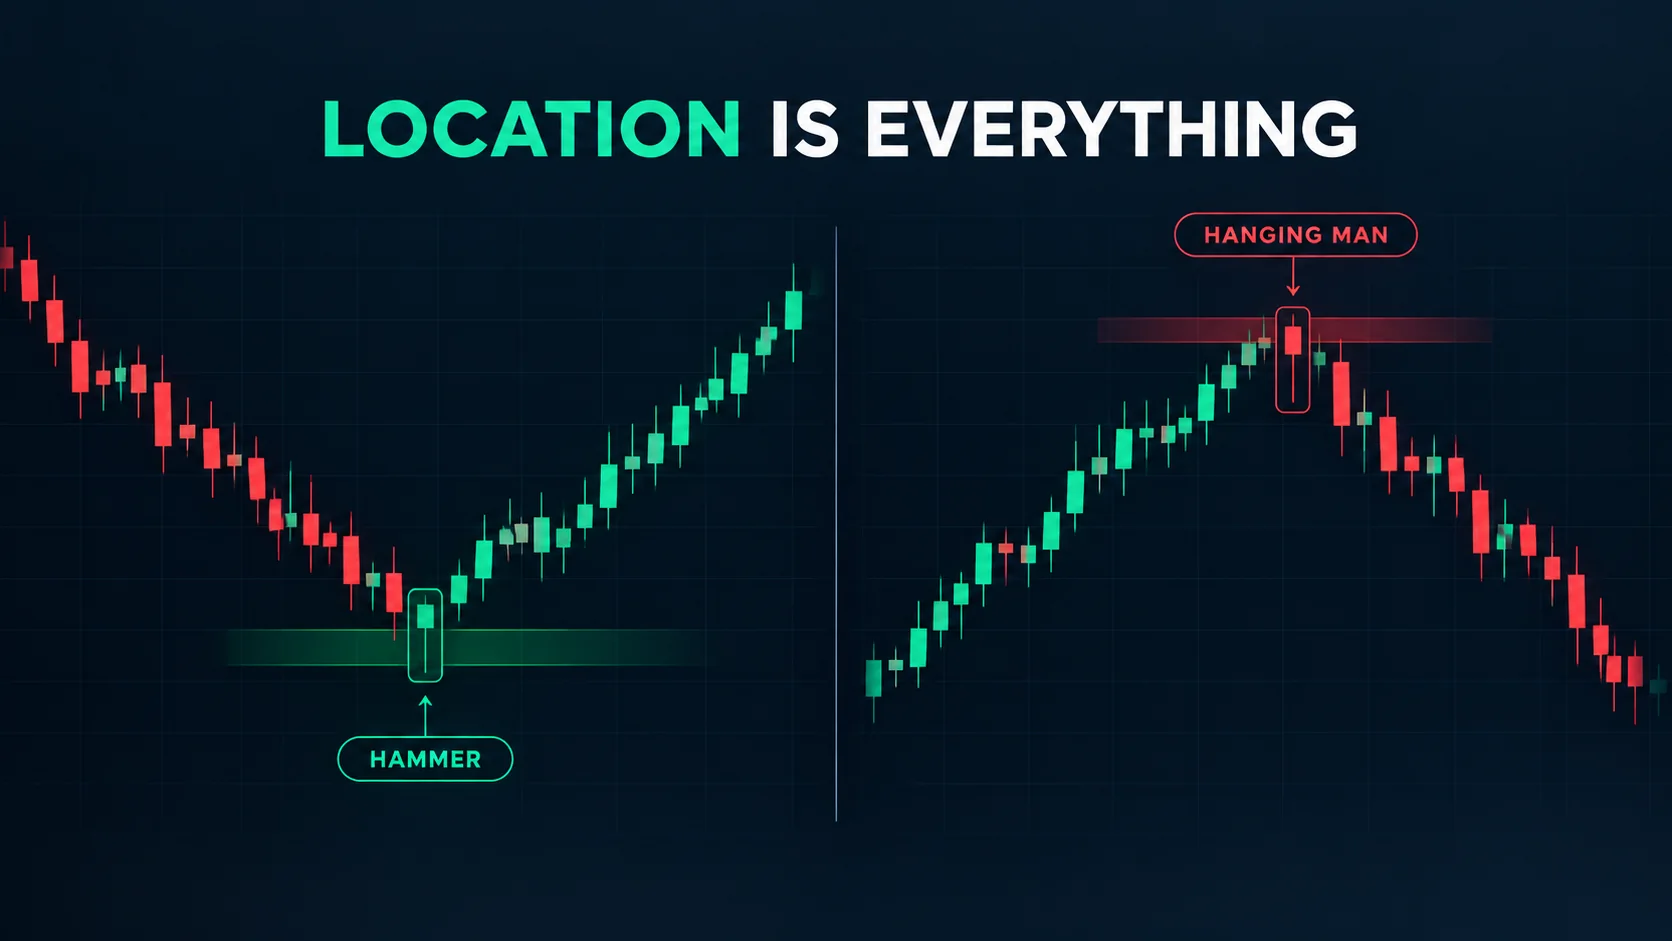
Draw a hammer candle on a chart. Small body near the top of the range. Almost no upper wick. A lower wick at least twice the size of the body. Now draw a hanging man candle on a different chart. Same body. Same ratio. Same wick. Put the two images side by side with the trend lines erased, and nobody can tell them apart — not a veteran technician, not a scanning tool, not Quantzee's own pattern engine. The candle is not two patterns. It is one candle wearing two different trend contexts.
That is not a rhetorical flourish. It is the entire mechanical truth of this pattern, and it is the reason most "hanging man candlestick" explainers online stay incomplete. They describe the shape correctly, then skip past the one variable that actually decides what the shape means: where it sits in the trend that came before it. This piece covers the identical-geometry demonstration directly. It gives you a numeric test for "after an advance" instead of a vague trend-line judgment call. It lays out what has to happen on the next bar before you treat a hanging man as a real bearish warning. And it closes with the general lesson this pattern teaches about every single-bar candlestick signal.
The identical-geometry demonstration, side by side
Strip away the surrounding candles and compare the two patterns on pure anatomy:
| Element | Hammer | Hanging man |
|---|---|---|
| Real body size | Small, near the top of the range | Small, near the top of the range |
| Lower wick | At least 2x the body | At least 2x the body |
| Upper wick | Negligible — under roughly 10% of total range | Negligible — under roughly 10% of total range |
| Body color | Either; color is not diagnostic | Either; color is not diagnostic |
| Prior trend | Decline into the candle | Advance into the candle |
Every row matches except the last one. According to the CMT Association's technical analysis curriculum, a candlestick's name comes from its position in the trend, not from any feature of the bar itself. That is why four of the five rows above are identical, yet the pattern still carries two different names and two opposite trade biases. Per the original Japanese rice-trading terminology the candlestick method comes from, the "hanging man" name is itself about context. It describes a body hanging precariously at a high after a run-up, like someone standing at the edge of a ledge. It says nothing about the candle's shape at all.
This is the part most retail explainers get backwards. They teach the shape first and the context second, so the shape seems to carry most of the signal and the trend reads like a footnote. Flip that order instead. The trend carries the signal. The shape only confirms that a reversal-style struggle happened on that one bar.
The time dimension matters here too. A hanging man that shows up after a 3-week advance and gets confirmed the next session is a different risk event than the same shape capping a 2-day pop. Treat duration as part of the pattern definition, not an afterthought to it.
A location test that decides the label without ambiguity
"After a decline" and "after an advance" sound precise until you try to apply them to a real chart full of noise. Here is a test setup you can run without guessing:
- Define the lookback. Look at the 10 bars immediately before the candle in question.
- Count swing structure. If at least 6 of those 10 bars form lower highs and lower lows, you are in a decline. A hammer read applies if the candle shows the anatomy above.
- Check the mirror. If at least 6 of those 10 bars form higher highs and higher lows, you are in an advance. A hanging man read applies instead, with the same anatomy.
- Handle the ambiguous middle. If the 10-bar count splits roughly 5-5 with no clear direction, the candle is sitting in chop. Neither label earns its usual weight until the surrounding structure clarifies.
This converts a subjective "it looks like an uptrend" call into a repeatable count. Run it the same way every time, on every chart, on any instrument. It will not match your eye on every borderline case — no 10-bar lookback will — but it removes the single biggest source of disagreement between two traders staring at the same chart: one person's "obvious uptrend" against another person's "it's basically flat."
What “after an advance” has to mean, numerically
Passing the swing-structure count above is necessary but not sufficient. A genuine hanging man setup needs the advance itself to be real, not a two-bar wiggle that happens to tick upward. Three numeric checks separate a meaningful advance from noise:
- Minimum move size. The advance into the candle should cover a distance at least 1.5 times the average true range of the preceding 14 bars. A smaller advance is statistically indistinguishable from random drift.
- Minimum duration. The advance should run at least 5 bars. A 2-bar pop that happens to end on a hanging-man-shaped candle is not "after an advance" in any meaningful sense. It is a spike.
- No major prior break. The advance should not already have broken a higher-high structure on fading momentum. If momentum was already weakening for 3 or more bars before the hanging man printed, the warning is weaker, because the reversal risk was already being priced in.
Put a number on all three and you get a usable, repeatable definition instead of "the chart was going up." In our experience applying this three-part check across intraday and daily charts, it filters out roughly a third of the candles that a loose, shape-only scan would flag as a hanging man. The ones that survive the filter are the ones actually sitting at the top of a real move — which is where the pattern's warning is supposed to apply in the first place.
Confirmation requirements for the bearish interpretation
A hanging man that passes the location test and the numeric advance check is still only a warning, not a trigger. The bearish read needs confirmation from the bar that follows, for the same reason a hammer needs it on the bullish side: the long lower wick only proves sellers showed up intrabar. It does not prove they stayed in control once the bar closed.
- Confirmation level. Mark the low of the hanging man's real body. The next bar's close needs to sit below that level.
- Volume check. Confirmation carries more weight when the next bar's volume comes in at 1.3x the 20-bar average or higher. A low-volume drift below the body low is weaker evidence than a volume-backed break.
- Invalidation. If the next bar closes back above the hanging man's high, the warning is cancelled. Do not keep holding a bearish bias once the market has already overridden it.
Our own review of candlestick reversal literature and the CMT curriculum both treat this the same way: a single bar, confirmed or not, should never be the entire basis for a position. Per the SEC's investor guidance on trading tools and alerts, automated software can flag that a condition occurred, but it is not a substitute for the trader's own risk decision. The hanging man earns its place as a caution flag that tightens stops and raises attention. It is not a standalone short signal on its own.
Paper-trade first. Every threshold in this piece needs to be run forward before you size a single real trade around it: the 10-bar lookback, the 1.5x ATR move minimum, the 5-bar duration, and the 1.3x volume confirmation. Run it on a paper account or in TradingView's replay mode, on your own instrument and timeframe, for at least 4 weeks before committing real capital. These are structural rules drawn from how the pattern is defined. They are not a guaranteed edge on any specific market, and your own data over your own months of history may shift the numbers that actually work for you.
Where the two names actually came from
Candlestick charting itself is centuries old, tracing back to Japanese rice markets, but the hammer and hanging man terminology most traders use today was popularized in the West far more recently. Steve Nison's book "Japanese Candlestick Charting Techniques," published in 1991, is widely credited with bringing this exact vocabulary — hammer, hanging man, doji, engulfing — into mainstream Western technical analysis. That matters for one reason: the two-name convention was never meant to describe two different candles. It was always meant to describe one candle shape, read through two different trend lenses, by a single author documenting a centuries-old method for a new audience.
That history is also a useful sanity check against a common misconception. The hammer and hanging man are not opposites because someone designed two separate tools for two separate jobs. They are opposites because the market context around an identical shape genuinely does flip its meaning — and a careful author, writing in 1991, chose two names precise enough to carry that flip without redefining the candle itself.
The general lesson about single-bar patterns and context
Here is the differentiated stance this piece has been building toward, and it generalizes well past the hanging man: a single candle, on its own, carries close to no standalone information. The hammer and hanging man pair is simply the cleanest possible proof of that, because it is the one case where identical geometry produces two different names depending entirely on what came before it. If relabeling the bar by its position in the trend flips the interpretation from bullish to bearish, the bar was never the signal. The trend, the location and the confirmation around it were doing all the work the entire time.
That stance applies just as directly to the inverted hammer, the shooting star, the doji, and most single-bar "reversal" patterns taught as standalone setups. Each one is a shape that means something only in combination with where it sits. Treat every single-bar pattern as a conditional statement — "if this trend context, then this read" — rather than as a shape with a fixed meaning. Most of the confusion around candlestick trading disappears once you make that switch.
How this fits into an actual trading process
In our experience building indicator logic at Quantzee, the hardest part of any multi-condition candlestick rule is not the candle definition. It is holding several bars of context in memory while a chart moves in real time: the swing count, the advance-size check, the confirmation bar, and the volume filter, all at once, without eyeballing any of them wrong under time pressure. That is a mechanical, rules-based check. It is exactly the kind of condition a confirmation-and-context layer like Quantzee's Adaptive AI Oscillation Engine is built to evaluate on every bar close, instead of leaving it to a quick glance at the chart.
Quantzee's indicators are analytical software, not investment advice. They surface conditions like "this candle just passed the location test and the confirmation bar closed below the body low," so you are not holding four separate checks in your head at once. The decision to act, the size, and the stop still belong to you. Pairing a candle-location read with a broader map of your support and resistance levels, and layering a second, independent signal from something like AI TrendPulse before you weight a hanging man heavily, follows the same multi-condition discipline covered in our guide on stacking indicators without stacking false signals. One candle agreeing with one trend count is weaker evidence than two independent reads agreeing with each other.
None of this removes the need for the next bar's confirmation. A location test and a numeric advance check tell you the hanging man is sitting somewhere meaningful. They do not tell you the market has actually turned. That is still the next bar's job, every time, on every timeframe, over every one of the three to five sessions it typically takes a genuine reversal to prove itself out.
Build the habit of running these checks in a fixed order: location test, advance-size check, confirmation bar, then volume. Skipping straight to "does this look like a hanging man" and acting on the shape alone is how a caution flag gets mistaken for a trade signal, on any instrument, on any timeframe, in any market condition.
Frequently Asked Questions
A hanging man does not warn you because of its shape. It warns you because that exact shape showed up at the top of a real advance, after a real run, with a real bar afterward confirming sellers took control. Take any one of those three conditions away and you are left with a candle that merely looks dramatic. That is precisely why the identical geometry sitting at the bottom of a decline gets called something else entirely — and why Quantzee treats location and confirmation as the actual signal, not the bar.