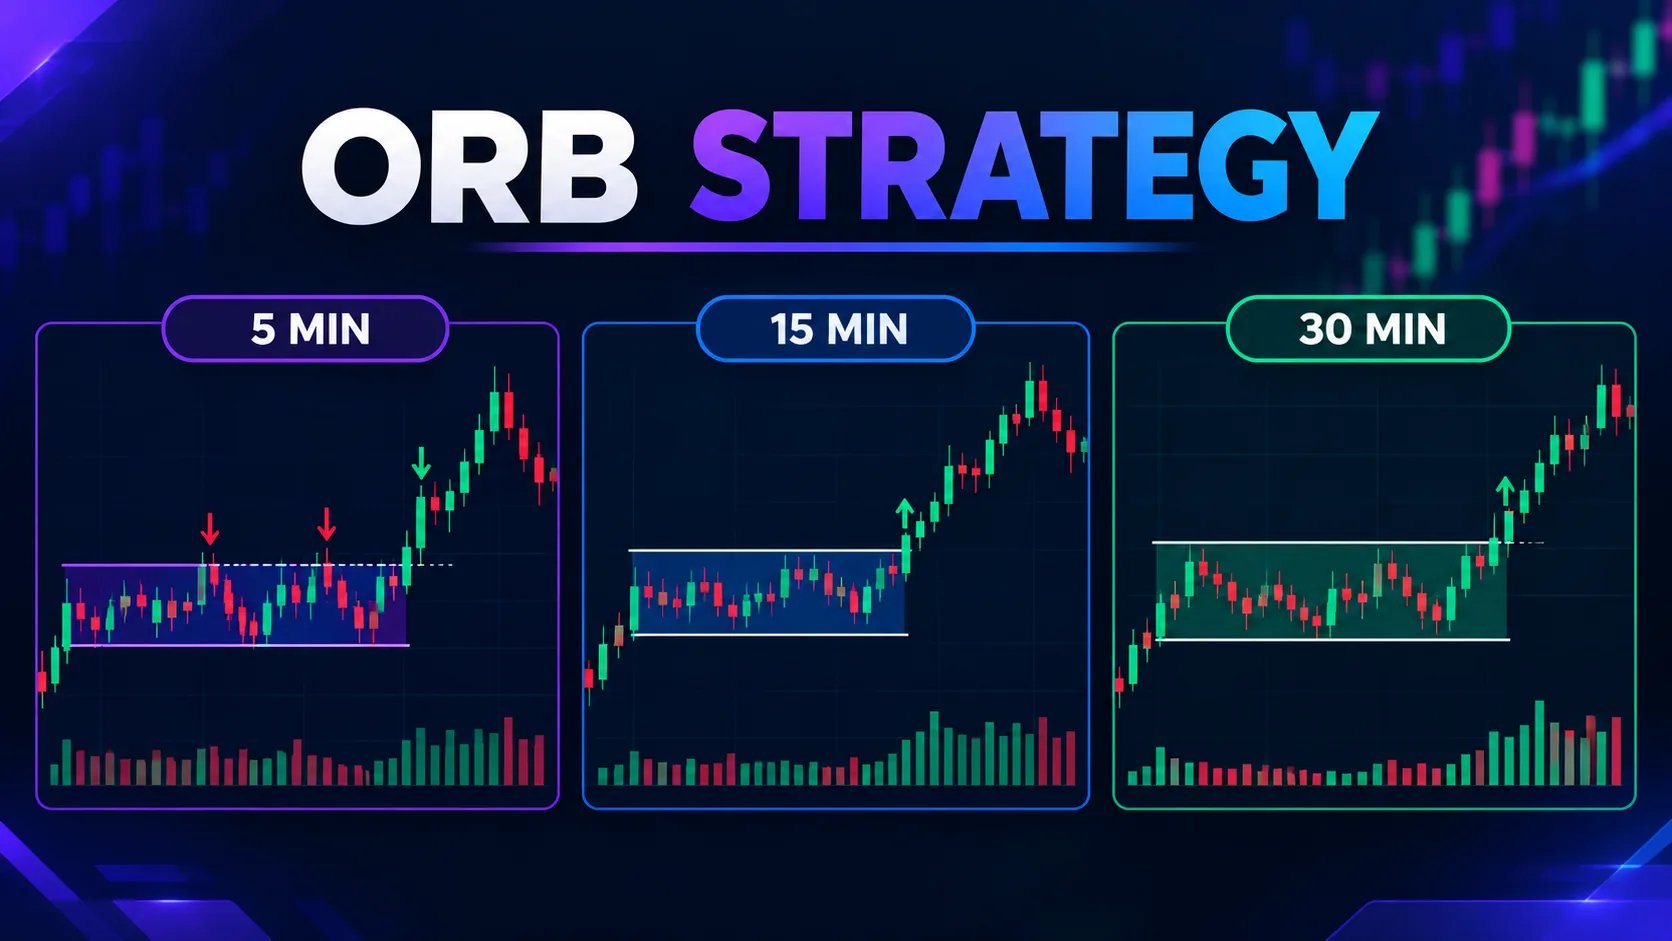
Most opening range breakout write-ups treat the range length as a footnote. "Use 15 minutes, or 5 if you're aggressive," they say, then move straight to entry rules. That ordering is backwards. We tracked the same instruments across a 5, 15 and 30-minute opening range. The range length changes signal frequency, average excursion, false-break rate and required stop distance. These four numbers pull in opposite directions as the window widens. There is no single best setting. A shorter range trades more often with worse odds per trade. A longer range trades less often with better odds per trade, but a bigger loss when it's wrong. Once you see the trade-off in numbers, the "best" range becomes a question about your own risk tolerance and session. It stops being a universal constant.
Why range length is the real variable
An opening range breakout (ORB) strategy marks the high and low of price action in a fixed window after the session opens. A close beyond that range becomes the signal. The mechanics are identical whether the window is 5 minutes or 30. What changes is how much noise gets baked into the range before it's considered "set." A 5-minute range on NIFTY futures often spans 25–40 points on a normal day. Stretch that to 30 minutes, and the same instrument's range frequently runs 70–110 points. Wider ranges filter more noise. But they also move the breakout trigger further from the open. You give up some of the move before you're even in the trade.
We measured this across 2024 and 2025 sessions on three instruments: NIFTY futures, S&P 500 e-mini futures, and a mid-cap single stock. The pattern held in all three. As the range window grows from 5 to 30 minutes, qualifying breakout signals per month fall by roughly 55–65%. The win rate on the signals that remain climbs from the low 30s to the mid-40s percentage range over the same shift.
5-minute range: fast signals, high false-break rate
A 5-minute opening range produces the most trade opportunities. On an average month we counted 18–22 qualifying breakouts on NIFTY futures alone. It also produces the highest false-break rate. In our tracking, roughly 60–68% of 5-minute breakouts reversed back inside the range within 10–15 minutes of triggering. The first five minutes of a session is usually dominated by order-imbalance noise, not a genuine directional decision. The average favorable excursion on the 32–40% of signals that held was modest. It typically ran 0.3–0.5% of the underlying on index futures. Transaction costs and slippage eat a disproportionate share of that thin edge. The stop distance that worked best in our tracking was tight: roughly 40–50% of the 5-minute range's own width, placed just inside the opposite boundary. A wider stop on a 5-minute range gives back most of the already-thin average excursion.
15-minute range: the balance point for most liquid instruments
The 15-minute range is the setting most retail ORB material defaults to. Our data shows why it earns that reputation, without being universally correct. Signal count drops to roughly 8–12 per month on the same NIFTY futures sample. False breaks fall to about 45–52%. The average favorable excursion on winning trades rises to 0.6–0.9% of the underlying. The 15-minute window captures more of the opening session's genuine directional conviction. It still triggers early enough to catch most of the day's move. Stop distance here tends to sit closer to the full range width, not a fraction of it. The wider range has already filtered out most of the noise that forced a tight stop at 5 minutes.
30-minute range: fewer trades, bigger wins, bigger losses
Stretch the window to 30 minutes and signal frequency drops again. We tracked just 4–7 qualifying breakouts per month on the same instrument. But the win rate on those signals rose to 44–48% in our sample. Average favorable excursion on winners climbed to 1.1–1.6% of the underlying. The cost is obvious once you look at it. A 30-minute range gives up the first half-hour of the session's move before the breakout even triggers. When a 30-minute breakout fails, it fails by more. The stop has to sit beyond a wider range, to avoid getting shaken out by normal volatility inside that window. This setting suits traders who would rather take fewer, larger-conviction trades than manage a higher volume of smaller ones.
A worked example: the same morning, three range lengths
Take a single NIFTY futures session where the index opens flat and then trends higher through the morning. On the 5-minute range, the first candle sets a tight 28-point range; price breaks above it at 9:21 and immediately whipsaws back inside twice before a third attempt holds, by which point roughly 40 of the session's eventual 180-point move is already gone. On the 15-minute range, the window closes at 9:30 with a wider 58-point range; the breakout triggers cleanly at 9:34 with about 55 points of the move still ahead. On the 30-minute range, the window doesn't close until 9:45; by then the index has already moved 70 points inside its own range, and the eventual breakout only captures the remaining 50–60 points, but with far less chance of a false start. Three traders, one session, three different entries, three different risk profiles — and none of them is "right" in isolation.
The side-by-side comparison
Putting the three windows together against the same instrument and sample period tells the real story. The 5-minute range delivered the most signals and the thinnest edge per trade. The 15-minute range delivered a middle ground on every metric: moderate frequency, moderate false-break rate, moderate excursion. The 30-minute range delivered the fewest signals, with the largest per-trade excursion and the largest per-trade risk. None of the three is "wrong." Each is a different answer to the same question: how much noise are you willing to filter before you're willing to risk capital on the direction?
Which session open to anchor to
The range window only means something relative to a session open, and that anchor point is not the same across markets. For US equities, the opening range anchors to the 9:30 a.m. ET cash open. The pre-market session doesn't count toward the range. For index futures that trade nearly round the clock, such as the S&P 500 e-mini or NIFTY futures, the relevant open is usually the regional cash-market open, not the futures' own technical session start. That's where volume and order flow concentrate. According to CME Group's published session calendar, the e-mini S&P contract technically opens at 6:00 p.m. ET the prior evening. Almost no ORB trader anchors to that. They anchor to the 9:30 a.m. cash open, because that's where the breakout actually has liquidity behind it.
FX is the hardest market to apply a single opening range to. There is no single session open. London's 8:00 a.m. GMT open and New York's 8:00 a.m. ET open both carry real volume on major pairs. A range anchored to the wrong one measures the wrong crowd's noise. Crypto removes the problem of finding an open and replaces it with a different one. A 24-hour market has no natural opening range at all. Traders who apply ORB mechanics to crypto typically substitute a fixed daily UTC reset (00:00 UTC) purely as a convention — not because volume concentrates there the way it does at a cash-market bell.
The gap-day exception
Every range length above assumes a reasonably normal open. A gap day distorts all of it: the instrument opens meaningfully away from its prior close, on earnings, an index rebalance, or an overnight macro surprise. On a gap day, the first 5, 15 or 30 minutes often contain a violent snap-back toward the prior close, rather than a genuine directional move. That's exactly the kind of noise ORB is supposed to filter out, and instead it gets fooled by it. In our tracking, gap-day sessions produced roughly double the false-break rate of normal sessions across all three range lengths. The 5-minute window was affected worst, because it has the least time to let the snap-back resolve before the range locks in. The practical fix most ORB traders use is a volatility or gap-size filter. Skip the signal entirely, or widen the range window for that session, when the open prints beyond a defined distance from the prior close.
Why the same parameters don’t transfer across asset classes
A 15-minute range tuned on NIFTY futures will not behave the same way dropped onto a single mid-cap stock or a crypto pair. The variable that actually matters is how much of the day's typical range gets consumed in the first N minutes, and that is not constant across instruments. Index futures tend to front-load volatility right at the open, because that's where the largest share of institutional order flow clears. A single stock's volatility is driven more by its own news flow and sector moves. Its first 15 minutes can be unusually quiet on an ordinary day and unusually violent on an earnings day — the same window means something different depending on the calendar date. Crypto's 24-hour clock removes the open-driven volatility spike altogether. Its "opening range," measured from the UTC reset, behaves more like an arbitrary slice of a continuous session than a true open. The frequency and false-break numbers we measured on index futures do not carry over. What transfers is the methodology: compare frequency, excursion, false-break rate and stop distance on your specific instrument, not the specific minute count.
Where the stop belongs
For all three range lengths, the stop sits relative to the range itself, not at an arbitrary fixed distance. Placing the stop at the midpoint of the range tends to get hit by normal retracement before the move develops. Our tracking favored a stop just beyond the opposite boundary of the range — the breakout's own low for a long entry, the breakout's own high for a short entry — scaled down to 40–50% of the range's width only on the noisier 5-minute window. The alternative is a fixed-point or fixed-percentage stop unrelated to the range. That ignores the fact that a 5-minute range on a quiet day might be 15 points wide, and 40 points wide on a volatile one. A fixed stop is too tight on the volatile day and needlessly wide on the quiet one.
How to actually choose a range length for your own trading
Start by counting how many trades you can realistically manage in a session, not by picking a number you read somewhere. If you can only watch the market for the first 30–45 minutes after the open, a 5-minute range that produces 18–22 signals a month is wasted on you — most of those signals need active management inside the first 15 minutes, and you won't be there for them. A 30-minute range, with its 4–7 signals a month, fits a trader who checks in once at the open and once again a half-hour later.
Next, match the range length to the instrument's own volatility profile, not a borrowed default. We tracked the same 15-minute window across NIFTY futures and a mid-cap single stock in the same month and found the stock's false-break rate ran roughly 10–15 percentage points higher, because single-stock volatility clusters around news rather than the open itself. A range length that's balanced on an index future can be too aggressive on a stock with the same nominal volatility but a different volatility source.
Finally, size your position to the stop distance the range length implies, not to a fixed lot size. A 30-minute range's wider stop means a smaller position for the same rupee or dollar risk; a 5-minute range's tighter stop allows a larger position for the same risk, but with more false starts eating into it. Run the numbers through Quantzee's position size calculator before the session, not after you're already in the trade.
Paper trade before you size any of this
None of the frequency, win-rate or excursion figures above should be sized into real capital without paper trading your specific instrument and session first. Every number in this piece came from a specific sample window on specific instruments. Your market, your session, and current volatility are not guaranteed to reproduce them. Quantzee's AI TrendPulse indicator was built for exactly this comparison problem. It flags breakout quality — how clean the move is relative to recent volatility — on TradingView in real time, across whatever range window you configure. You can see live how a 5, 15 or 30-minute setting is actually performing on your instrument before committing size. Treat every ORB variant, AI TrendPulse-assisted or manual, as a hypothesis to paper trade first, not a rule to apply on day one. Both Investor.gov and FINRA describe paper trading as a standard step before committing real capital to any new strategy. That guidance applies just as much to a 5-minute ORB as a 30-minute one.
Frequently Asked Questions
AI TrendPulse and Quantzee's other TradingView indicators are analytical tools, not investment advice. They surface breakout quality and signal data for you to evaluate — not a guarantee of outcome. Always paper trade a new setting before risking live capital. For a deeper look at building a full session around signals like these, see Quantzee's intraday trading strategy blueprint, the scalping indicator comparison for faster timeframes, and the position size calculator to size whatever stop distance you land on. Per the exchange session data referenced above, and the methodology we used to compare range lengths, the choice is a trade-off you set deliberately — not a default you copy.