Scalping on TradingView sounds simple in theory — get in fast, get out faster, repeat. In practice, most traders discover the hard way that the wrong indicator turns 1-minute and 5-minute charts into an expensive noise machine. This guide exists to fix that.
What follows is a comprehensive, no-hype breakdown of exactly which TradingView indicators are genuinely useful for scalping in 2026, why most popular choices quietly underperform on fast timeframes, how to build a three-layer indicator stack that filters noise without adding lag, and which newer AI-powered tools have changed the bar for what a scalping indicator should do.
Whether you trade crypto, forex, equities, or indices, the principles here transfer directly. Every indicator reviewed below has been assessed against the four criteria that actually matter for scalping — none of which are “it has a lot of settings” or “it has a nice dashboard.”
Disclaimer: This article is for educational and informational purposes only. Quantzee’s indicators are analytical software tools, not financial advice. Past signal performance on historical charts does not guarantee future results. Always apply your own risk management and do your own research before making any trading decision.
What Is Scalping? (And What Makes It Different From Day Trading)
Scalping is the practice of making a large number of short-duration trades — typically holding positions for seconds to a few minutes — to capture small price moves repeatedly. A scalper on a 1-minute chart might take five to twenty trades in a single session, targeting two to ten pips (forex), a few cents (equities), or 0.1–0.5 percent (crypto) per trade.
This is fundamentally different from day trading in two ways that matter for indicator selection:
Speed of signal delivery. A day trader using the 15-minute chart has time to observe, confirm, and enter. A scalper on the 1-minute chart needs a signal that arrives and resolves fast enough to still have a usable entry point when it does. Indicators with heavy smoothing or long lookback periods fail this test — the signal arrives after the move is already underway.
Signal-to-noise ratio. Lower timeframes carry proportionally more random price variation. An RSI divergence on a daily chart is a meaningful structure signal. The same RSI on a 1-minute chart fires dozens of times per session — most of them noise. Any indicator you use for scalping must have either a built-in filter for this noise or be paired with one that does.
The practical implication: indicators that work well for swing trading or position trading often perform poorly for scalping, not because they are bad indicators, but because they were not designed to function at this speed. The reverse is also true — tools built for scalping can be misleading on higher timeframes.
Why Most Popular Indicators Fail on 1-Minute Charts
Before naming what works, it is worth being direct about what does not — because most “best scalping indicators” articles recommend the same standard toolkit without acknowledging its limitations.
Lagging Moving Averages
The EMA and SMA are the most-cited scalping tools on TradingView, and for good reason on higher timeframes — they define trend direction clearly. On 1-minute and 5-minute charts, however, even a fast EMA-9 lags enough to position you one or two bars late on every signal. In a market that moves 10 pips in 30 seconds, being one bar late can mean the entire move has already occurred before your signal fires.
This does not make EMAs useless for scalping. Used as a trend filter (not a signal), an EMA-9/EMA-21 cross still tells you whether you should be looking for longs or shorts. The error is using it as the primary entry signal.
Standard RSI at Default Settings
RSI at period 14 was designed with daily and weekly charts in mind. On a 1-minute chart, the 14-bar lookback covers 14 minutes — often crossing several micro-trends. The result is an RSI that reads “oversold” while the actual micro-trend is still firmly down, and “overbought” for three bars in a row during a strong up-move. The classic divergence approach adds even more lag: by the time a confirmed divergence appears, the setup it was supposed to signal is often resolved.
The fix is not to abandon RSI entirely — it is to use it differently. A shorter-period RSI (6–9) with adaptive overbought/oversold levels reacts more appropriately to fast charts. More on this in the indicator reviews below.
Oscillators in Trending Markets
MACD, Stochastic, and similar oscillators are mean-reversion tools by design — they measure deviation from an average and signal when price is “too far” from equilibrium. In a trending market (which scalpers must trade with, not against), oscillators will be persistently “overbought” or “oversold” the entire time the trend runs. Experienced scalpers either disable oscillators in confirmed trends, use them only as trend strength gauges rather than entry signals, or apply a trend filter that gates oscillator signals.
Repainting Indicators
This one is non-negotiable. Any indicator that repaints — that is, any indicator whose signals change or disappear on historical bars — is unsuitable for live scalping regardless of how good the backtested results look. On a 1-minute chart the entry window can be thirty to sixty seconds. If an indicator fires a signal that disappears by the next bar, you have entered a trade based on information that is no longer valid.
A surprising number of popular TradingView scripts repaint. The test is straightforward: use TradingView’s Bar Replay function to step through a chart bar by bar. If a signal appears on bar N and then disappears when bar N+1 forms, the indicator repaints. TradingView’s own documentation on repainting covers the common causes in detail.
What Makes a Good Scalping Indicator? The Four-Point Test
After stripping out the noise, four criteria separate genuinely useful scalping indicators from the ones that look good in screenshots.
1. Minimal lag at confirmation. The signal fires on a completed bar close, not several bars after the fact. The key word is “confirmation” — a signal that appears live on an unfinished bar and might change is worse than a slightly later-arriving signal on a closed bar.
2. Non-repainting signals. Covered above. This is a pass/fail criterion, not a preference. If the indicator repaints, disqualify it regardless of other qualities.
3. Built-in noise filtering. Either the indicator itself filters the micro-noise of lower timeframes (through confluence requirements, adaptive parameters, or multi-factor logic), or it is designed to pair cleanly with a separate filter. An indicator that fires every five bars on a 1-minute chart is producing too much noise to be usable.
4. Works in live conditions, not just backtests. Past signal placement on a chart looks perfect because the indicator’s algorithm already knows what happened. The real test is how the indicator behaves on new bars as they form. Non-repainting indicators tested with Bar Replay in unfavorable periods (choppy, low-volume) give a more honest picture than any performance statistic printed on the vendor’s website.
The Best Scalping Indicators on TradingView in 2026
What follows is a comprehensive review of the indicators actually used by active scalpers across asset classes. Where relevant, specific parameter settings for scalping timeframes are noted.
1. SuperTrend (Built-in + Enhanced Versions)
SuperTrend is the most widely used trend-following indicator for scalping on TradingView, and for good reason — the core logic is sound for fast timeframes.
The basic SuperTrend uses an ATR (Average True Range) multiplier to place a band above or below price. When price crosses the band, the trend flips and a signal fires. The signal is non-repainting by construction (once a bar closes and the band flips, the historical state does not change), the signal is simple (one bar = one direction), and it adapts to volatility via the ATR calculation.
Where standard SuperTrend falls short for scalping: In ranging or choppy markets, the ATR multiplier (typically 3.0 at default) is too aggressive, causing the indicator to flip direction repeatedly on small price swings. Each flip fires a signal. The result on a low-volatility 1-minute chart can be ten or fifteen false signals before a real trend establishes.
Scalping settings: Lower the ATR multiplier to 1.5–2.5 for 1-minute and 5-minute charts (instead of the default 3.0). Reduce ATR period to 7–10 (instead of 14). This makes the indicator more responsive while retaining its non-repainting property.
The dual-confluence upgrade: The limitation of single-SuperTrend scalping is why many experienced TradingView users upgrade to a dual-SuperTrend approach — requiring both a fast SuperTrend (ATR 10, factor 2) and a slow SuperTrend (ATR 20, factor 4) to agree before a signal fires. This single addition filters out the majority of false flips in choppy conditions. The shaded zone between the two SuperTrends gives a visual “confluence zone” where the signal strength is highest.
2. RSI with Adaptive Bands (Enhanced RSI)
Vanilla RSI is not an ideal scalping tool at default settings. An enhanced RSI configured for fast timeframes is one of the most useful confirmation tools a scalper can add.
For scalping, adjust the following:
- Period: 6–9 (not the standard 14)
- Overbought level: 75–80 (not 70) — reduces false overbought readings in trends
- Oversold level: 20–25 (not 30)
At these settings, RSI on a 1-minute chart becomes a genuine momentum gauge rather than a noise generator. Signals become actionable: a reading below 20–25 in a rangebound market is a real exhaustion signal, not the default “oversold” tag that fires every few minutes.
Adaptive bands take this further. Instead of fixed overbought/oversold levels, adaptive RSI bands compute the levels as rolling percentiles of RSI’s own recent distribution. In a strong uptrend, the overbought band automatically rises — reducing the false “overbought” readings that appear throughout a sustained move. In a downtrend, the oversold band falls. This regime-awareness is the single most important RSI upgrade for scalping.
Best use for scalping: Use as a confirmation tool, not a primary signal. Do not enter shorts just because RSI is overbought. Enter when RSI exits overbought conditions (the momentum collapse) AND your trend filter (SuperTrend or similar) agrees with the direction.
3. VWAP (Volume Weighted Average Price)
VWAP is the intraday benchmark used by institutional traders to evaluate trade quality. For retail scalpers on TradingView, it serves as a powerful bias filter.
The core principle: price above VWAP = intraday bullish bias. Price below VWAP = intraday bearish bias. Scalpers use this to gate their signals — only taking longs when price is above VWAP and only taking shorts below.
VWAP works best as a filter, not a signal generator. Many traders misuse VWAP as an entry trigger (buy when price crosses VWAP). This leads to repeated losses at the cross point, which is an area of indecision, not direction. The productive use is as a bias filter for signals from your primary entry indicator.
Standard deviations as S/R: The VWAP + 1 standard deviation and VWAP − 1 standard deviation bands serve as the first areas where reversals become likely in ranging markets. Scalpers taking counter-trend trades near these levels have structurally higher-probability setups.
Session anchoring matters: A session-anchored VWAP (reset at market open or at a specific session start) is more meaningful than a continuously rolling VWAP for intraday scalpers. TradingView’s built-in VWAP supports session anchoring.
4. Bollinger Bands
Bollinger Bands measure volatility through a 20-period moving average plus/minus two standard deviations. For scalpers, they serve two useful functions.
Squeeze detection. When the bands contract sharply (a “squeeze”), volatility has compressed and a breakout is imminent. Scalpers who enter on the first directional bar after a squeeze are positioning before the move rather than chasing it. The Squeeze Momentum Indicator (a TradingView community script) formalizes this squeeze detection into a histogram.
Mean-reversion setups. In range-bound markets, price touching the upper band with an overbought RSI reading is a statistically meaningful short setup — and vice versa at the lower band. These setups are less reliable in trending markets (price will walk the band during a strong move), which is why a trend filter gating mean-reversion signals is essential.
Settings for scalping: Reduce the period to 14–16 (from default 20) to increase responsiveness. Keep the standard deviation multiplier at 2.0 for the outer bands; some scalpers add a 1.0 std dev inner band for tighter setups.
5. EMA Ribbon (Used as a Filter, Not a Signal)
An EMA ribbon — typically 5, 8, 13, 21, 34 EMA stacked — is more useful for scalping than any single EMA because it gives a visual read on both trend direction and momentum.
When the ribbon is stacked and fanning outward (fast EMAs well above slow EMAs in an uptrend), the trend is strong and momentum is healthy — scalpers should be long-biased. When the ribbon is tangled (fast and slow EMAs crossing repeatedly), the market is in a range — scalpers should reduce position size or wait for the ribbon to re-stack.
Entry rule: Do not use EMA ribbon crossovers as entries on 1-minute charts (too laggy). Use the ribbon’s alignment state as a trend filter for your primary signal indicator.
6. Volume Profile
Volume Profile shows where the most volume has traded at each price level over a selected period. For scalpers, this creates a structural map of the session.
Point of Control (POC): The price level with the highest traded volume. Price tends to magnetize toward the POC when it is nearby. Scalpers avoid trading against the POC pull and look for setups that trade toward it or bounce from it.
High-Volume Nodes (HVN): Price areas with heavy prior volume that act as support/resistance. Value Area High and Value Area Low (the range containing approximately 70 percent of volume) are the primary S/R levels scalpers watch.
Practical limitation on TradingView: Full Volume Profile (VPVR — Visible Range) requires a Premium or higher TradingView plan. The fixed-range variant is available on lower plans. For scalpers without Premium access, the Keltner Channel or standard pivot points provide a reasonable S/R approximation.
7. ATR (Average True Range) as Position Sizing and Stop Tool
ATR is not a signal indicator — it tells you nothing about direction. Its scalping utility is as a mechanical stop-loss and take-profit calculator.
Standard scalping use: Set your stop-loss at 1.0–1.5x ATR from entry. Set your first take-profit at 1.0x ATR, second at 2.0x ATR. This keeps your risk defined by the actual volatility of the instrument and timeframe, not by arbitrary pip counts.
Why this matters for scalping: Scalpers who use fixed pip stops find themselves repeatedly stopped out by normal spread and microstructure noise. ATR-based stops automatically contract in low-volatility periods (reducing over-stopping) and expand in volatile periods (avoiding premature exits).
Indicator Comparison Table: Best Scalping Indicators for TradingView
| Indicator | Type | Best Timeframe | Repaints? | Best Use | Limitation |
|---|---|---|---|---|---|
| SuperTrend (dual) | Trend | 1m – 15m | No | Primary signal | Whipsaw in ranges |
| RSI (adaptive) | Momentum | 1m – 5m | No | Confirmation | Not for trending entries alone |
| VWAP | Bias / Anchor | 1m – 15m | No | Session bias filter | Resets at session open |
| Bollinger Bands | Volatility | 5m – 15m | No | Squeeze + mean reversion | Unreliable in strong trends |
| EMA Ribbon | Trend | 5m – 15m | No | Trend filter (not signal) | Lags on 1m entries |
| Volume Profile | Structure | Any | No | S/R zones, POC | Requires Premium plan |
| ATR | Volatility | Any | No | Stop/TP sizing | No directional signal |
The Scalping Stack: How to Combine Indicators Without Overcomplicating
Every experienced scalper eventually discovers that three indicators doing three different jobs beats seven indicators doing overlapping jobs. The noise from correlated indicators compounds rather than cancels.
The optimal scalping stack has three layers:
Layer 1 — Trend/Bias Filter. Tells you which direction to trade. Options: SuperTrend (dual), EMA Ribbon, VWAP bias. You should only be taking signals in the direction your bias filter confirms.
Layer 2 — Primary Signal. Tells you when to enter within the direction. Options: SuperTrend confluence signal, RSI exit from adaptive band, Bollinger Band squeeze breakout. The signal should fire infrequently enough to be actionable.
Layer 3 — Confirmation. A second check before entry. Options: Volume spike confirming the signal bar, RSI agreeing with direction, ATR confirming expanded volatility (suggesting a real move, not noise).
The rule: Only enter when all three layers align. If your trend filter says long, your primary signal fires a long, and your confirmation agrees — that is a tradeable setup. Two out of three is not enough.
What to remove: Anything that does not occupy one of these three distinct roles is noise on your chart. A fourth indicator of any type is almost always making your chart harder to read, not easier.
AI-Powered Scalping Indicators: The Next Step
The indicators reviewed above form the analytical foundation every serious scalper needs to understand. They are time-tested, well-documented, and available on TradingView in standard or community versions.
The limitation of standard indicators is that their parameters are static. SuperTrend at factor 2, ATR 10 works well in one volatility regime and poorly in another. RSI at period 7 is right for one market phase and wrong for another. Most traders adjust settings manually — which means either adjusting too slowly (using yesterday’s parameters today) or adjusting too frequently (chasing performance).
This is the problem that AI-adaptive indicators are designed to solve. Rather than fixed parameters that you manually tune, adaptive indicators self-optimize against current market conditions. For scalping, where volatility regimes can shift within a single session, the ability to adapt automatically is a genuine advantage.
SuperTrend Pro+ — Dual-Confluence Scalping with Auto ATR Ladder
SuperTrend Pro+ is Quantzee’s enhanced SuperTrend built specifically for the limitations that make standard single SuperTrend unreliable for scalping.
The core upgrade — dual-SuperTrend confluence: Instead of a single SuperTrend flipping on every volatility spike, Pro+ runs two SuperTrends simultaneously — a fast one (default ATR 10, factor 2) and a slow one (default ATR 20, factor 4). A signal fires only on the bar where both first agree on direction. The shaded confluence zone between them is visible at all times.
On a 1-minute chart, this single change eliminates the majority of false signals that plague standard single SuperTrend scalping. The ranging market chop that causes single SuperTrend to flip every few bars does not generate a dual-confluence signal — it simply shows no shading and no signal.
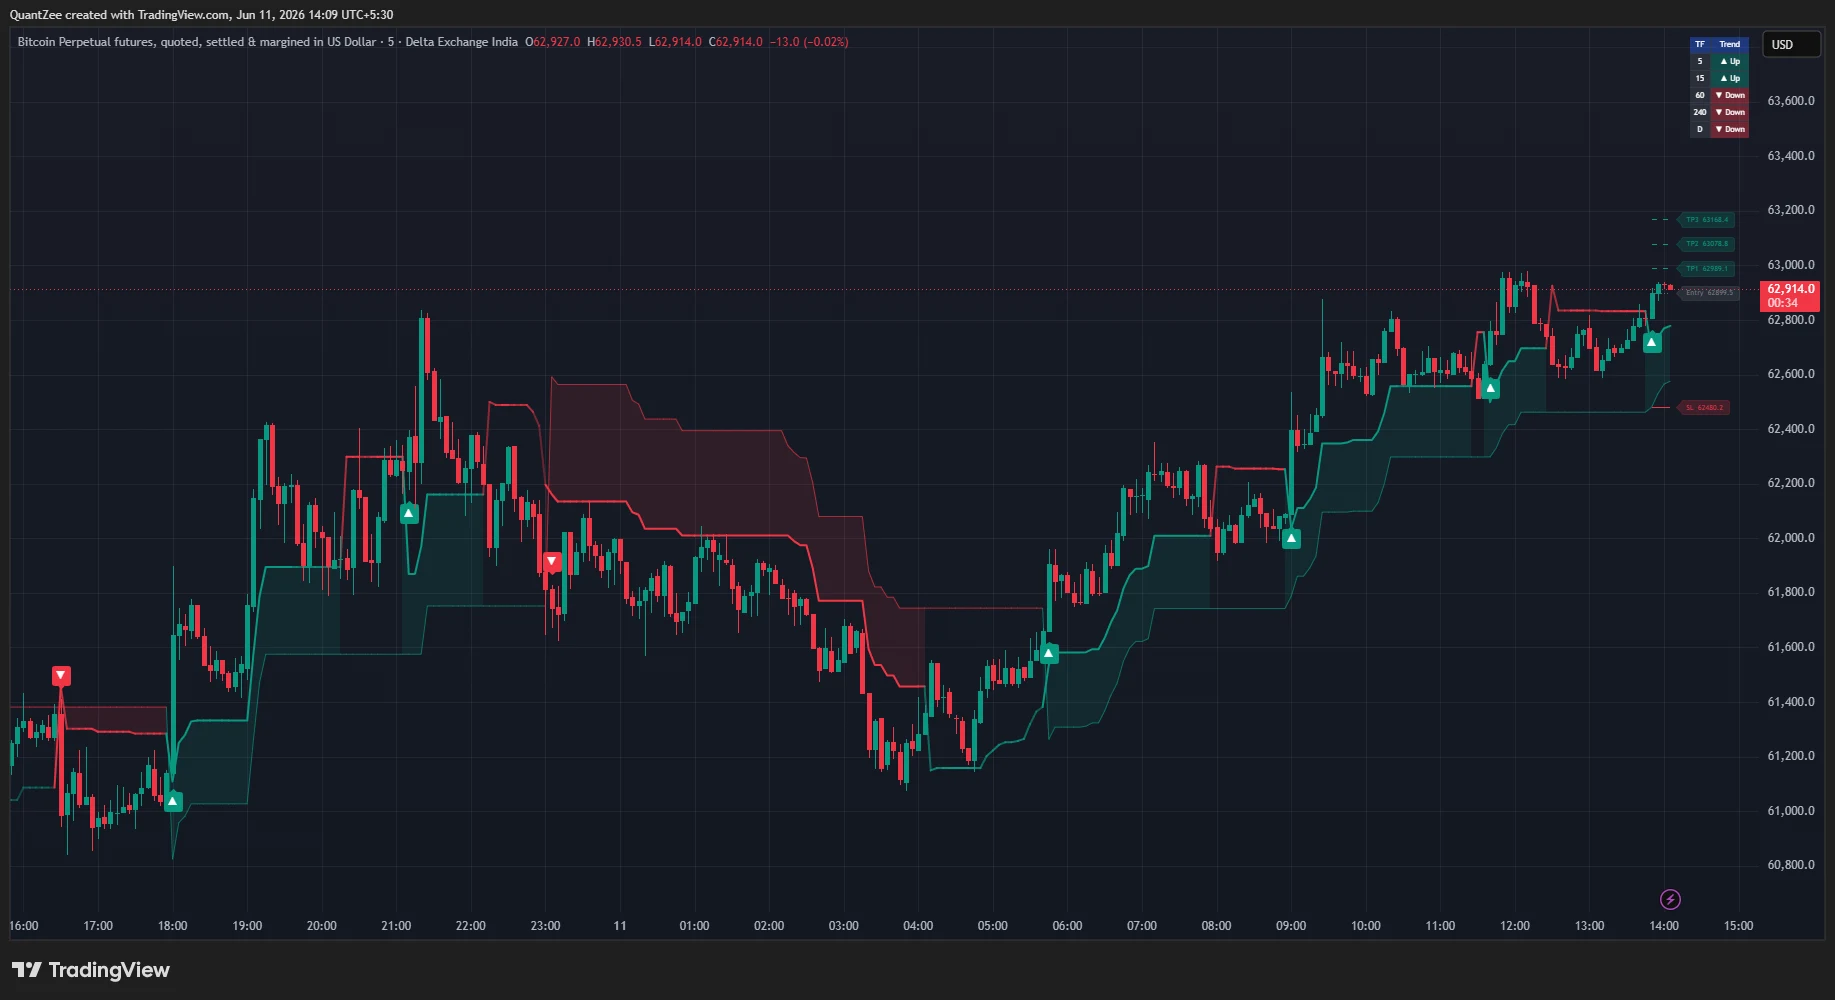
The ATR trade-level ladder: On every confirmed dual-confluence signal, Pro+ automatically plots the entry price, TP1 (1× ATR), TP2 (2× ATR), TP3 (3× ATR), and a stop-loss at the slow SuperTrend line. For a scalper, this is a complete, objective trade plan on every signal. No manual calculation, no guessing at levels — the ladder updates automatically with each new signal.
The trend-strength gradient: The fast SuperTrend line changes opacity based on the normalized distance between price and the slow SuperTrend. A solid, bright line = strong trend momentum. A fading line = trend losing energy before any flip occurs. For scalpers managing positions in real time, this early warning of trend deceleration is the cue to tighten stops or scale out ahead of the flip.
Multi-timeframe trend dashboard: A compact table shows the slow SuperTrend direction across five user-selectable timeframes in a corner of the chart. A scalper on the 1-minute chart can instantly see whether the 5m, 15m, 1H, 4H, and Daily are aligned or conflicting. This is the bias filter built directly into the indicator.
Non-repainting: Confluence signals evaluate on the chart timeframe and the ATR ladder draws only on confirmed bar closes. Multi-timeframe data uses lookahead=off. Historical signals stay exactly where they fired.
For scalping specifically: Pro+ replaces your trend filter (Layer 1) and primary signal (Layer 2) in a single indicator, leaving your chart’s third slot free for a volume or momentum confirmation. This is a meaningful simplification for scalpers who need to process information quickly.
Available at quantzee.com/indicators/supertrend-pro/ — included in the full Quantzee subscription at $9.99/month.
RSI Pro+ — Adaptive Divergence Engine for Scalping Setups
RSI Pro+ solves the two core problems with standard RSI for scalping: fixed overbought/oversold levels that are wrong in trending markets, and the lack of automatic divergence detection.
Adaptive OB/OS Bands: RSI Pro+‘s overbought and oversold levels are computed as rolling percentiles of RSI’s own distribution over the past 200 bars (default 90th and 10th percentile). In a persistent uptrend, the overbought band rises automatically — RSI stays below it through the trend, only triggering when the market genuinely hits exhaustion. In choppy markets, the bands narrow — keeping the signal active. A static RSI at 70/30 gives you false signals in both conditions. The adaptive version adjusts.
Automatic divergence engine: Detecting RSI divergences manually on fast charts is impractical — there are too many pivots and the window to act on a 1-minute divergence is seconds, not minutes. RSI Pro+ automates this with a pivot-based divergence engine that detects both regular divergence (potential reversals) and hidden divergence (trend continuation setups), draws the connecting lines, and triggers alerts. Once a divergence is confirmed (a fixed number of bars after the pivot forms), it does not repaint.
Multi-timeframe RSI table: The same MTF dashboard concept as SuperTrend Pro+ — five timeframes of RSI readings and their OB/OS status in one compact table. Scalpers can instantly see whether higher-timeframe momentum contradicts the setup they are about to take.
For scalping specifically: RSI Pro+ occupies the confirmation role (Layer 3) in a three-layer scalping stack with SuperTrend Pro+ as Layers 1 and 2. When a Pro+ SuperTrend confluence long signal fires on the 1-minute chart and RSI Pro+ simultaneously exits adaptive oversold conditions, the setup has both trend and momentum alignment.
Available at quantzee.com/indicators/rsi-pro/ — part of the full Quantzee suite.
AI Adaptive Quant Toolkit — The Comprehensive Signal Suite
For traders who want a complete scalping system in a single indicator, the AI Adaptive Quant Toolkit takes the concept further than single-purpose tools.
The Toolkit operates on four layers: a Signal Layer (adaptive momentum and trend state detection), an Overlay Layer (dynamic S/R using SmartTrail, TrendCatcher, TrendTracer, and NeoCloud), an Intelligence Layer (machine-learning classification that grades every signal Level 1 through Level 4 by continuation probability), and a Dashboard Layer (real-time trend strength, volatility, volume sentiment, and squeeze metric).
The Autopilot signal engine: Rather than fixed ATR parameters, the Toolkit evaluates dozens of ATR multipliers simultaneously via k-means clustering, computes a performance index on directional P&L in real time, selects the optimal parameter cluster for current volatility, and regenerates its signals automatically. For scalpers, this means the parameters adapt to morning session volatility, midday range compression, and afternoon breakout activity without manual adjustment.
AI Signal Classifier (Level 1–4): Every signal the Toolkit generates is automatically graded. Level 4 signals require multiple internal filters aligned simultaneously — they fire less frequently but carry higher continuation probability. Level 1–2 signals are early-stage and context-dependent. A scalper’s practical rule: trade Level 3–4 signals with standard sizing; treat Level 1–2 signals with caution or skip them in unfavorable conditions.
Preset modes for scalping: The Scalper preset reduces internal parameter ranges, increases sensitivity, and activates gradient candle coloring. Switching the chart to the Scalper preset takes one click — useful when you need to switch from swing to intraday mode mid-session.
Available at quantzee.com/indicators/ai-adaptive-quant-toolkit/ — part of the Quantzee suite.
How to Set Up a Complete Scalping Configuration on TradingView
Here is a step-by-step setup guide for a practical, three-layer scalping configuration using both free built-in and enhanced indicators.
Step 1 — Choose your bias indicator. Add VWAP to your chart from the Indicators library (built-in, free on all TradingView plans). Note where price sits relative to VWAP at session open — this is your intraday bias. Above = long bias. Below = short bias. Do not override this without a strong reason.
Step 2 — Add your primary signal indicator. If using the standard free SuperTrend: set ATR Period to 10, ATR Multiplier to 2.0 for 1-minute charts (or 2.5 for 5-minute). If using SuperTrend Pro+: the defaults are calibrated for scalping. Add it directly from TradingView Indicators once you have a Quantzee subscription.
Step 3 — Add your confirmation. For free setup: Add RSI with period 7, overbought 75, oversold 25. For enhanced setup: RSI Pro+ with default settings. A signal confirms only when RSI direction agrees with the SuperTrend signal.
Step 4 — Define your stops mechanically. Add ATR to a separate pane (period 10). Your stop-loss = 1.5 × ATR from entry. Your first take-profit = 1.0 × ATR. Write these numbers down before entering.
Step 5 — Gate signals by session. Scalping signals fire with higher reliability during the first 90 minutes of a major market session (New York open for US equities, London open for forex) and during the London–New York overlap for forex scalpers. Avoid scalping 30 minutes before and after major news events — ATR expands dramatically and your normal stops are undersized.
Step 6 — Test with Bar Replay before going live. TradingView’s Bar Replay (clock icon in the toolbar) lets you step through historical bars one by one. Run your setup through at least two weeks of 1-minute bars — including one clearly ranging period and one trending period — before committing real capital. Any indicator that changes its historical signals during this test is repainting and should be removed.
Best Scalping Indicators by Asset Class
Different markets have distinct microstructure characteristics that affect which indicators perform best.
Best Scalping Indicators for Forex
Forex scalpers on EUR/USD or GBP/USD should add session context to their standard stack. The London and New York session opens are the highest-liquidity periods; VWAP anchored to the London open (4:00 AM ET) is often more useful than the NYSE open VWAP for EUR/USD.
Recommended stack: VWAP (London-anchored) + SuperTrend Pro+ (1m/5m) + RSI Pro+ for momentum confirmation. Avoid scalping during low-liquidity periods (Sydney–Tokyo overlap for major pairs) — SuperTrend flips will multiply.
Best Scalping Indicators for Crypto
Crypto trades 24/7, which means VWAP session anchoring requires more thought. Most crypto scalpers use a rolling 24-hour VWAP or anchor to midnight UTC. Volatility is typically higher than forex, which means ATR stops should be proportionally wider — a 1.5× ATR stop on BTC/USDT may be 0.5 percent of price on a quiet day.
The AI Adaptive Quant Toolkit’s Autopilot mode is particularly useful here because crypto volatility regimes shift dramatically across sessions. Static SuperTrend parameters that work during high-volume periods will generate excessive false signals in low-volume weekend conditions. An adapting parameter set adjusts automatically.
Best Scalping Indicators for Stocks (Equities)
US equity scalpers benefit from VWAP most strongly — the NYSE open produces the cleanest VWAP anchoring because institutional order flow concentrates at the open. The first 30–90 minutes post-open are typically the highest-volume, most directional period.
For individual stocks, add a gap scanner to your workflow. A stock that opens with a significant gap (above yesterday’s close) tends to produce VWAP reclaim setups with high reliability in the first 30 minutes. SuperTrend Pro+ on the 1m or 5m chart of a gapping stock, filtered by whether price is above or below VWAP, produces a clean signal structure.
Best Scalping Indicators for Gold (XAUUSD) and Commodities
Gold’s intraday behavior is heavily influenced by the London open and the New York market overlap. The highest-quality scalping setups on XAUUSD tend to occur between 08:00–10:00 AM ET when both major financial centers are active.
SuperTrend Pro+ on the 5-minute or 15-minute chart — we have documented a specific gold scalping case study — shows the dual-confluence ATR ladder working with the characteristic momentum moves Gold produces during these sessions.
Common Mistakes Scalpers Make With Indicators
Understanding the pitfalls is as important as understanding the setups.
Over-indexing on historical win rate. Every vendor displays their indicator’s best period. A SuperTrend that produces 80 percent win rate in a trending month may produce 40 percent in a ranging month. The aggregate over twelve months with a mix of conditions is the honest number — and few vendors provide it.
Using too many indicators. Five oscillators on a 1-minute chart all saying slightly different things simultaneously is not confluence — it is paralysis. Two or three indicators doing distinct jobs beats seven doing overlapping jobs.
Ignoring spread and commission. A scalping strategy that produces 0.5 percent per trade in backtests before costs may barely break even after a 0.1–0.2 percent spread on each round trip. Run every scalping system on realistic post-cost P&L figures before going live.
Scalping against the session trend. VWAP is your anchor for a reason. Taking short signals on a stock that is persistently above VWAP for the entire session is fighting the dominant order flow. Even with a technically clean signal, counter-trend scalps carry structural disadvantage.
Chasing signals after the entry point has passed. A SuperTrend signal fires on bar close. If the next bar has already moved 15 pips from the signal close, the original entry is gone. Entering three bars later at a worse price shifts your risk-reward ratio unfavorably. If you missed the entry — skip the trade.
Ignoring the non-repainting test. Indicators with impressive performance charts that repaint are showing you what the historical outcome was, not what the signal said in real time. The only valid performance measure is from live forward-testing or rigorously step-through Bar Replay. See our detailed guide on how to test any TradingView indicator for repainting.
Scalping during news events. Economic releases (CPI, NFP, FOMC, rate decisions) temporarily invalidate all technical setups — spread widens, liquidity drops, price moves on pure reaction. Stop scalping 15 minutes before and 15 minutes after any major scheduled event. The signal will still be there when liquidity normalizes.
Frequently Asked Questions
Conclusion: Your Scalping Edge Is a System, Not a Single Indicator
The traders who consistently profit from TradingView scalping share one trait: they treat their indicator setup as a system with defined roles, rules, and limits — not a collection of tools they add whenever a new “best indicator” appears on a forum.
The best scalping indicator for TradingView in 2026 is not a specific tool. It is the combination that gives you three things simultaneously: direction, signal, and confirmation — with every element non-repainting, low-lag, and calibrated for the timeframe you trade.
For traders who want to build that stack from the ground up with free built-ins, this guide gives you everything you need. For traders who want the adaptive, AI-enhanced version of the same three-layer logic — with self-tuning parameters, automatic divergence detection, and a built-in multi-timeframe dashboard — Quantzee’s SuperTrend Pro+, RSI Pro+, and AI Adaptive Quant Toolkit are designed exactly for that.
All twelve Quantzee indicators are available at a single flat subscription: $9.99/month. No per-indicator pricing, no tiered access — the full suite at entry-level cost.
Related reading from Quantzee:
- Best TradingView Indicators Overall: The 2026 Ranked Guide
- How to Choose the Right AI Trend Indicator
- How to Test Any TradingView Indicator for Repainting
- Non-Repainting TradingView Indicators: The Complete Guide
- SuperTrend Indicator Settings Guide
- Affordable TradingView Indicators That Actually Work
Authority references:
- TradingView Pine Script Repainting Documentation — Official TradingView documentation on repainting behavior
- Investopedia: Average True Range (ATR) — ATR definition and calculation methodology
- Investopedia: VWAP Explained — Complete VWAP guide for traders
- Investopedia: Relative Strength Index (RSI) — RSI mechanics and trading applications
Educational Disclaimer: All content in this article is for informational and educational purposes only. Quantzee indicators are analytical software tools designed for chart analysis. They are not financial advice, investment recommendations, or a guarantee of any trading outcome. The TP/SL levels shown by indicators are visualizations based on technical calculations, not guaranteed targets. Always conduct your own research and apply your own risk management before making any trading decision. Analytical software does not constitute personalized financial advice.