Choosing the right TradingView indicators can be the single most impactful decision you make as a trader. With over 100,000 indicators available in the TradingView public library — and hundreds of premium third-party suites now competing for your subscription dollar — the choice has never been more overwhelming, or more consequential.
In 2026, the bar has been raised significantly. Static, formula-based indicators that worked reasonably well a decade ago now struggle to keep up with the adaptive, high-frequency nature of modern markets. The best tools today incorporate adaptive algorithms, AI-enhanced signal logic, and strict non-repainting guarantees that make backtesting results actually trustworthy.
This guide cuts through the noise. We rank and review the 10 best TradingView indicators in 2026 — covering both free built-ins every trader should know and the premium suites worth paying for. Whether you trade stocks, forex, crypto, or global indices like major indices, you’ll find clear, actionable guidance here.
Want a deeper look at two of the biggest names? Read our full Market Cipher Review 2026 and full FluxCharts Review 2026.
⚡ Key Takeaways
- Non-repainting behavior is the single most important criterion when choosing a TradingView indicator — a tool that alters historical signals makes all backtesting results meaningless and performs randomly in live trading.
- The Quantzee suite's adaptive logic and non-repainting guarantee are independently testable before you buy — and the Pine Script source is emailed to you afterwards, so the logic stays readable.
- LuxAlgo ($54+/month) and Market Cipher (~$600/year) carry significantly higher costs — and they recur — plus reported repainting issues on key signals; the complete Quantzee suite (6 indicators) is $59.99, paid once.
- The best indicator is not the most "accurate" in isolation — it is the one that delivers trend direction, entry timing, and level context in a single non-repainting, adaptive system calibrated to your trading style.
At a Glance: The Top 5 for Most Traders
- Quantzee AI Adaptive Quant Toolkit — best all-in-one system; self-tuning signals + dashboard, $59.99 once for the full suite.
- SuperTrend (free built-in, or Quantzee SuperTrend Pro+) — best free trend tool; Pro+ adds dual-confluence and an ATR trade-level ladder.
- VWAP (free built-in) — best intraday bias anchor for day traders and scalpers; no paid alternative needed for most use cases.
- LuxAlgo — best for traders who want a large, well-documented indicator library and don’t mind $54+/month.
- RSI + MACD (free built-ins) — best zero-cost momentum/trend confirmation pair for swing traders on daily/4-hour charts.
Full rankings, methodology, and the complete comparison table follow below.
How We Ranked These Indicators
Every indicator on this list was evaluated against five criteria:
1. Signal accuracy and reliability Does the indicator generate signals that hold up on the right-hand side of the chart — meaning in live trading, not just in hindsight? We specifically checked for repainting behavior.
2. Non-repainting guarantee Repainting indicators alter historical signals after the fact, making their backtest results meaningless. Any indicator that repainted was penalized heavily. (See our complete guide to non-repainting indicators for more, and our full backtesting guide to run a proper Strategy Tester evaluation.)
3. Ease of use and chart clarity A great indicator should make your chart cleaner, not more cluttered. We evaluated setup complexity, visual design, and how quickly a new user can get productive.
4. AI and adaptive capabilities In 2026, the best indicators adapt to changing market conditions. Static parameter indicators that work well in trending markets but fail in range-bound conditions are graded lower than tools that self-tune.
5. Price-to-value ratio Free built-ins are compared fairly against premium tools. A premium indicator needs to meaningfully outperform what’s freely available to justify its cost.
The 10 Best TradingView Indicators in 2026
1. Quantzee AI Adaptive Quant Toolkit
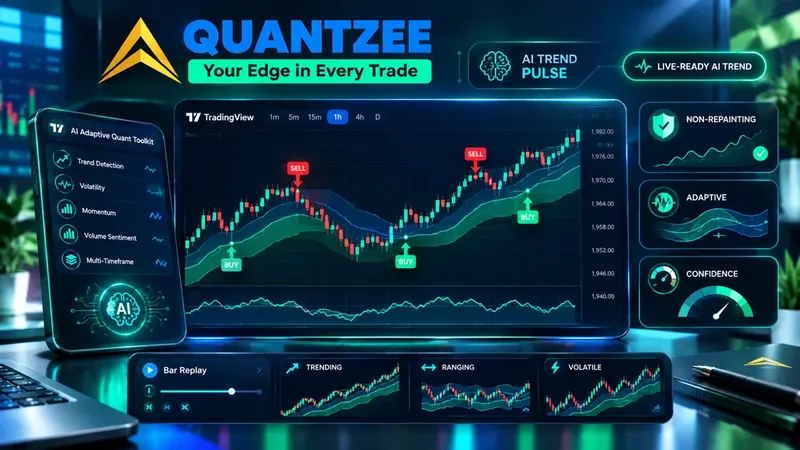
What it is: The flagship of Quantzee’s AI trading indicator suite, the AI Adaptive Quant Toolkit is a complete trading system — not a single indicator. It combines self-tuning buy/sell signals, dynamic overlays, a built-in performance dashboard, and multi-timeframe confluence detection into one unified package.
Best for: Traders who want a complete, ready-to-use system without spending hours configuring individual indicators. Suitable for stocks, forex, crypto, and index derivatives markets.
Key features:
- Self-tuning adaptive algorithm that adjusts to current volatility without manual parameter changes
- Strict non-repainting signal architecture — signals lock on bar close and never change
- Multi-timeframe trend confirmation built in
- Built-in dashboard showing win rate, signal frequency, and trend state
- Works across all asset classes and timeframes
Price: Included in the one-time $59.99 Quantzee suite
Why it ranks #1: The combination of genuine AI adaptability, verified non-repainting behavior, and the fact that it replaces an entire stack of individual indicators at a fraction of the cost makes this the most complete value proposition in the space today.
“Quantzee indicators are worth every penny. Reliable, well-built, and gives real clarity.” — Neil Richards ⭐⭐⭐⭐⭐
2. LuxAlgo
What it is: LuxAlgo is one of the most recognized premium indicator suites on TradingView, offering a large library of overlays, oscillators, and AI signals. It has a large community and extensive documentation.
Best for: Visual traders who want a wide variety of indicator types and an active community for learning.
Key features:
- Large indicator library covering trend, momentum, and volume analysis
- AI Signals & Overlays module (available in Premium and Ultimate tiers)
- AI backtesting feature for reviewing historical signal placement
- Customizable visual overlays with multiple color themes
Price: From $54.39/month (Premium) to $83.99/month (Ultimate)
Deeper analysis — what the price buys you: LuxAlgo Premium includes the Signals & Overlays product (buy/sell signals, trailing stops, support/resistance zones) plus the Oscillator Matrix (divergence and momentum). The Ultimate tier adds the Toolkits library — market structure, liquidity sweeps, and order block detection based on Smart Money Concepts theory.
The AI Signals component uses a machine learning model to generate signals, but the exact methodology is not publicly documented. Backtesting LuxAlgo signals requires careful attention to repainting risk: multiple users in the TradingView community and on independent trading forums have noted that the AI signal arrows can shift position on historical bars when the chart is refreshed — which means backtest results can look better than live trading results.
For high-activity traders who want variety and a large community of tutorial content, LuxAlgo is a reasonable starting point. For traders who prioritize non-repainting integrity above all else, it is not the strongest choice at this price point.
Limitation: Multiple user reports note repainting behavior on key signals, which undermines backtest reliability. Pricing is significantly higher than alternatives that provide comparable or stronger signal quality.
For a detailed comparison, see our LuxAlgo alternative guide.
3. Market Cipher
What it is: Market Cipher is a popular momentum-focused indicator suite originally designed for crypto traders but now used across asset classes. It uses a combination of wave theory and momentum oscillators.
Best for: Crypto traders and swing traders focused on momentum divergences.
Key features:
- Wave momentum indicator combining multiple oscillators into one visual canvas
- Divergence detection (bullish and bearish hidden divergence signals)
- Money flow visualization to identify large player activity
- Color-coded dot system for entry signals
Price: From $99.99/month, or approximately $600/year
Deeper analysis — what you’re actually getting: Market Cipher B, the core product, is built primarily on a combination of the RSI, Stochastic RSI, and a custom wave momentum oscillator — methodologies that are well-known in classical technical analysis. The wave dots (blue dots = bearish whale divergence, yellow dots = bullish signals) are the primary entry signal mechanism. These are rule-based pattern recognition signals, not genuinely adaptive ML.
The “AI” framing around Market Cipher refers more to marketing positioning than to underlying machine learning architecture. The product does not publicly document neural network training, adaptive parameter updates, or out-of-sample validation methodology.
For crypto traders who trade Bitcoin and Ethereum on 4-hour and daily charts, Market Cipher has a loyal following and clear educational resources. For traders outside crypto — particularly for global index trading on 5-minute intraday charts — the crypto-centric calibration makes it a poor fit at any price, let alone $100+/month.
Limitation: The high price point, crypto-centric design, and reported repainting issues on some signals make it a difficult recommendation for traders outside crypto.
See our Market Cipher review for a full breakdown.
4. EMA Crossover (Free Built-In)
What it is: The Exponential Moving Average (EMA) is one of the most fundamental trend-following tools in technical analysis. An EMA crossover strategy — typically using the 9 EMA and 21 EMA, or the 50 and 200 EMA — generates buy/sell signals when faster EMAs cross slower ones.
Best for: Trend traders on daily and weekly charts. Excellent as a filter for higher-timeframe trend direction.
Key features:
- Available free on TradingView with full customization
- Can be applied to any asset and timeframe
- Dozens of free community scripts that automate crossover alerts
Price: Free
How to use EMA crossovers effectively: Not all EMA crossovers are equal. The 9/21 EMA crossover works best for short-term momentum on 5-minute to 1-hour charts. The 50/200 EMA “golden cross” and “death cross” are longer-term trend signals best used on daily charts to frame the macro environment. A practical rule: use the 50/200 daily to determine whether you should be looking for longs or shorts, then use the 9/21 on your intraday chart to time entries.
On global markets (major indices), the 9/21 EMA on the 15-minute chart is one of the most widely watched crossovers — which is itself part of why it works. The self-reinforcing nature of widely-used signals means EMA crossovers can be used as both an entry trigger and as a momentum confirmation tool.
Limitation: EMA crossovers are inherently lagging — they confirm trends after they’ve begun, meaning entries are rarely at the best price. In range-bound markets, EMA crossovers generate frequent false signals (whipsaws). Pre-filtering with CPR width (only taking crossovers on narrow-CPR trending days) dramatically improves their reliability in global markets.
Beyond a single crossover: A single EMA crossover tells you little about which moving average actually matters on this chart. Quantzee’s AI TrendPulse — part of the paid suite — adds adaptive EMA trend detection, an AI commentary engine, and reversal alerts on top of the classic crossover.
5. VWAP — Volume Weighted Average Price (Free Built-In)
What it is: VWAP calculates the average price of an asset weighted by volume throughout the trading day. It’s the single most important intraday reference level used by institutional traders.
Best for: Day traders and scalpers trading equities or index futures. Particularly powerful on stocks and indices like the index where institutional activity is significant.
Key features:
- Identifies intraday fair value — price above VWAP is bullish, below is bearish
- Standard deviation bands available to identify overextended moves
- Automatic reset at market open
Price: Free (built into TradingView)
How to use it: Treat VWAP as dynamic support/resistance. Entries near VWAP on the bullish side with strong volume confirmation tend to be high-probability long opportunities. Shorts near VWAP with failed reclaim attempts are equally powerful.
Advanced VWAP techniques: The VWAP standard deviation bands (±1SD, ±2SD) deserve more attention than most traders give them. Price reaching the +2SD band on the index 5-minute after a sharp morning rally is one of the most reliable mean-reversion signals in intraday trading — the +2SD band on a high-beta index often coincides with key resistance and produces precision short entries for options sellers. Similarly, the first VWAP retest after a strong gap-up open — typically 30-45 minutes into the session on trending days — is considered the highest-quality entry of the session by experienced intraday traders.
For swing traders: VWAP anchored to a specific significant candle (post-earnings, post-news event, post-support break) provides a more relevant fair value reference than a rolling daily VWAP. TradingView’s anchored VWAP function enables this.
Beyond session anchoring: The built-in VWAP only anchors to the session. Quantzee’s paid suite includes indicators like SuperTrend Pro+ and SMC Toolkit Pro that layer institutional-style reference levels — order blocks, fair value gaps, and liquidity zones — on top of VWAP’s session-anchored view.
6. SuperTrend (Free vs. Quantzee SuperTrend Pro+)
What it is: SuperTrend is an ATR-based trend indicator that generates directional bias and dynamic stop-loss levels. It’s one of the most popular indicators globally for major indices trading.
Best for: Trend-following traders, position traders, and options sellers who need clear directional bias.
Free version key features:
- Clear color-coded trend direction (green = bullish, red = bearish)
- Dynamic trailing stop-loss levels
- Default settings: ATR Period 10, Multiplier 3.0
Free version limitations: The standard SuperTrend lags in fast-moving markets, generates significant whipsaws in sideways conditions, and uses fixed ATR parameters that don’t adapt to changing volatility regimes.
country-specific SuperTrend settings: The default SuperTrend settings (ATR 10, Multiplier 3.0) are too slow for intraday. For 5-minute major indices trading, ATR 7 with Multiplier 2.0–2.5 is the standard configuration used by active index options traders. This tighter calibration responds to the higher average true range of these instruments relative to the global indices the default settings were originally calibrated for.
On expiry Thursdays, a high-beta index’s ATR can spike to 2–3x normal, causing even calibrated SuperTrend settings to generate false reversals. On expiry days, experienced options traders often reduce their SuperTrend reliance and lean more heavily on CPR and VWAP levels as anchors.
Quantzee SuperTrend Pro+ upgrade: The SuperTrend Pro+ indicator enhances the classic formula with dual-SuperTrend confluence and AI-enhanced volatility adjustment, dramatically reducing false signals while maintaining the simplicity of the original.
For a complete guide to settings and strategies, see SuperTrend Indicator: Best Settings Guide 2026.
Price: Free (basic) / Included in the one-time $59.99 Quantzee suite (Pro+ version)
7. RSI — Relative Strength Index (Free Built-In)
What it is: The RSI is a momentum oscillator developed by J. Welles Wilder that measures the speed and magnitude of recent price changes. It oscillates between 0 and 100, with readings above 70 considered overbought and below 30 considered oversold.
Best for: Identifying potential reversal zones and momentum divergences. Best used as a filter alongside a trend indicator, not in isolation.
Key features:
- Built into TradingView for free with full customization
- Standard period: 14 (can be reduced to 9 for more sensitivity)
- Divergence between RSI and price is a powerful leading signal
Effective use strategy: RSI is most powerful when combined with a trend filter. In an uptrend, look for RSI to pull back to the 40–50 zone (not necessarily 30) before re-entering long. In downtrends, rallies to the 50–60 RSI zone often provide short entries.
RSI divergence — the most underused signal: When price makes a new high but RSI makes a lower high (bearish divergence), or price makes a new low but RSI makes a higher low (bullish divergence), the divergence often precedes a trend reversal. RSI divergence on the 15-minute chart of the index or a high-beta index is one of the highest-conviction signals available for free — particularly when the divergence forms near a CPR level or VWAP standard deviation band.
Period selection: Use RSI(14) for daily and 4-hour charts. For 5-minute and 15-minute intraday charts, RSI(9) gives faster, more responsive signals without sacrificing reliability. The standard RSI(14) on 5-minute charts is too slow for intraday — by the time it reaches extreme levels, the move is often already past the optimal entry.
Limitation: RSI can remain in overbought or oversold territory for extended periods in strongly trending markets, leading to premature exits if used as a standalone signal. On major indices, this is particularly common on expiry Thursdays when directional momentum can sustain extreme RSI readings for 60–90 minutes.
8. Bollinger Bands (Free Built-In)
What it is: Bollinger Bands — created by John Bollinger — plot a 20-period simple moving average with standard deviation bands above and below. The width of the bands expands and contracts based on volatility — tight bands (low volatility) often precede large directional moves.
Best for: Volatility-based setups, mean reversion in range-bound markets, and identifying volatility breakouts.
Key features:
- Band squeeze identifies low-volatility consolidation periods before breakouts
- Price touching the upper/lower band doesn’t automatically mean reversal — in trends, price can “walk the band”
- Combine with RSI for mean reversion setups
Price: Free (built into TradingView)
Limitation: Bollinger Bands are a descriptive tool — they tell you where price is relative to recent volatility, but they don’t tell you direction. They need to be combined with trend and momentum context to be useful.
Beyond a descriptive tool: Quantzee’s paid suite addresses exactly that limitation — MACD Pro+ grades every cross Strong or Weak via an adaptive chop zone, and SuperTrend Pro+ adds dual-SuperTrend confluence and a trend-strength gradient — giving Bollinger Bands’ volatility read the directional context it lacks on its own.
9. MACD — Moving Average Convergence Divergence (Free Built-In)
What it is: MACD is a trend-following momentum indicator that shows the relationship between two exponential moving averages (typically 12 and 26 periods). The MACD line crossing the signal line generates buy/sell signals; the histogram visualizes momentum strength.
Best for: Identifying momentum shifts and trend changes on daily and weekly charts. Works well as a confluence tool.
Key features:
- MACD crossovers above/below the zero line identify bull/bear market regimes
- Histogram divergence is a leading signal for potential reversals
- Zero-line crossovers are the highest-conviction signals
Price: Free (built into TradingView)
Limitation: MACD is a lagging indicator by nature. On short timeframes (under 15 minutes), noise dominates and the indicator becomes unreliable. Stick to daily and 4-hour charts for highest-quality MACD signals.
Quantzee MACD Pro+ upgrade: Most of that short-timeframe noise comes from whipsaw crosses near the zero line. MACD Pro+ grades every signal-line cross Strong or Weak using an adaptive chop zone sized from the MACD’s own volatility, adds an optional price-normalized mode for cross-symbol comparison, 4-phase histogram coloring, a pivot-based divergence engine, and a five-timeframe MACD dashboard — non-repainting on all markets and timeframes.
10. Indicators for Gold (XAUUSD) and Commodities
What’s different about commodities: Gold and other commodities trade on distinct session dynamics — the London open and the London–New York overlap dominate intraday direction for XAUUSD, and commodity volatility often spikes around macro data releases (US CPI, Fed rate decisions, dollar-index moves) in ways equity indices don’t.
What works: The same core toolkit (VWAP for session bias, SuperTrend for trend direction, RSI for momentum context) applies to commodities, but timeframe and session selection matter more than indicator choice. SuperTrend on the 5-minute or 15-minute chart, applied specifically during the 08:00–10:00 AM ET window when major financial centers overlap, tends to catch the highest-quality directional moves in Gold.
Where Quantzee fits: SuperTrend Pro+‘s dual-confluence approach reduces the false flips that plague single-SuperTrend setups during Gold’s frequent mid-session consolidation phases — the same limitation covered in our best indicators for high-beta index trading guide, which applies the same principle to volatile index instruments.
Price: Same one-time $59.99 suite — no separate commodity-specific pricing tier.
Free vs. Paid TradingView Indicators: What You Actually Gain
What free built-ins give you: VWAP, SuperTrend, RSI, MACD, EMA crossovers, and Bollinger Bands are all available on any TradingView plan at no cost, and they cover the core building blocks of most trading systems. For a trader willing to manually tune parameters, backtest their own settings, and monitor multiple timeframes by eye, free built-ins are a complete starting toolkit.
What paid suites add — and what to actually check before paying:
- Adaptive/self-tuning parameters — instead of a fixed ATR multiplier or RSI period you set once, some paid tools adjust to current volatility automatically. Verify this is a real adaptive mechanism (documented logic) rather than just a marketing label on a static indicator.
- Multi-timeframe dashboards — a single-glance view of trend/momentum status across several timeframes, saving the manual work of flipping between charts.
- Non-repainting guarantees, explicitly tested — the single most important thing to verify before paying for any tool, free or paid. See the Repainting Problem section below.
- Consolidated tooling — one subscription replacing what would otherwise be five or six separately-configured free indicators.
The honest trade-off: Paid tools save configuration time and add adaptive logic; they do not add certainty. No paid indicator, including Quantzee’s, guarantees a specific win rate or removes trading risk. The value case for paying is convenience, consolidation, and (where genuinely adaptive) reduced manual re-tuning — not a promise of better outcomes than a well-configured free setup.
“Non-repainting signals and adaptive trend logic helped filter bad trades in forex.” — Jason Smith ⭐⭐⭐⭐⭐
The Repainting Problem: Why It Should Drive Your Choice
Before you commit to any indicator — free or paid — the single most important question to answer is: does it repaint?
Repainting means the indicator recalculates historical signals as new price data arrives. A buy arrow that appeared at bar close can disappear or shift position when you refresh your chart. This makes the indicator’s historical chart look far more accurate than its live trading behavior will be.
How to test for repainting: Use TradingView’s Replay function. Set the indicator up on a historical period you haven’t looked at, then play through bar by bar. If signals appear and then vanish or move, the indicator repainted. This test takes less than 5 minutes and is the most valuable due diligence you can do before paying for any signal tool.
Non-repainting indicators (Quantzee’s full suite, SuperTrend on TradingView, VWAP, RSI, standard EMAs) lock their signals on bar close. What you see at bar close is what will always appear on that bar — making historical testing actually meaningful.
This distinction is why non-repainting guarantee is weighted heavily in our ranking methodology. A “best indicator” that repaint its signals isn’t reliable enough to trade.
How to Choose the Right Indicator for Your Trading Style
The right indicator isn’t the “best” indicator in absolute terms — it’s the one that aligns with your specific trading approach. Here’s a quick framework:
If you’re a day trader (intraday, 5–15 min charts): VWAP is non-negotiable as your anchor. Layer in SuperTrend or the AI Adaptive Quant Toolkit for directional bias. Avoid MACD on short timeframes — it’s too lagging.
If you’re a swing trader (daily charts, 3–10 day holds): EMA crossovers (20/50 or 50/200) for trend direction, RSI for entry timing, and MACD for momentum confirmation. The AI TrendPulse from Quantzee is an excellent single-indicator replacement for this entire stack.
If you’re an options trader (especially global markets): SuperTrend Pro+ for directional bias. Avoid momentum oscillators as primary signals — focus on range and directional conviction.
If you want one complete system: The Quantzee suite gives you AI-powered versions of trend, momentum, and level-based analysis in one package. At $59.99 paid once, it is the most cost-efficient complete solution available — and the only one in this list whose total cost is already known.
Questions to ask before paying for any indicator:
- Does it repaint? (Always test this first)
- Does it work across multiple timeframes or just one?
- Can you get a trial or money-back guarantee?
- Is there documentation explaining the methodology?
- Does it adapt to volatility or use fixed parameters?
What’s New for 2026
A few shifts worth flagging for anyone returning to this list after using it in prior years:
- Adaptive/AI-labeled indicators have become the market norm, not the exception. Where a few years ago “AI-powered” was a differentiator, most premium suites now claim some form of adaptive logic — which makes independent verification (does the methodology hold up under TradingView’s Bar Replay?) more important than the label itself.
- Repainting scrutiny has increased. Community reporting and independent trading forums have become more vocal about flagging repainting behavior in popular premium scripts — treat any indicator without a clear non-repainting statement as unverified until you test it yourself.
- Consolidated flat-rate suites vs. à la carte pricing — several vendors have moved toward bundling multiple tools under one subscription rather than per-indicator pricing, following the model this list has tracked since 2026.
- This page is reviewed and refreshed periodically — see the “Last updated” date at the top. Pricing, feature sets, and repainting status for any third-party product can change without notice; always re-verify before committing to a paid subscription.
Best Free TradingView Indicators in 2026
Not every trader is ready to commit to a paid subscription — and you shouldn’t have to be to start trading with quality tools. Here’s a clear breakdown of what’s genuinely free in 2026.
Quantzee’s Pricing
Quantzee’s suite is paid — one payment of $59.99 for all 6 indicators, with no permanently free indicator and no trial — but each indicator’s non-repainting architecture is independently verifiable before you buy, via TradingView’s Bar Replay.
TradingView Built-In Frees (Also Worth Knowing)
TradingView’s own library includes several reliable free indicators that belong in every trader’s toolkit:
- VWAP — the institutional intraday reference level (covered in depth at #5 above)
- EMA crossovers — foundational trend-following tool (#4 above)
- RSI — momentum oscillator for identifying overbought/oversold conditions (#7 above)
- Bollinger Bands — volatility envelope for squeeze and band-walk setups (#8 above)
- MACD — momentum + trend confirmation for daily and 4-hour charts (#9 above)
- SuperTrend — ATR-based trend direction and trailing stop (#6 above)
When Free Tools Reach Their Limits
Free TradingView built-in indicators use fixed or standard parameters. They work well for most retail traders getting started. However, as your trading becomes more systematic, built-ins hit a ceiling: no multi-indicator confluence, no AI-adaptive parameter tuning, no account-level signal logic.
That’s where the full Quantzee suite ($59.99 once for all 6 indicators) becomes relevant. It’s the same non-repainting analytical software (not investment advice — for educational and informational use only), with adaptive AI logic layered on top — and it’s still a fraction of what LuxAlgo or Market Cipher charge for less.
Quick Comparison: Top TradingView Indicators 2026
| Indicator | Type | Price | Non-Repainting | Best For | Free TV Plan |
|---|---|---|---|---|---|
| Quantzee | AI-powered | $59.99 once | ✅ Yes | All markets, all styles | ✅ Yes |
| LuxAlgo | Classic TA overlays | $54+/mo | ⚠️ Mixed | US equity, crypto | ❌ Paid needed |
| Market Cipher | Momentum oscillator | $600/yr | ⚠️ Mixed | Crypto | ❌ Paid needed |
| SuperTrend (built-in) | ATR trend | Free | ✅ Yes | All markets | ✅ Yes |
| VWAP (built-in) | Institutional benchmark | Free | ✅ Yes | Intraday, stocks | ✅ Yes |
| RSI (built-in) | Momentum | Free | ✅ Yes | Overbought/oversold | ✅ Yes |
| EMA Crossover | Trend-following | Free | ✅ Yes | Trending markets | ✅ Yes |
Explore Quantzee Indicators
All 6 indicators, $59.99 once, source code emailed. No free tier or trial:
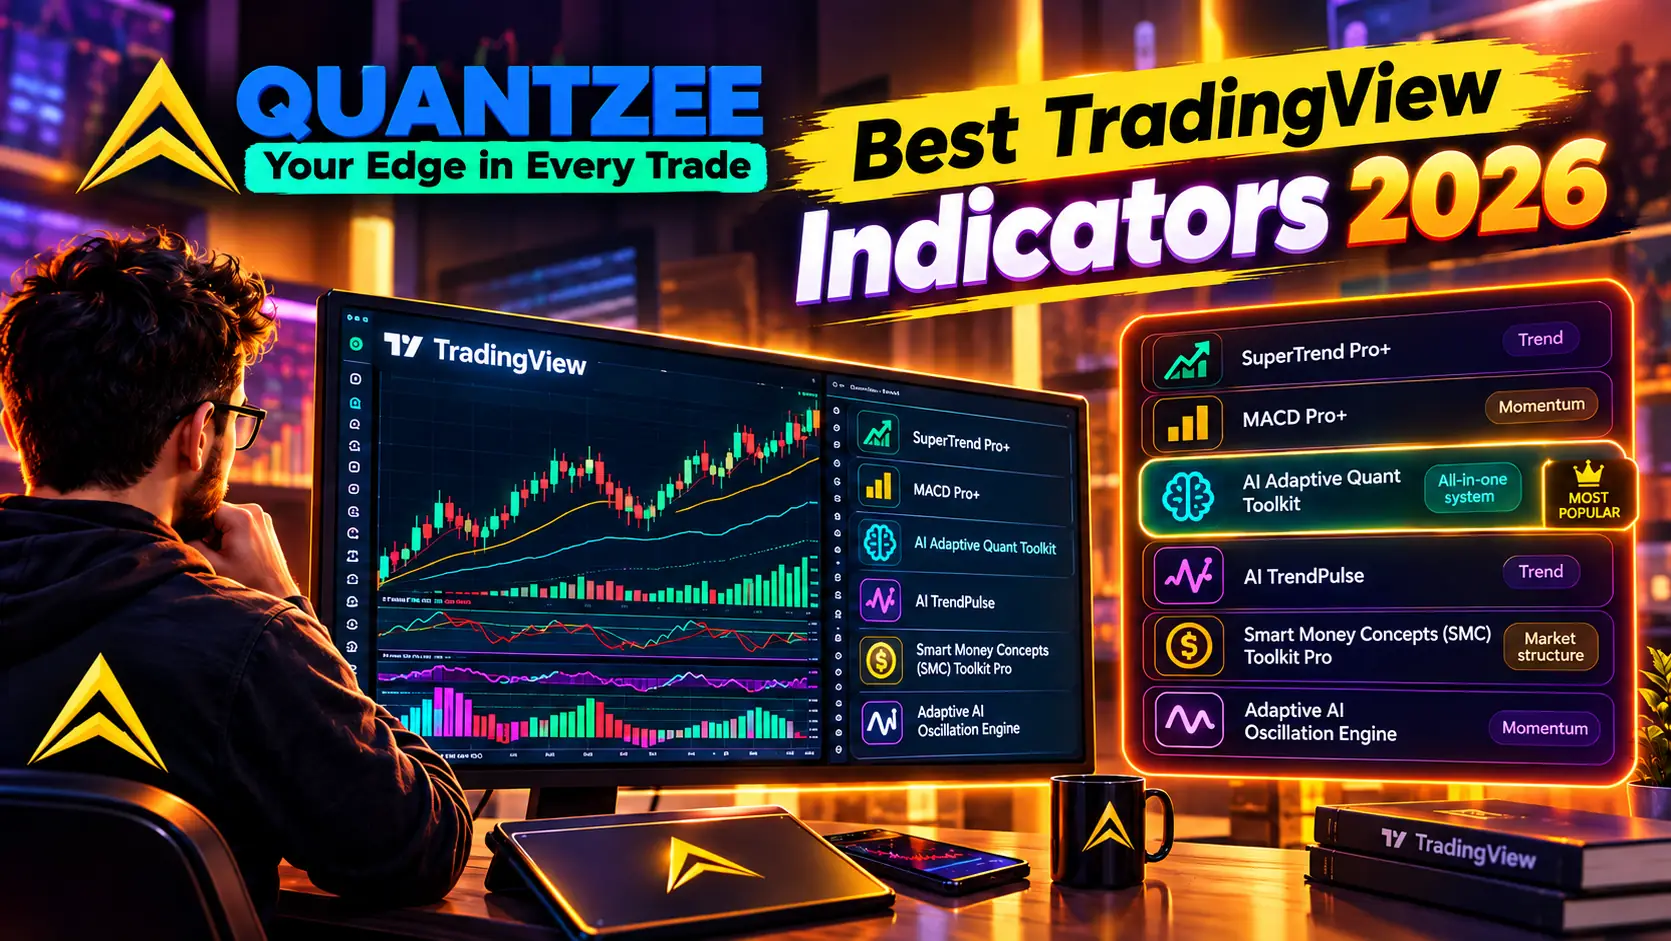
- MACD Pro+ — grades every cross Strong or Weak via an adaptive chop zone, plus a divergence engine & MTF dashboard — non-repainting
- SuperTrend Pro+ — dual-SuperTrend confluence with an automatic ATR Entry/TP/SL ladder
- AI Adaptive Quant Toolkit — self-tuning signals, overlays & dashboard — no repainting
- AI TrendPulse — adaptive EMA trend detection & reversal alerts — non-repainting
- Adaptive AI Oscillation Engine — momentum & divergence detection
- SMC Toolkit Pro — complete Smart Money Concepts overlay — non-repainting on confirmed bars
View all indicators · See pricing