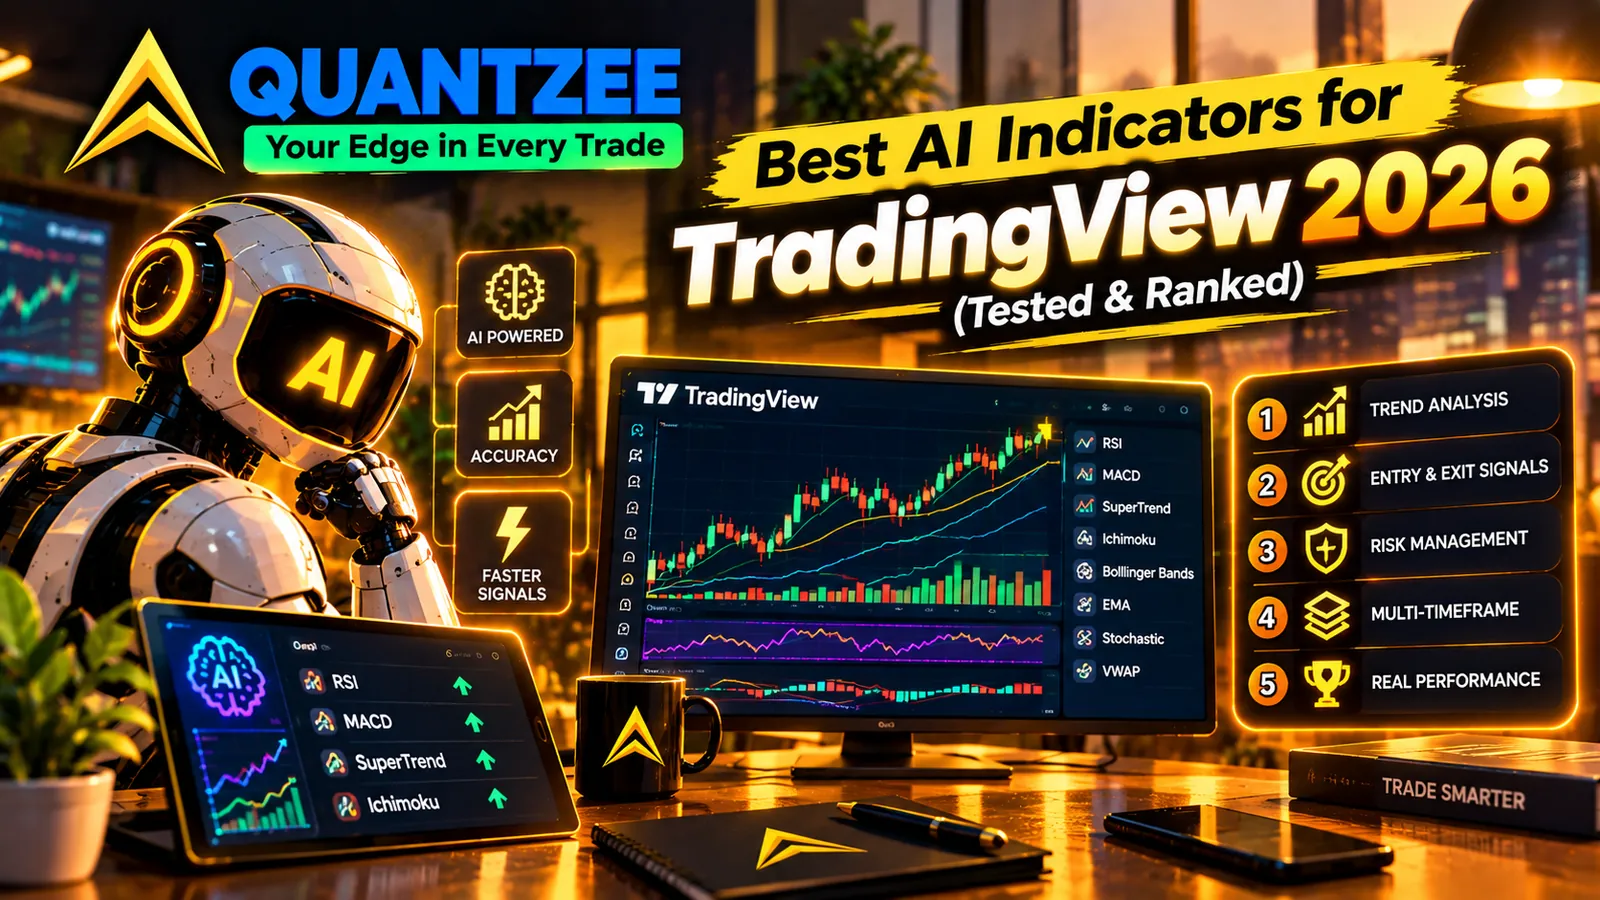
The best AI trading indicators for TradingView in 2026 are the ones that demonstrably change behavior between trending and ranging markets — genuine adaptive systems like Quantzee’s suite ($59.99 once, source code included) rather than fixed-formula indicators carrying an “AI” label with no functional adaptation.
From 2023 to 2026, the phrase “AI-powered” became the most overused — and most misunderstood — term in the trading tools industry. Every developer with a slightly complex formula started calling their indicator “AI-enhanced.” Every marketing page promised machine learning-backed signals.
The reality is more nuanced and, for serious traders, more exciting. Genuine AI trading indicators for TradingView do exist, and the best ones represent a meaningful leap forward over static technical analysis. They adapt to changing market regimes, filter noise more effectively, and generate signals that hold up in live trading in ways that fixed-parameter indicators cannot.
This guide cuts through the marketing noise. We explain exactly what makes an indicator genuinely AI-powered, compare the top options in 2026, and give you a framework for evaluating any AI indicator claim before you spend money on it.
⚡ Key Takeaways
- Genuine AI indicators adapt their parameters to market conditions in real time — "AI" branding on a fixed-formula indicator is a marketing label, not a functional capability
- The defining test: does the indicator behave differently in trending vs. ranging markets? Regime-aware signal logic is the hallmark of authentic AI implementation
- Non-repainting is especially critical in adaptive systems — parameter updates must never retroactively alter historical signals; verify with TradingView's Bar Replay
- At $59.99 paid once, Quantzee's 6-indicator AI suite costs about one month of LuxAlgo ($54+/month) or Market Cipher (~$50/month) — in total, with no renewal — and adds verified adaptive ML plus a guaranteed non-repainting architecture
- Quantzee's non-repainting architecture is independently testable, so you can validate genuine AI signal quality before buying — and the Pine Script source is emailed to you afterwards, so you can read how the adaptation actually works
The Rise of AI in Retail Trading: 2023–2026
The proliferation of AI trading tools for retail traders has been driven by three converging trends:
1. Computational accessibility Machine learning models that required institutional-grade infrastructure in 2015 can now run efficiently on TradingView’s Pine Script engine or as cloud-computed overlay signals. The computational barrier that once reserved AI trading tools for hedge funds has largely disappeared.
2. Large language models normalizing AI expectations The mainstream adoption of LLMs from 2023 onward shifted trader expectations dramatically. If AI could write code, analyze documents, and generate content with impressive accuracy, why couldn’t it analyze price charts more effectively than static formulas developed in the 1970s and 1980s? This created genuine demand for AI trading tools — and an equally large supply of products that use the word “AI” as a marketing label without substantive implementation.
3. Market regime complexity The 2023–2026 period was characterized by unusually rapid transitions between trending and ranging market conditions across all asset classes. Static indicators optimized for one regime performed poorly in the other. Adaptive algorithms that could detect and adjust to the current regime became genuinely valuable, not just theoretically interesting.
The result: a market with genuine AI indicators delivering real value, surrounded by a much larger market of “AI-branded” products that are, in practice, standard technical analysis with a sophisticated name.
What Makes an Indicator Genuinely “AI-Powered”?
Before evaluating any specific product, you need a framework for understanding what authentic AI implementation in a trading indicator actually looks like.
Adaptive Parameter Optimization
Traditional indicators use fixed parameters. The standard RSI uses a 14-period lookback — always. Bollinger Bands use a 20-period SMA with 2 standard deviations — always. These settings were established by their creators based on the market conditions of their era and have remained largely unchanged.
AI-powered indicators, by contrast, dynamically adjust their parameters based on current market conditions. An adaptive RSI might use a 9-period lookback in trending conditions (where momentum is the primary signal) and a 21-period lookback in ranging conditions (where noise needs to be filtered more aggressively). The optimization happens continuously as new data arrives.
This adaptability is the most practically valuable feature of AI indicators. Markets cycle through different regimes — trends, ranges, high volatility, low volatility — and an indicator that self-optimizes for the current regime will outperform a static indicator over any sufficiently long period.
Pattern Recognition at Scale
Machine learning models can be trained on millions of historical price patterns to identify configurations that precede specific outcomes. Rather than relying on hand-coded rules (“when the 9 EMA crosses the 21 EMA”), ML pattern recognition can identify complex multi-variable setups that would be impossible to express as explicit rules.
The practical effect: signals that aren’t derived from single-indicator crossovers or thresholds, but from the recognition of complex price structure patterns that have historically preceded significant moves.
Market Regime Detection
A critical capability of genuinely AI-powered indicators is the ability to detect the current market regime — trending, ranging, high volatility, mean-reverting — and adjust both signal generation and risk parameters accordingly.
Most trading losses from indicator-based strategies come from applying trend-following logic in ranging markets (generating repeated false breakout signals) or applying mean-reversion logic in strongly trending markets (repeatedly fading moves that continue in the original direction). An AI indicator that accurately classifies the current regime and switches its behavior accordingly eliminates an entire category of systematic losses.
Divergence from Classic Formulas
Genuine AI indicators often behave differently from their classic counterparts in ways that can’t be explained by simple parameter changes. If an “AI RSI” behaves exactly like a standard RSI with different settings, it’s not genuinely AI-powered — it’s just a customized RSI. Genuine AI implementation produces signal characteristics that emerge from learned patterns rather than explicit formulas.
Why AI Indicators Beat Static Indicators (In the Right Conditions)
Static indicators fail predictably in two common scenarios:
Scenario 1: Regime transitions A trader sets up a trend-following system using EMA crossovers and SuperTrend. It performs well for six months in a trending market. Then the market transitions to a range-bound phase. The same system generates repeated false signals as price oscillates around the trend indicators without establishing a clear direction. The trader doesn’t change the system because the backtest showed it working — but the conditions the backtest was run on no longer exist.
An AI indicator with regime detection would have identified the transition to ranging conditions and either (a) switched off trend signals, (b) switched to mean-reversion signals, or (c) reduced position sizing guidance to reflect lower-confidence conditions.
Scenario 2: Volatility misalignment A trader uses fixed ATR settings on their SuperTrend indicator (ATR 10, Multiplier 3.0). During a high-volatility period — an earnings season, a geopolitical event, or index rebalancing — the ATR multiplier is too tight, generating repeated false trend reversals as the increased volatility triggers stop levels that would hold in normal conditions.
An AI indicator with volatility adjustment would widen the ATR multiplier automatically during elevated volatility periods, maintaining signal quality without manual reconfiguration.
AI-Powered vs. AI-Labeled: The Practical Distinction
The most important skill for any trader evaluating AI indicator claims in 2026 is the ability to distinguish genuinely adaptive systems from standard indicators with AI branding. Here is a direct comparison of what each category looks like in practice:
Genuine AI Implementation: What to Look For
1. Continuous self-calibration: The indicator’s parameters update as new data arrives. Ask: “If I set up this indicator on a chart today and come back in 3 months, will its behavior have adapted to the current market environment, or will it behave identically regardless of what happened in those 3 months?” A genuinely adaptive system adapts.
2. Regime-aware signal logic: The indicator behaves differently in trending vs. ranging conditions — not just in degree, but in kind. It should generate directional trend signals in trending markets and mean-reversion or volatility-based signals in ranging markets. Fixed indicators generate the same type of signal regardless of regime.
3. Documented methodology: The developer should be able to explain the AI technique used — adaptive moving averages, k-nearest neighbor pattern recognition, volatility regime classifiers, or similar. “Our algorithm uses AI” without specifics is a red flag.
4. Non-repainting architecture in adaptive systems: This is technically difficult. Adaptive algorithms that update parameters continuously can easily cause repainting if the retrospective parameter update is applied to historical signal generation. A genuinely well-engineered adaptive indicator prevents this by applying parameter updates only to new bars, never retroactively to historical bars.
AI-Labeled Indicators: Red Flags
- The backtest looks perfect but the live signals diverge significantly — often a repainting symptom
- “AI” is described in marketing copy but no specific technique (ML model type, training approach, adaptation mechanism) is mentioned in documentation
- The signals behave identically in trending and ranging markets — no regime awareness
- The developer’s only response to “does it repaint?” is “no, trust us” — testable claims only
Quantzee’s Specific ML and Adaptive Approach
Quantzee’s indicator suite is built on what it describes as continuously adaptive algorithms — a specific architecture choice that differs from static ML deployment in important ways.
Dual-SuperTrend Confluence (SuperTrend Pro+): Rather than one SuperTrend with fixed ATR settings, SuperTrend Pro+ runs two SuperTrend calculations — a faster responsive signal and a slower confirmation signal — and generates a buy signal only when both agree. This dual-confirmation approach significantly reduces false signals in choppy conditions. The ATR periods and multipliers for both calculations are continuously adjusted based on the current volatility regime.
ATR Volatility Adaptation: The ATR-based adaptive filter used across multiple Quantzee indicators monitors the rolling ATR distribution and places the current ATR within that distribution. When current volatility is in the 70th percentile or above of its historical range, the system automatically widens signal thresholds to prevent the stop-hunt false signals that plague static-parameter indicators in high-volatility conditions.
Non-Repainting Architecture: Quantzee’s prospective-only update mechanism ensures that parameter recalibration never retroactively alters historical signals. When the adaptive algorithm updates its ATR multiplier or trend sensitivity, that update applies from the current bar forward — the historical signal that appeared at bar 150 remains exactly as it appeared when bar 150 closed. This is the architectural design that makes Quantzee’s backtest results meaningful.
Multi-Timeframe Dashboard Integration: AI TrendPulse includes a real-time multi-timeframe agreement dashboard — showing trend classification across 5, 15, 60, and daily timeframes simultaneously. This condensed regime view helps traders quickly identify when all timeframes align (higher confidence signals) vs. when they conflict (wait for clarity).
Disclaimer: Quantzee indicators are analytical software tools designed to assist your own analysis. This content is for educational purposes only and does not constitute investment advice. Do your own research. Trading involves risk of capital loss. Quantzee is not a registered investment advisor. Analytical software, not investment advice.
| Feature | Quantzee | LuxAlgo | Market Cipher | TV Built-ins |
|---|---|---|---|---|
| AI / ML signals | ✅ Adaptive ML | ❌ Classical TA | ❌ Static logic | ❌ No AI |
| Non-repainting | ✅ Guaranteed | ⚠️ Mixed reports | ⚠️ Mixed reports | ✅ Yes |
| Price | $59.99 once | $54+/mo | $600/yr (~$50/mo) | Free |
| global markets tools | ✅ Yes | ⚠️ None | ❌ Crypto/US only | ✅ Yes |
| Free TradingView plan | ✅ Yes | ❌ Paid needed | ❌ Paid needed | ✅ Yes |
| Suite size | 6 AI indicators | 50+ (complex) | 4 indicators | 100+ built-in |
Top AI TradingView Indicator Suites in 2026
Quantzee — Top Pick
Quantzee is the standout AI trading indicator suite for TradingView in 2026 for several converging reasons: genuine adaptive algorithm implementation, verified non-repainting architecture, comprehensive market coverage, and an exceptionally competitive price point.
The AI Adaptive Quant Toolkit is the flagship. Its core algorithm continuously evaluates volatility regime, trend strength, and momentum state to adjust its signal parameters in real time. The result is an indicator that performs consistently across the spectrum of market conditions — not just in the trending environments where most indicators look good in backtesting.
The Adaptive AI Oscillation Engine extends this adaptive approach to momentum analysis. Rather than fixed overbought/oversold thresholds, it adjusts its detection zones based on the current momentum regime — identifying divergences and exhaustion signals that static oscillators miss in trending conditions.
AI TrendPulse provides higher-timeframe trend context, using pattern recognition trained on historical trend structures to classify the current market state with a confidence score — not just a binary bullish/bearish signal.
SMC Toolkit Pro identifies key support and resistance levels using market-structure pattern recognition — order blocks, fair value gaps, and liquidity zones — automatically plotting the levels most likely to be significant based on historical price behavior rather than simple pivot point formulas.
All of this comes with the single $59.99 purchase, with strict non-repainting guarantees across the entire suite and the Pine Script source emailed to you.
“Clear AI trend signals and automatic entries make trading much easier.” — Tim Spencer ⭐⭐⭐⭐⭐
LuxAlgo
LuxAlgo offers AI-branded signals in its Premium and Ultimate tiers. The AI Signals & Overlays product uses a machine learning model to generate buy/sell signals. The implementation has merit, but user community feedback raises concerns about signal repainting, and the pricing — $54–$84/month — represents a significant premium over alternatives with comparable or stronger AI implementation.
For a detailed comparison, see our LuxAlgo alternative guide.
Market Cipher
Market Cipher is often described as AI-powered, but its core methodology is primarily wave theory and momentum oscillator combination rather than machine learning. The “AI” component is not clearly documented. At $99+/month and with a crypto-centric design, it’s a difficult recommendation for traders outside that asset class.
See our Market Cipher review for a detailed comparison.
TradingView’s Built-In “Smart” Indicators
TradingView’s own platform has introduced “Smart” features including Smart Money Concepts and enhanced volume analysis. These are useful tools but are largely rule-based implementations of established trading methodologies rather than genuinely adaptive machine learning systems.
Deep Dive: Quantzee’s AI Approach
Understanding how Quantzee implements AI is valuable both for evaluating the product and for understanding what good AI indicator design looks like in practice.
Adaptive algorithm architecture: Rather than training a static machine learning model and deploying it to production (a common approach that fails when market conditions change), Quantzee’s indicators use continuously adaptive algorithms that update their internal parameters as new market data arrives. The algorithm is always calibrated to recent market behavior, not conditions from a training period that may be months or years old.
Non-repainting by design: The adaptive recalculation happens prospectively — the algorithm updates its parameters using confirmed historical data, and the updated parameters are applied to generate signals on new bars only. Historical signals are never recalculated. This is the architectural choice that makes non-repainting possible in an adaptive system — it requires deliberately preventing the algorithm from retroactively improving its historical signals when it updates its parameters.
Multi-market calibration: The adaptive approach means Quantzee indicators work across different asset classes without manual reconfiguration. The same AI Adaptive Quant Toolkit generates quality signals on the index futures, forex majors, Bitcoin, and US equities — because the algorithm adapts to each market’s specific volatility and trend characteristics automatically.
Signal confluence: Quantzee’s suite is designed for internal confluence — multiple indicators from the suite are calibrated to work together. The AI Adaptive Quant Toolkit, AI TrendPulse, and SMC Toolkit Pro can be layered on the same chart with minimal visual noise, providing multi-factor confirmation that increases signal quality without indicator duplication.
“Quantzee indicators are worth every penny. Reliable, well-built, and gives real clarity.” — Neil Richards ⭐⭐⭐⭐⭐
How to Evaluate AI Indicator Claims
Before purchasing any AI trading indicator, ask these questions:
1. What specific AI technique is being used? The seller should be able to name the approach: adaptive algorithms, neural network pattern recognition, gradient boosted decision trees, reinforcement learning, etc. “AI-powered” without further specification is a red flag.
2. Is the AI model static or adaptive? A static model was trained on historical data and hasn’t been updated since. In fast-changing markets, static models degrade. Adaptive models continuously update based on new data. Ask specifically: “When was the model last retrained, or does it adapt continuously?”
3. Does the AI implementation cause repainting? Many AI indicators use lookahead data in their training, causing repainting. Ask: “Are signals generated on bar close only? Does the model use future data in any calculation?” Then test it yourself using the replay method. See our non-repainting guide for the full testing methodology.
4. What markets and timeframes has it been tested on? An AI model optimized on crypto 1-hour charts may not generalize to forex daily charts or index futures. Ask for evidence of multi-market, multi-timeframe testing.
5. Is there independent verification of the performance claims? Backtest results shown by the seller should be treated with skepticism — they may have been conducted using the same data the model was trained on (in-sample testing), which produces optimistic results that don’t hold out-of-sample. Independent third-party testing or community verification is more valuable.
6. Is there a free way to test signal quality before subscribing? A seller confident in their AI indicator’s live performance should let you verify it without much risk. Quantzee’s non-repainting architecture lets you run this test in live conditions before deciding on the full suite.
7. Does performance vary by market regime? Ask the seller: “How does this indicator perform in sideways/ranging markets compared to trending markets?” A genuinely AI-adaptive indicator should have an answer — regime detection is one of its core capabilities. If the answer is “it works great in all conditions” without further detail, that is a marketing claim rather than a technical one. Test it yourself across a recent trending period and a recent range-bound period on TradingView’s Replay function — the regime-specific performance difference will be visible in your own testing within a few hours.
8. Is the AI component the primary signal, or a marketing label? Some products add “AI” to the marketing copy for an indicator whose core signal is generated by a standard formula (RSI, MACD, SuperTrend) with no meaningful adaptive component. The test: disable the “AI” component (if configurable) and observe how the signals change. If they don’t change, the “AI” is labeling, not functionality. If they change meaningfully — different signal timing, different parameter behavior in different conditions — the AI component is doing real work.
AI Indicators for Specific Trading Styles
For scalpers (1–5 min charts): AI pattern recognition excels at identifying high-probability scalp setups because it can process complex multi-variable conditions too fast for manual analysis. The AI Adaptive Quant Toolkit adapts its parameters to the low timeframe environment automatically, reducing the whipsaw signals that plague static indicators on 1-minute charts. The key advantage for scalpers is ATR-adaptive stop placement — on 1-minute charts, volatility fluctuates significantly within single trading sessions, and static ATR-multiplier stops either get hunted (too tight) or reduce R:R below viability (too wide). Adaptive stops respond to the current 1-minute ATR distribution, maintaining viable risk-reward regardless of intrabar volatility spikes.
For swing traders (daily charts): AI TrendPulse provides multi-timeframe trend classification that’s particularly valuable for swing traders who need to align with higher-timeframe trend direction before entering positions. The pattern recognition component identifies trend continuation setups that align with the broader market structure. For swing traders specifically, the regime detection capability matters most — a swing system that stays long through a 2-week trending period but exits or hedges when the daily chart regime shifts to ranging significantly outperforms one that holds through the entire drawdown.
For options traders: AI-based range estimation is more valuable than static ATR ranges for options sellers defining their expected move boundaries. For options traders specifically, the integration of CPR — the dominant framework for index options day planning — with adaptive range estimation provides a uniquely useful combination for selecting expiry-day strike levels.
For index traders (major indices): The adaptive approach is particularly valuable for global indices, which cycle through pronounced trending and ranging phases within single trading sessions. An index session can open in gap-trend continuation mode, transition to a range-bound CPR test mid-morning, then break into a trend again on a central-bank headline later in the session. SuperTrend Pro+, with its dual-SuperTrend confluence and AI-enhanced volatility adjustment, handles these intraday regime transitions significantly better than the standard SuperTrend formula — because it recalibrates to each regime rather than applying the same parameters across all three phases.
For crypto traders (24/7 markets): Crypto markets present a specific challenge for AI indicators: no session boundaries means no VWAP reset, no CPR recalculation reference, and the potential for high-volatility moves at any hour of the day or night. AI adaptive signals that continuously recalibrate to the current volatility distribution — rather than relying on session-based calculations — are inherently better suited to 24/7 markets. The AI Adaptive Quant Toolkit’s market-agnostic adaptive architecture means its parameters recalibrate to Bitcoin’s overnight moves just as effectively as it handles a the index intraday session.
Try the Best AI Indicators for TradingView Yourself
🚀 Ready to see genuine AI adaptation on your own chart?
Quantzee's full 6-indicator AI suite — including the AI Adaptive Quant Toolkit, SuperTrend Pro+, and the Adaptive AI Oscillation Engine — is non-repainting, independently verifiable via Bar Replay, and costs one payment of $59.99.
- AI Adaptive Quant Toolkit — self-tuning signals, overlays & dashboard — no repainting
- SuperTrend Pro+ — dual-SuperTrend confluence trend signals
- Adaptive AI Oscillation Engine — momentum & divergence detection
View all indicators · See pricing