There is a silent killer lurking inside many of the most popular TradingView indicators. It’s called repainting — and if you’re using a repainting indicator without knowing it, your entire backtesting methodology is based on a lie.
This guide covers everything a trader needs to know about repainting: what it is, why it happens, how to test for it, and which indicators you can actually trust in 2026. If you’re making decisions based on an indicator’s historical performance, this is the most important article you’ll read this year.
⚡ Key Takeaways
- Repainting silently corrupts backtesting — signals on a completed chart never existed in real time, producing win rates above 80% that are mathematically impossible to replicate in live markets
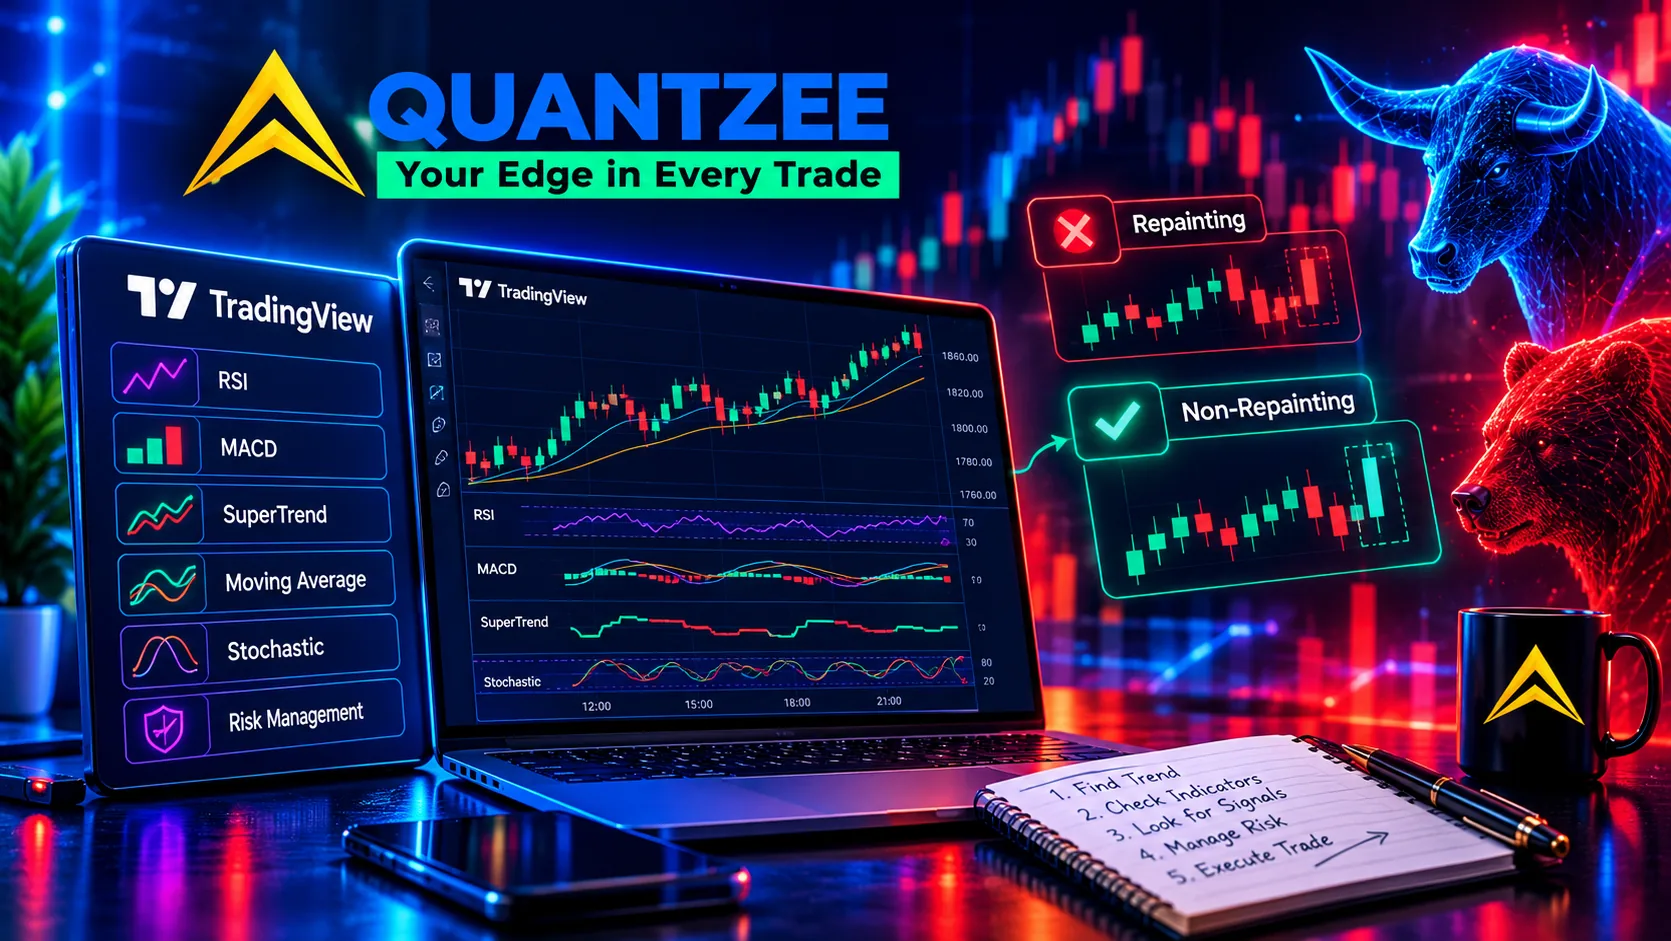
- Three types of repainting: future data leakage (most damaging — indicator reads bars that had not yet formed), bar confirmation issues (signals shift before candle close), and adaptive lookback changes (ML models recalculating historical values on each new bar)
- Three-test method in 5 minutes: Bar Replay (step forward one bar at a time and compare), Historical Screenshot Comparison (same chart revisited 3–5 days later), and Pine Script Code Review (look for
lookahead_onor reads on unconfirmed bars) - TradingView's built-in indicators (RSI, MACD, VWAP, EMA, Bollinger Bands, Supertrend) are naturally non-repainting — the risk is in multi-timeframe wrappers and AI scripts that use lookahead bias
- Quantzee's 6 indicators all use bar-close-only signal generation with locked historical values — verifiable via Bar Replay
Already know what repainting is and want to run a full Strategy Tester backtest? See our complete guide: How to Backtest Any TradingView Indicator.
What Is Repainting?
Repainting occurs when a TradingView indicator changes its historical values — its past signals, lines, or labels — after new bars or data arrive. TradingView documents the underlying mechanics in its Pine Script repainting guide, which is the authoritative reference on how and why scripts repaint.
In simple terms: a repainting indicator shows you what the signal would look like if the indicator already knew what happened next. When you look at a chart with historical signals plotted, the signals appear in perfect positions — always near bottoms for buys, always near tops for sells. This looks extraordinary in backtesting. The problem is that those signals didn’t actually exist at the moment they claim to have been generated.
To understand this concretely: imagine an indicator that generates a “buy” signal at the low of a candle. When you look at the completed chart, the signal appears at the exact bottom. But when the candle was actually forming — bar open through bar close — the signal was positioned differently, or didn’t exist at all. Only after the bar closed (and subsequent bars confirmed the direction) did the indicator retroactively place the signal at the “correct” position.
The result: backtesting shows a win rate of 80%+. Live trading produces losses. The trader is confused. The indicator was always the problem.
Why Repainting Is Dangerous for Traders
The damage from repainting extends well beyond annoyance — it systematically corrupts decision-making at multiple levels.
1. Backtesting results are meaningless When you evaluate an indicator’s performance by looking at its historical signals, you assume those signals were generated at the time they appear. A repainting indicator violates this assumption completely. An indicator might show 200 winning trades in a three-year backtest — but if those signals were adjusted retrospectively, none of that historical performance data is real.
2. False confidence leads to larger position sizes Traders who backtest a repainting indicator and see strong results will naturally increase their confidence and position sizes. When the indicator performs poorly live (because it no longer has future data to repaint against), the losses are compounded by the elevated position sizing that the false backtest results encouraged.
3. Strategy development is corrupted Traders build entire systematic strategies around indicator signals — entry rules, exit rules, stop-loss levels. If those signals are based on repainting data, the entire strategy architecture is built on a false foundation.
4. It’s difficult to detect without specific testing Most traders never specifically test for repainting. They evaluate an indicator by looking at its chart. But a repainting indicator’s chart always looks good — that’s the entire problem. Without active testing methodology, repainting indicators can be used for years before the trader understands why their live results never match their backtesting.
How Repainting Actually Happens: Three Types
Not all repainting is intentional or malicious — some forms are architectural decisions that have unintended consequences. Understanding the types helps you identify risk.
Type 1: Future Data Leakage (Lookahead Bias)
This is the most damaging form. The indicator uses data from future bars (candles that haven’t closed yet, or bars that occur after the signal bar) to calculate the current signal.
In Pine Script (TradingView’s programming language), this happens when developers use the security() function with lookahead = barmerge.lookahead_on, or when they reference series values without proper bar confirmation. The indicator “knows” what happens next because it’s literally reading future data.
Example: An indicator signals a buy on bar 100 using price data from bar 102. On the completed chart, this looks like a perfectly timed entry. But at the time bar 100 was forming, bar 102 didn’t exist yet.
Type 2: Bar Confirmation Issues
This type occurs when signals are generated during a bar that hasn’t closed yet. The indicator shows a buy signal on the current in-progress bar — but that signal can change multiple times as the bar continues to form, only locking into its final position when the bar closes.
This is technically more honest than Type 1, because the signal is generated using real-time data. But it means signals you see while a bar is open may not be the signals you see after it closes. Strategies that enter on “current bar signals” before bar close are particularly vulnerable.
Type 3: Adaptive Calculation Lookback Changes
Some indicators use dynamic lookback periods that change as new data arrives. When new bars are added, the calculation window shifts, which can cause the entire series of historical values to be recalculated — changing the historical signal positions.
This is particularly common in machine learning-based indicators that use rolling windows for training. The model retrained on today’s data may produce different signals for last month’s bars than the model trained on last month’s data would have generated at that time.
How to Test If a TradingView Indicator Repaints
There are three reliable methods to test for repainting. Use at least two before trusting any indicator with real capital.
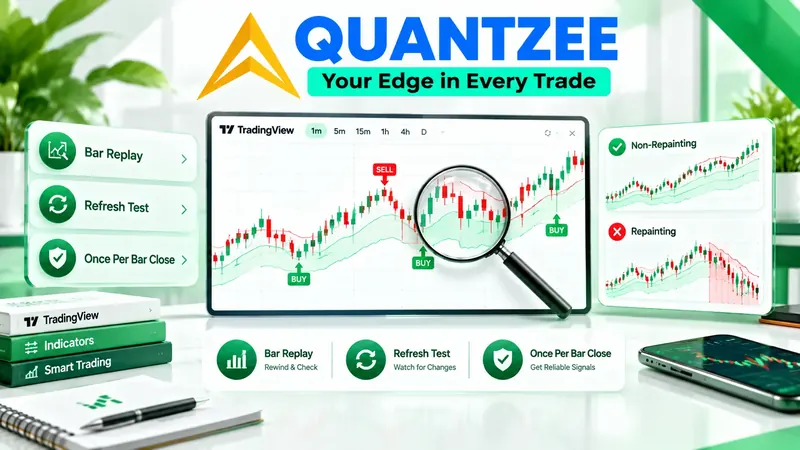
Method 1: TradingView Replay Mode
- Add the indicator to your chart
- Screenshot or note the current signal positions on the last 20–30 bars
- Click the Replay button in TradingView’s toolbar (the triangle/play button near the date) — see TradingView’s Bar Replay documentation for the exact controls
- Set the replay start point to 10–15 bars before the area you’re testing
- Step forward bar by bar
- Compare what the signals looked like bar-by-bar versus what they look like on the completed chart
If signals change position or appear/disappear as you step forward, the indicator is repainting.
Method 2: Historical Screenshot Comparison
- Take a detailed screenshot of your chart with the indicator applied, noting exact signal positions on specific bars
- Return to the same chart 2–5 days later
- Compare the signal positions on those same historical bars
If any signals have moved, new signals have appeared on bars that previously showed no signal, or old signals have disappeared — the indicator is repainting.
Method 3: Pine Script Code Review
If you have access to an indicator’s Pine Script source code, look for these red flags:
security()function calls withlookahead = barmerge.lookahead_on- References to
close(current bar close) without[1]bar referencing to ensure bar confirmation request.security()calls that may leak future data
Non-repainting Pine Script will typically include comments explicitly noting bar confirmation, and all signals will be calculated using closed bar data (close[0] after bar close, or close[1] to reference the previous bar).
| Indicator | Repainting Status | Evidence | Price |
|---|---|---|---|
| Quantzee (all 6 indicators) | ✅ Non-repainting | Signal-lock architecture; signals fix at candle open; Pine source supplied so you can verify it | $59.99 once |
| EMA / SMA (built-in) | ✅ Non-repainting | Does not change historical values | Free |
| VWAP (built-in) | ✅ Non-repainting | Resets each session by design | Free |
| RSI (built-in) | ✅ Non-repainting | Standard implementation; no future data | Free |
| LuxAlgo | ⚠️ Mixed reports | User reports of repainting on some modes (Reddit, Sitejabber) | $54+/mo |
| Market Cipher | ⚠️ Mixed reports | Some signals confirm only on candle close | $600/yr |
| VuManChu Cipher | ⚠️ Conditional | Free version repaints on certain settings | Free |
| Generic AI scripts | ❌ High risk | Many use lookahead bias in Pine Script | Free |
Best Non-Repainting TradingView Indicators in 2026
Non-repainting behavior is especially critical for buy/sell signal indicators on TradingView — the arrow-based tools that visually mark entry and exit points directly on the chart. A repainting buy/sell indicator is the most dangerous category because the entry signal that disappears is the exact signal you used to place a live trade.
Quantzee — The Non-Repainting Standard
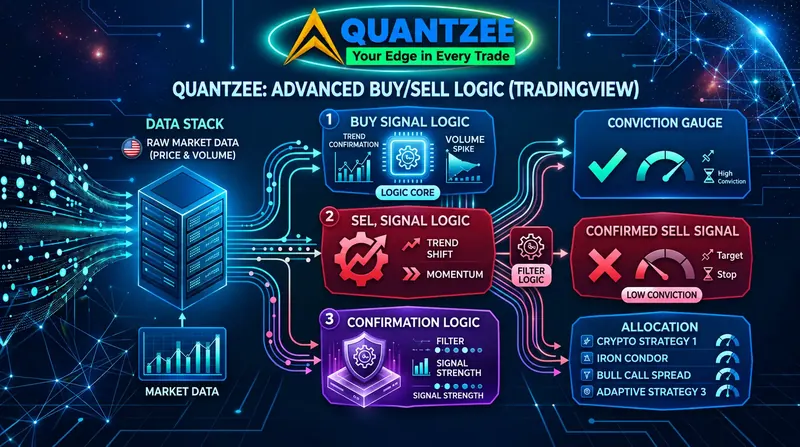
Quantzee built its entire AI trading indicator suite philosophy around non-repainting signals. Every indicator in the suite — the AI Adaptive Quant Toolkit, Adaptive AI Oscillation Engine, AI TrendPulse, SuperTrend Pro+, MACD Pro+, and SMC Toolkit Pro — uses a signal-locking architecture that generates signals exclusively on bar close and freezes them permanently. MACD Pro+‘s divergence pivots confirm a fixed number of bars after they form and never repaint once printed — just like the Adaptive AI Oscillation Engine’s pivot-confirmed divergences and SuperTrend Pro+‘s confirmed-close trade-level ladder.
The technical implementation: all Quantzee signals are calculated only after bar confirmation (the bar has closed and will never change). The signal value is then stored in a series variable that references the confirmed close. No future bar data is used in any calculation. The result is that every signal you see on a historical Quantzee chart was exactly the signal that existed at that moment in time — no retroactive repositioning, no disappearing entries.
This commitment to non-repainting is a core part of Quantzee’s product promise, and it’s verifiable using the replay method described above.
“Non-repainting signals and adaptive trend logic helped filter bad trades in forex.” — Jason Smith ⭐⭐⭐⭐⭐
TradingView Built-In Indicators
The built-in TradingView indicators — VWAP, RSI, MACD, EMA, Bollinger Bands, SuperTrend — do not repaint. They calculate values using standard formulas on completed bar data. Their signals are less sophisticated than AI-powered tools, but their historical values are reliable.
The standard SuperTrend, for example, generates its signal based on ATR calculated from completed candles, and the signal direction is locked once the bar closes. You can trust its historical signals in backtesting.
What to Look For in Non-Repainting Indicators
When evaluating any indicator’s non-repainting claim:
- Does the seller explicitly guarantee non-repainting with a technical explanation, or just use marketing language?
- Is there a money-back guarantee you can rely on if the indicator repaints?
- Can you access the source code to verify, or is it protected?
- Is there community evidence (YouTube tests, forum discussions) of the indicator being tested for repainting?
You can verify Quantzee’s non-repainting claim yourself using Bar Replay before you ever need to rely on anyone’s word for it.
How Quantzee Guarantees Non-Repainting: Technical Explanation
Understanding how Quantzee enforces non-repainting helps explain why the guarantee is credible.
All signal generation in the Quantzee suite follows a strict bar-close-only protocol:
Step 1: Data collection
Indicator calculations only read data from confirmed closed bars. No close values from in-progress bars are used in signal generation logic.
Step 2: Signal generation After a bar closes, the signal calculation runs once using the closed bar’s data. The result is written to a signal series.
Step 3: Signal locking Once written, the signal value for a given bar is never recalculated or overwritten. The historical series is write-once.
Step 4: Display The chart displays the locked signal values from the series. Because these values never change after being written, the chart presentation matches the signals as they existed at the time they were generated.
This is fundamentally different from indicators that continuously recalculate their entire series on every new bar — which is what allows repainting to occur.
Red Flags in Indicator Marketing Claims
Be skeptical of these common phrases used to obscure repainting behavior:
“Real-time signals” — This often means signals are generated on bars that are still open, meaning they can change before bar close. Ask specifically: “Are signals generated on bar close?”
“AI-powered accuracy” — AI by itself says nothing about repainting. An AI model trained on lookahead data will repaint as aggressively as any static indicator.
“85%+ win rate on backtest” — Always ask: was this backtest tested for lookahead bias? Extremely high backtest win rates are a warning sign, not a selling point.
“Signals appear instantly” — Signals that appear the moment a trend starts are almost certainly using future data. Real non-repainting signals confirm trends after they’ve begun (one bar of confirmation delay is normal and expected).
“No redrawing” — “No redrawing” (cosmetic changes to the indicator display) is different from “no repainting” (changes to historical signal values). Some sellers use these terms interchangeably when they shouldn’t.
Explore Quantzee Indicators
- MACD Pro+ — grades every cross Strong or Weak via an adaptive chop zone, plus a divergence engine & MTF dashboard — non-repainting
- SuperTrend Pro+ — dual-SuperTrend confluence with an automatic ATR Entry/TP/SL ladder
- SMC Toolkit Pro — complete Smart Money Concepts overlay: BOS/CHoCH structure, auto order blocks & FVGs, liquidity sweeps & OTE — non-repainting on confirmed bars
- AI Adaptive Quant Toolkit — self-tuning signals, overlays & dashboard — no repainting
- AI TrendPulse — adaptive EMA trend detection & reversal alerts — non-repainting
- Adaptive AI Oscillation Engine — momentum & divergence detection
View all indicators · See pricing