Bollinger Bands Pro+
Squeeze + Breakout Bias + %B Divergence.
Classic bands, four pro layers — squeeze, bias, mode and divergence in one.
Bollinger Bands Pro+ upgrades the classic bands with the four things BB traders constantly bolt on from separate indicators: volatility squeeze detection with a duration counter, a momentum-based breakout direction bias, an automatic Trend/Reversion market-mode classifier, and %B divergence detection — plus a multi-timeframe squeeze dashboard.
The bands themselves are standard Bollinger Bands; Pro+ adds Keltner-based squeeze detection that counts compression duration, a breakout-side bias at release, a mode classifier so you stop fading band-walks, and a pivot-based %B divergence engine.
14-day money-back guarantee · Invite-only access granted on subscription
The Core Concept
Bollinger Bands That Tell You When, Which Way, and What Mode
Standard Bollinger Bands show volatility but leave three questions open: when is compression about to release, which way will it break, and is this a trend or a reversion market? Pro+ answers all three — a Keltner-based squeeze with a duration counter for when, a momentum bias that prints a side at release for which way, and a %B-driven Trend/Reversion classifier for what mode.
A pivot-based %B divergence engine and a five-timeframe squeeze dashboard turn the classic bands into a complete volatility-breakout system.
New to the concept? Read our glossary explainer on Bollinger Bands and the squeeze. For the underlying theory, see Investopedia on Bollinger Bands and on Keltner Channels, the two envelopes whose overlap defines the squeeze.
4+1
Tools in One
Squeeze + duration, breakout bias, Trend/Reversion classifier and %B divergence — plus an MTF squeeze dashboard.
Bias
At Release
A momentum read projects the likely breakout side at the moment the squeeze releases — not after the move.
No
Repainting
Squeeze and breakout signals use completed-bar values; divergence pivots confirm and never repaint once printed.
Key Features
Everything Bollinger Bands Should Be
Squeeze detection with duration, a breakout-direction bias, a Trend/Reversion classifier, a %B divergence engine and a multi-timeframe squeeze dashboard — fused into one indicator.
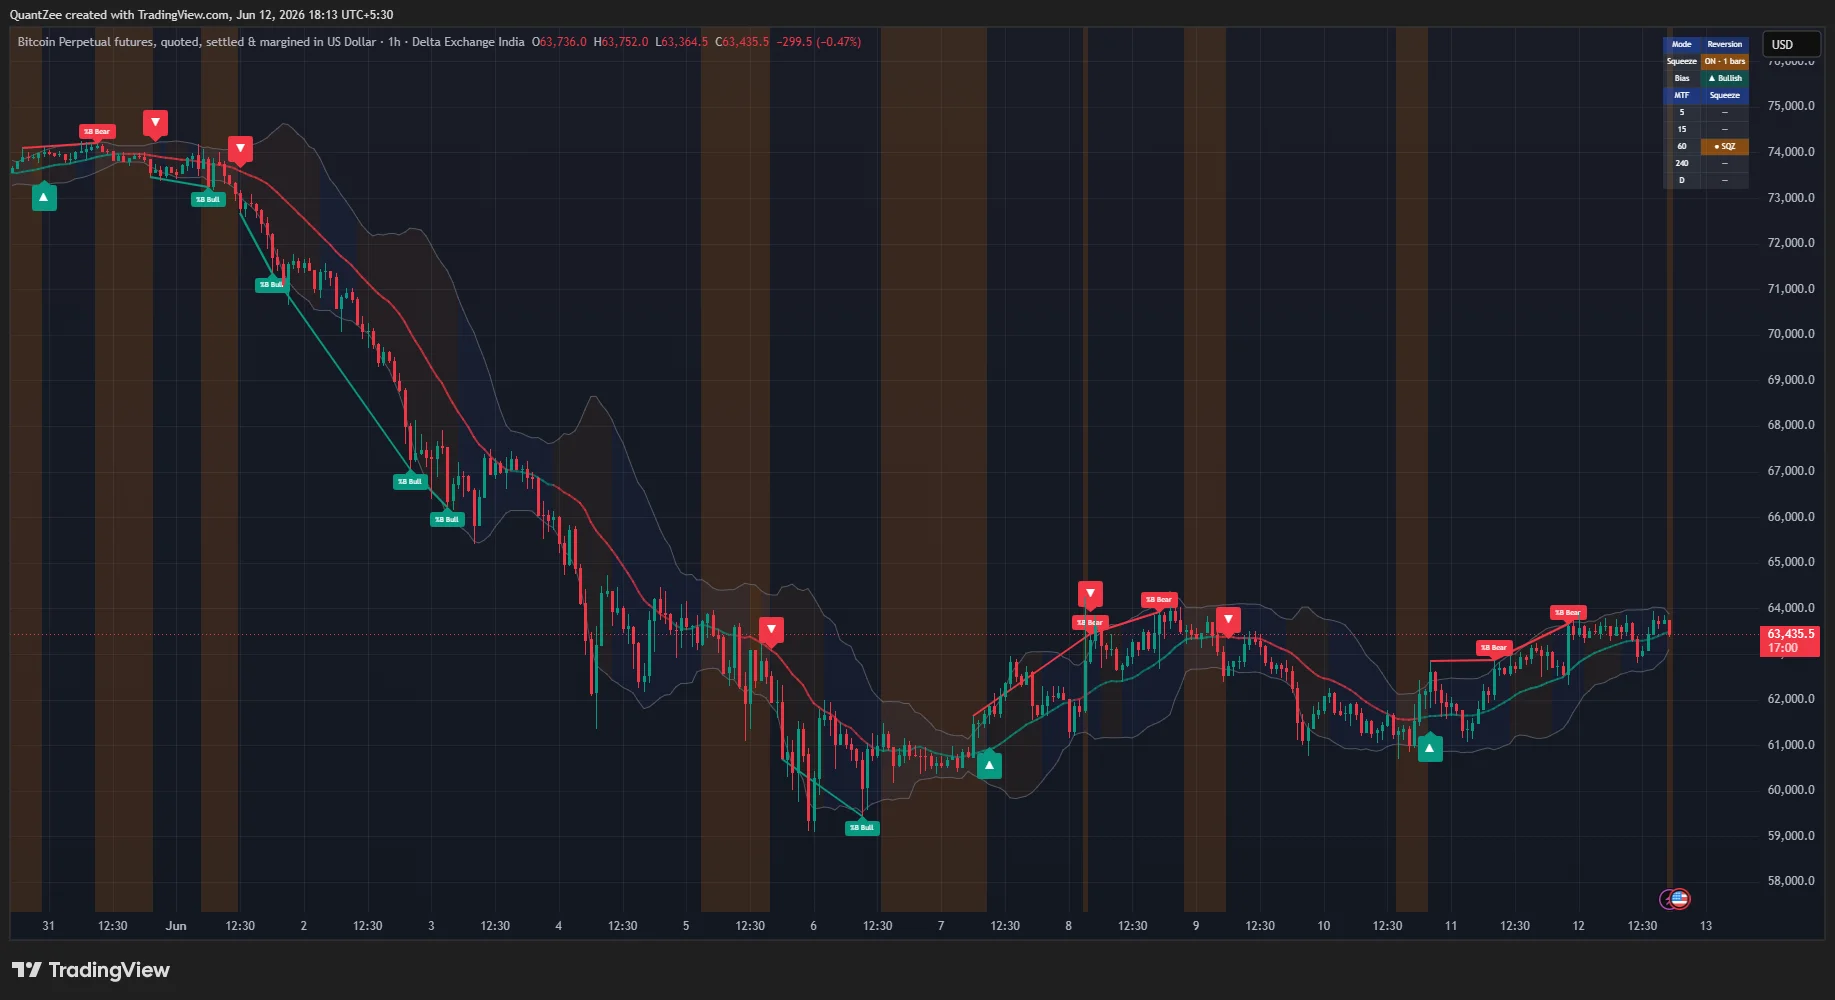
Squeeze Detection with Duration Counter
A squeeze is flagged when the Bollinger Bands contract inside a Keltner Channel (EMA ± ATR multiple) — the classic compression definition — and the chart background highlights it. The dashboard additionally counts how many bars the current squeeze has lasted: a compression exceeding 15–20 bars on a 4H chart frequently precedes a significant expansion, and knowing that count lets you tighten entry criteria as the coil builds rather than entering too early on a fresh, shallow squeeze.
Breakout Direction Bias
A momentum reading (linear regression of price against a blend of its mid-range and mean) is computed continuously. During a squeeze the dashboard shows the current bias; on the bar the squeeze releases, a directional ▲/▼ signal prints according to that momentum — giving you the projected breakout side at the moment of release rather than waiting for an extended move.
Trend / Reversion Mode Classifier
The script monitors %B and labels the market "Trend" mode when price is band-walking on either side — %B above 0.8 (an up-walk, "Trend ▲") or below 0.2 (a down-walk, "Trend ▼") for at least a threshold number of bars inside a recent window — and "Reversion" mode otherwise. The band fill color changes with the mode. This addresses the single most common Bollinger mistake: fading band touches during a band-walk.
%B Divergence Engine
Pivot-based detection of bullish divergences (price lower low, %B higher low) and bearish divergences (price higher high, %B lower high), drawn directly on the price chart with connecting lines and labels. %B divergences capture cases where price makes a new extreme but with less penetration of the bands — a weakening move.
Multi-Timeframe Squeeze Dashboard
The panel shows which of five user-selected timeframes are currently in a squeeze. Simultaneous compression across multiple timeframes — a "stacked squeeze" — marks the highest-energy pre-breakout conditions.
Non-Repainting by Design
Squeeze states and breakout signals are evaluated from completed-bar values; divergence pivots confirm a set number of bars after the pivot forms (configurable, default 5) and never repaint once printed. Multi-timeframe data is requested with lookahead off. For alerts, "Once per bar close" is the recommended trigger.
How To Use It
Reading the Signals
- Wait for compression. Wait for the background squeeze highlight; the longer the bar counter runs, the more significant the eventual expansion tends to be.
- Read the bias. Check the Bias row while the squeeze is on — it is the script's current read of the likely breakout side. The printed ▲/▼ signal on release is the confirmation.
- Respect the mode. In Reversion mode band touches are mean-reversion candidates; in Trend mode they are continuation behavior — do not fade them.
- Use divergences in context. %B divergences are most useful in Reversion mode and near squeeze extremes; a bearish %B divergence during an upward band-walk is an early caution, not an automatic short. Use the MTF dashboard to find stacked squeezes.
What You Can Achieve
From Bands to a Breakout Plan
Trade the Compression
Wait for the background squeeze highlight; the longer the bar counter runs, the more significant the eventual expansion tends to be.
Anticipate the Breakout Side
Check the Bias row while the squeeze is on — it is the script's current read of the likely breakout side; the printed ▲/▼ on release is the confirmation.
Stop Fading Band-Walks
Respect the Mode row: in Reversion mode band touches are mean-reversion candidates; in Trend mode they are continuation — do not fade them.
Stack Your Timeframes
Use the MTF dashboard to find stacked squeezes: when your trading timeframe and one or two higher timeframes compress simultaneously, releases tend to travel further.
Who It's For
Built for Volatility Traders
Whether you trade squeeze breakouts or fade band touches in range, Bollinger Bands Pro+ adapts to your chart — the mode classifier tells you which game you're in, and the MTF dashboard finds the stacked squeezes worth waiting for.
Breakout Traders
Volatility & Squeeze Traders
Mean-Reversion Traders
Alerts
Seven Alert Conditions
Squeeze started, bullish squeeze release, bearish squeeze release, trend mode up, trend mode down, bullish %B divergence, and bearish %B divergence. Route them to email, mobile push, or webhooks — and use "Once per bar close" for confirmed, non-repainting triggers.
FAQ
Common Questions
What is Bollinger Bands Pro+?
Bollinger Bands Pro+ upgrades the classic bands with the four things BB traders constantly bolt on from separate indicators: volatility squeeze detection with a duration counter, a momentum-based breakout direction bias, an automatic Trend/Reversion market-mode classifier, and %B divergence detection — plus a multi-timeframe squeeze dashboard.
How is it different from standard Bollinger Bands?
The bands themselves are standard Bollinger Bands (SMA basis ± standard deviations). Pro+ adds squeeze detection with a bar-duration counter, a breakout direction bias computed from momentum, a Trend/Reversion mode classifier driven by %B band-walking, a pivot-based %B divergence engine, and a five-timeframe squeeze dashboard.
How does the squeeze detection work?
A squeeze is flagged when the Bollinger Bands contract inside a Keltner Channel (EMA ± ATR multiple) — the classic compression definition — and the background highlights it. The dashboard also counts how many bars the current squeeze has lasted, since longer compressions tend to precede larger expansions.
What is the breakout direction bias?
A momentum reading (linear regression of price against a blend of its mid-range and mean) is computed continuously. During a squeeze the dashboard shows the bias; on the bar the squeeze releases, a directional ▲/▼ signal prints according to that momentum — projecting the breakout side at release. It is a momentum read, not a prediction guarantee.
What does the Trend / Reversion mode do?
The script monitors %B and labels the market "Trend" mode when price is band-walking on either side — %B above 0.8 (up-walk) or below 0.2 (down-walk) for at least a threshold number of bars inside a recent window (defaults: 5 of the last 8 bars) — and "Reversion" mode otherwise, changing the band fill color. In Trend mode a band touch is continuation behavior, not a reversal setup — which avoids the most common Bollinger mistake.
Do the signals repaint?
No. Squeeze states and breakout signals are evaluated from completed-bar values; divergence pivots confirm a set number of bars after the pivot forms (default 5) and never repaint once printed. Multi-timeframe data is requested with lookahead off. Use "Once per bar close" for alerts.
Which markets and timeframes does it work on?
All symbols and all timeframes — stocks, indices, futures, forex, and crypto.
Is it a complete trading system?
No. Bollinger Bands Pro+ is a technical analysis tool, not financial advice and not a complete trading system. The breakout bias is a momentum read, not a guarantee. Always apply your own risk management.
14-Day Money-Back Guarantee
Get Invite-Only Access to Bollinger Bands Pro+
One subscription unlocks all 13 Quantzee indicators, real-time alerts, and multi-market access.