Not another 70/30 crossover script. Twelve real TradingView charts — Bitcoin, Gold, Silver — showing exactly what fires a Buy or Sell tag, and why.
RSI Pro+ is not a single line with two flat threshold levels. It is three RSI-based tools running in one pane: an adaptive overbought/oversold band system that moves with the market instead of sitting fixed at 70/30, an automatic divergence engine that draws regular and hidden divergences the moment a confirmed pivot forms, and a five-timeframe RSI dashboard that shows you whether the higher timeframes agree before you act.
This page shows the mechanism, not a performance claim. Every chart below is a real, unedited TradingView RSI Pro+ panel — on Bitcoin, Gold, and Silver — with the Buy/Sell tags the indicator actually printed, and a walkthrough of the exact rule that fired.
Traders normally stack three separate scripts to get this: a divergence scanner, an adaptive-threshold RSI, and a multi-timeframe momentum table. RSI Pro+ combines them:
Layer
What it replaces
What it adds
Adaptive OB/OS bands
Fixed 70/30 lines
Rolling-percentile bands that widen/narrow with the market's own recent RSI distribution
Divergence engine
Manual trendline-drawing
Automatic regular + hidden divergence detection with alert triggers
MTF dashboard
Switching charts to check higher-timeframe RSI
A live table of RSI + status across 5 timeframes in the same pane
The underlying oscillator is Wilder's classic 14-period RSI on closing price — nothing exotic there. What changes is everything built on top of it.
How Signals Are Generated
The Three Mechanisms, In Order
1. Adaptive OB/OS Bands (the foundation)
Instead of drawing a flat line at 70 and 30, RSI Pro+ computes the overbought level as the 90th percentile and the oversold level as the 10th percentile of the RSI's own trailing 200-bar distribution (both are user-configurable). In a strong uptrend the whole RSI distribution sits higher, so the adaptive overbought line rises with it — RSI can no longer camp "overbought" for an entire trend the way it does against a fixed 70. In a downtrend the oversold band falls the same way.
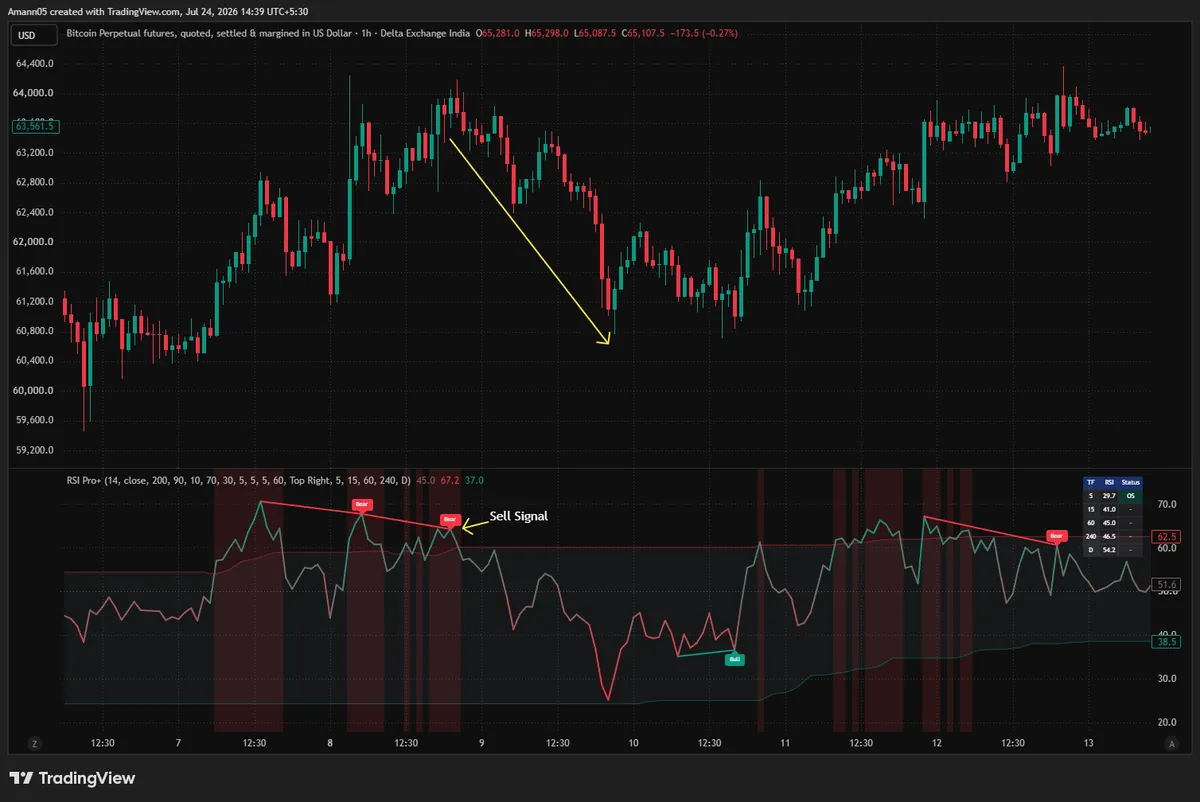
You can see this directly in the BTCUSD.P chart (07-24 14:39 capture): the green (oversold) band visibly climbs from roughly 20 to 38 over the course of the chart as the market's RSI regime shifts. That slope is the adaptive mechanism working in real time, not a static setting.
A background shade (dark red above the adaptive OB line, dark teal below the adaptive OS line) marks every bar where RSI is actually beyond its own adaptive threshold — so exhaustion zones are visible without reading the raw number.
2. The Divergence Engine (what triggers Buy/Sell tags)
This is the layer that prints the "Bull" and "Bear" tags you see on every chart below. It works off confirmed pivots in the RSI line — a high or low is only confirmed once a fixed number of bars (default: 5) has passed on either side of it, which is also why the tool does not repaint: once a pivot is confirmed and a tag/line is drawn, it stays.
Regular bearish divergence (→ red "Bear" tag): price makes a higher high while RSI makes a lower high. Flags potential exhaustion of an up-move. This is what fires most of the "Sell Signal" tags across the screenshots below.
Regular bullish divergence (→ green "Bull" tag): price makes a lower low while RSI makes a higher low. Flags potential exhaustion of a down-move.
Hidden divergence (off by default): the mirror-image pattern that signals trend continuation rather than reversal — most useful read alongside the MTF dashboard's higher-timeframe trend.
Each divergence type has its own alert condition (six in total: regular bull, regular bear, hidden bull, hidden bear, RSI exiting overbought, RSI exiting oversold), so alerts fire on the confirmed event, not on a raw threshold cross.
3. The Multi-Timeframe Dashboard (the filter)
A small table in the top-right of the pane — visible on every screenshot below — reads: TF | RSI | Status, one row each for 5, 15, 60, 240-minute and Daily. "Status" flags OS (oversold) or OB (overbought) only when that timeframe's own RSI is beyond its adaptive band; otherwise it shows -.
The intended use, straight from the product's own documentation: skip a bearish divergence tag on a 5-minute chart if the 1-hour and 4-hour RSI are both rising and nowhere near overbought — i.e., use the table to avoid taking a reversal signal against a stronger higher-timeframe trend.
Putting It Together
A signal on RSI Pro+ is not "RSI crossed 30." It is: a pivot-confirmed divergence formed (mechanism 2), optionally near/at an adaptive exhaustion band (mechanism 1), checked against higher-timeframe RSI direction in the dashboard (mechanism 3). The screenshots below show this full sequence on real charts across three different instruments.
Screenshot Walkthroughs
Twelve Real Charts, One Mechanism at a Time
About the yellow arrows and "Buy Signal" / "Sell Signal" labels
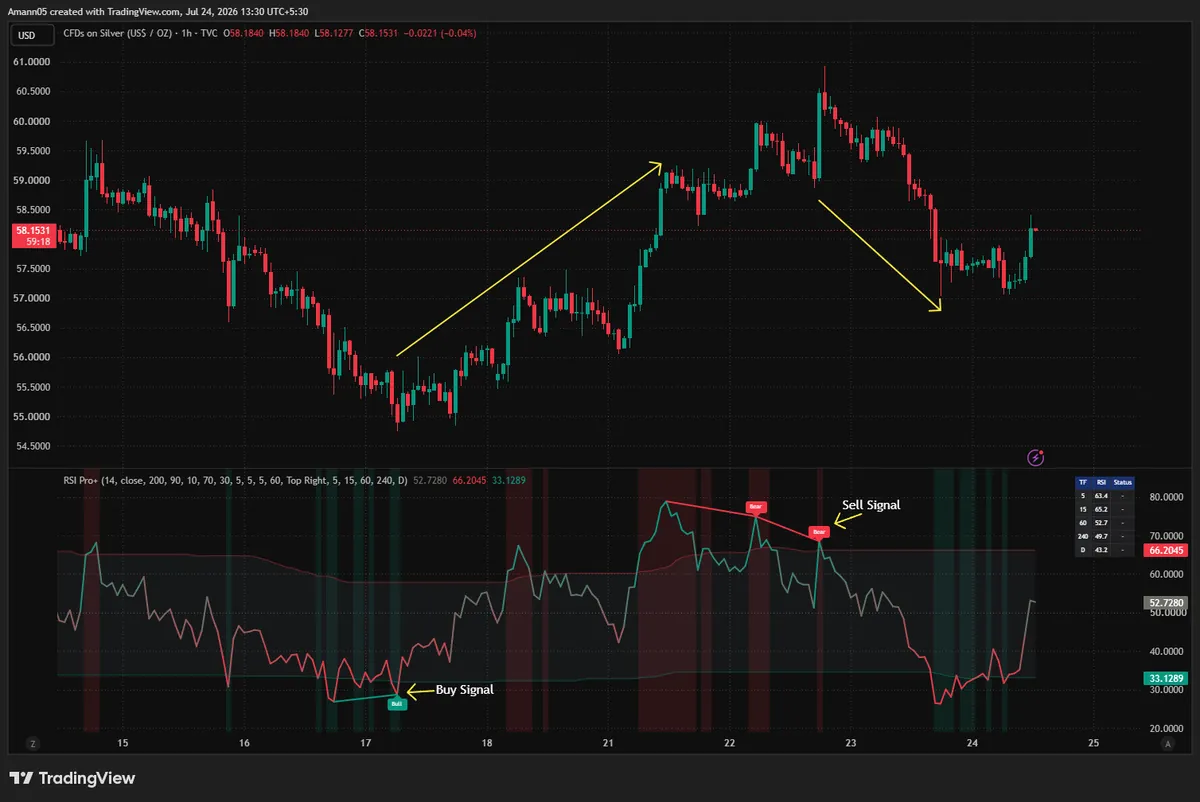
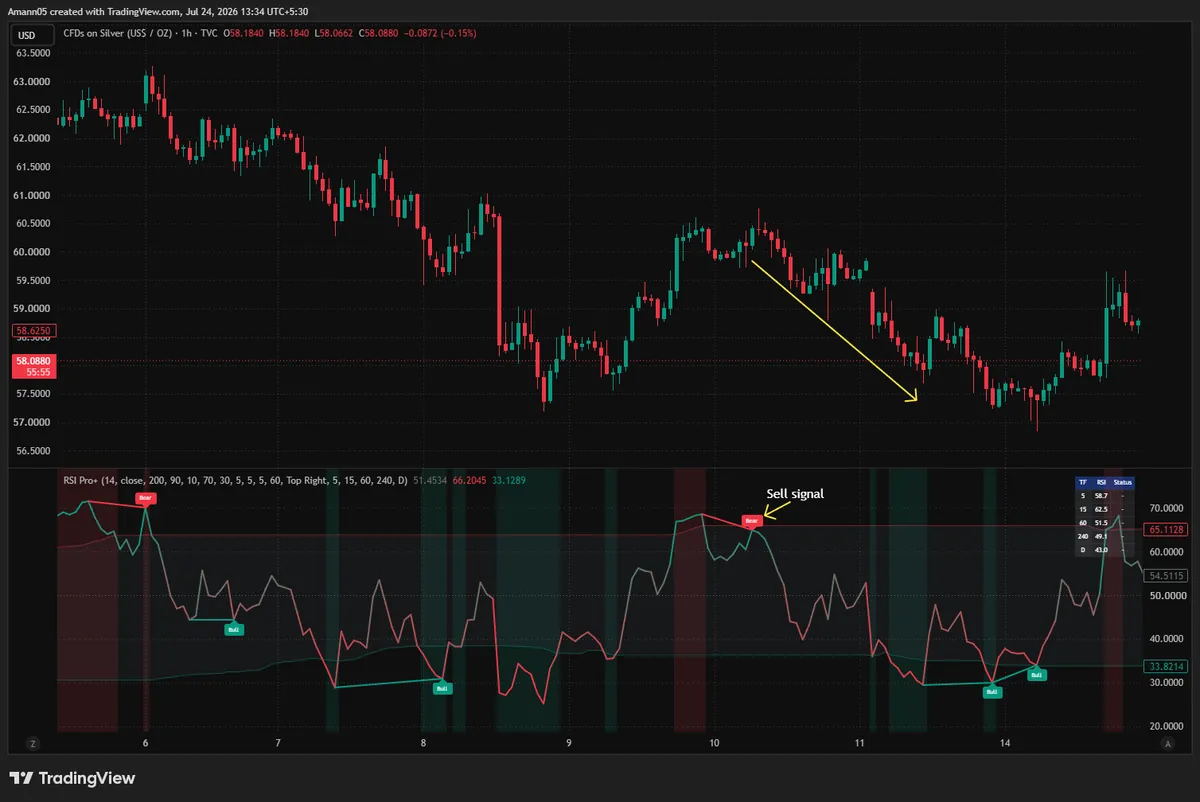
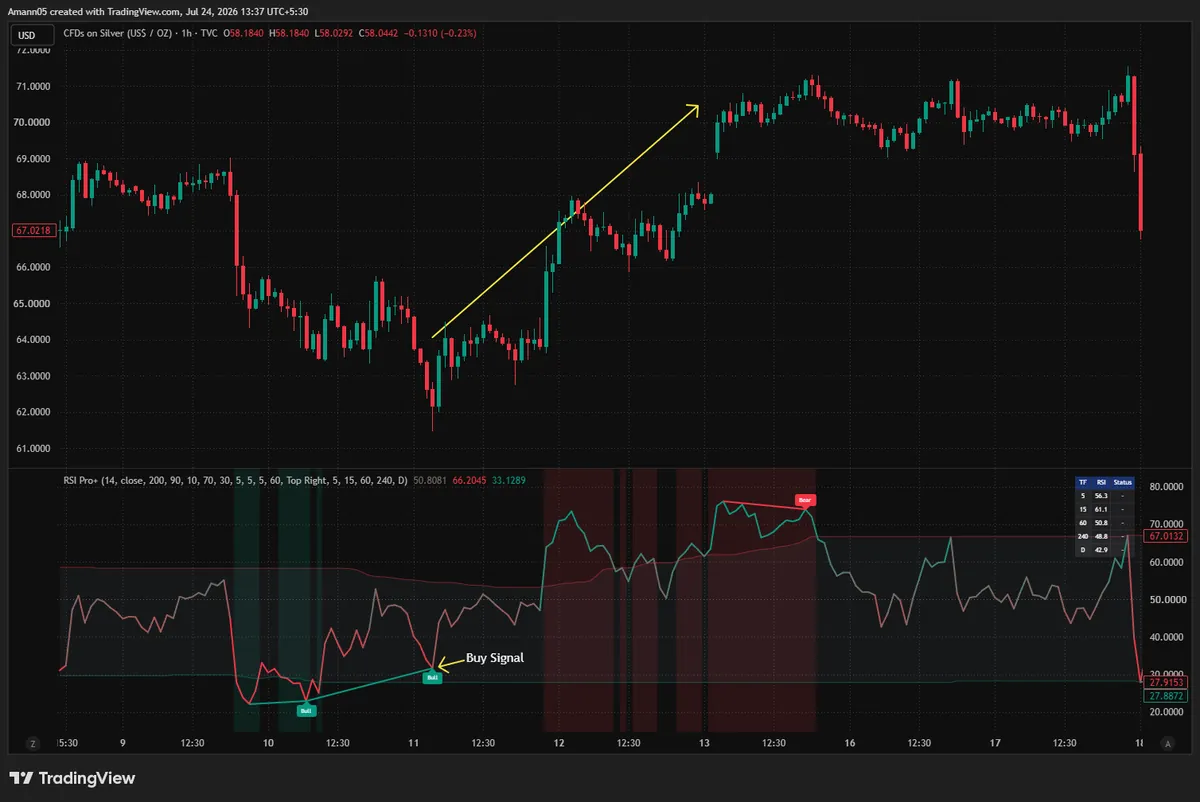
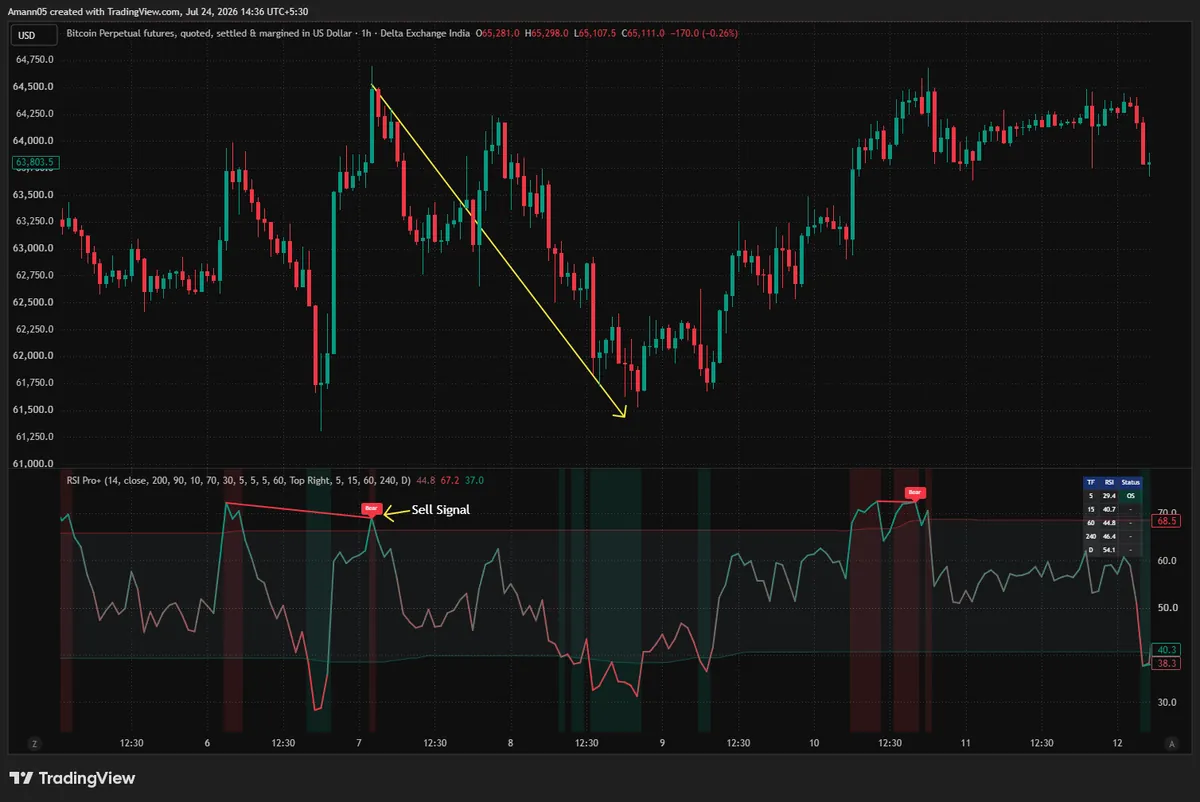
The yellow arrows and the "Buy Signal" / "Sell Signal" text you see on these charts are manual annotations added by us for teaching purposes, drawn on top of real, unedited TradingView captures. They mark the price move that followed a signal so you can see cause → effect at a glance. They are not part of the indicator's own output — RSI Pro+ itself prints only the small red "Bear" / green "Bull" tags and the connecting trendline in the RSI pane. Nothing in the price or RSI data has been edited.
Screenshot 1 of 12
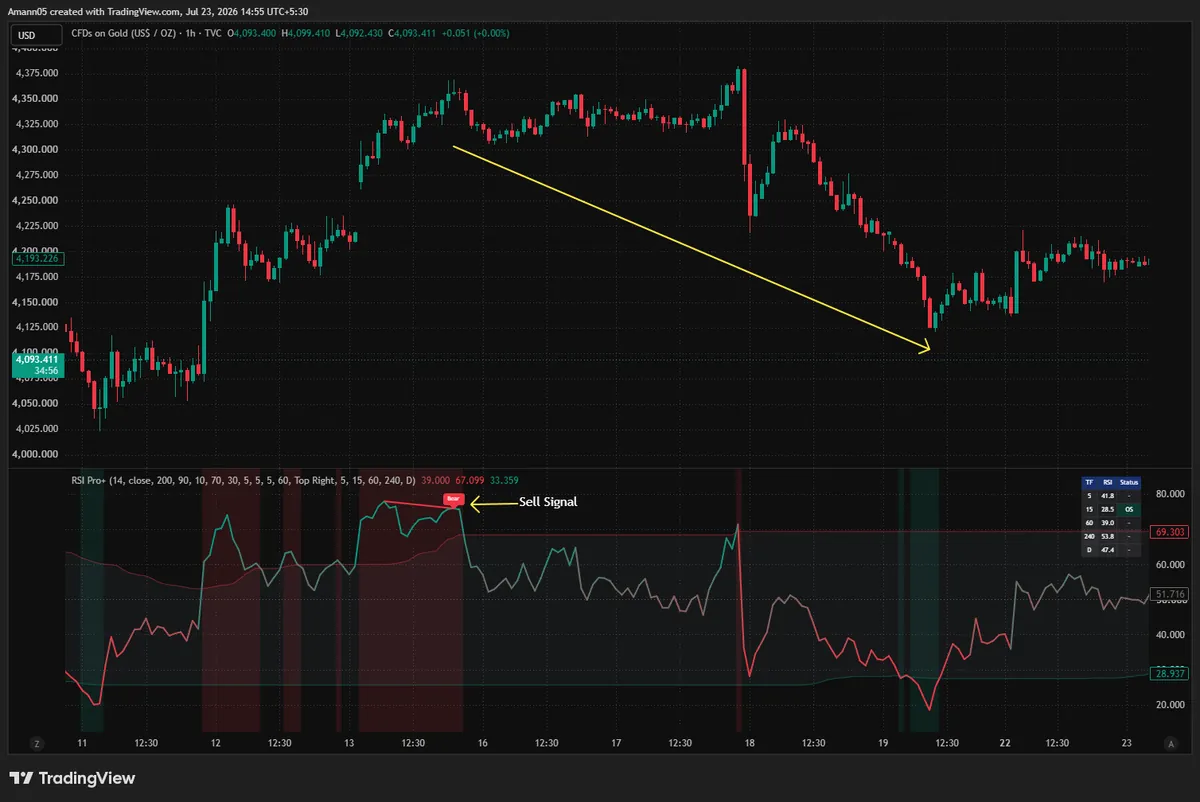
Gold: a clean bearish divergence into a decline
RSI Pro+ on Gold (1H) — a single bearish divergence tag at a swing high, followed by a sharp move lower.
RSI prints two swing highs in the panel — the first near 70, the second (tagged "Bear") lower, even though gold's price at that second peak was at or above the first. That RSI-lower-high-vs-price-higher-high mismatch is a textbook regular bearish divergence, and it's the cleanest single example in this set: one tag, one clear move. Instrument: Gold (XAU/USD CFD). Works the same way across metals, crypto, and indices — the mechanism doesn't change per asset.
Screenshot 2 of 12
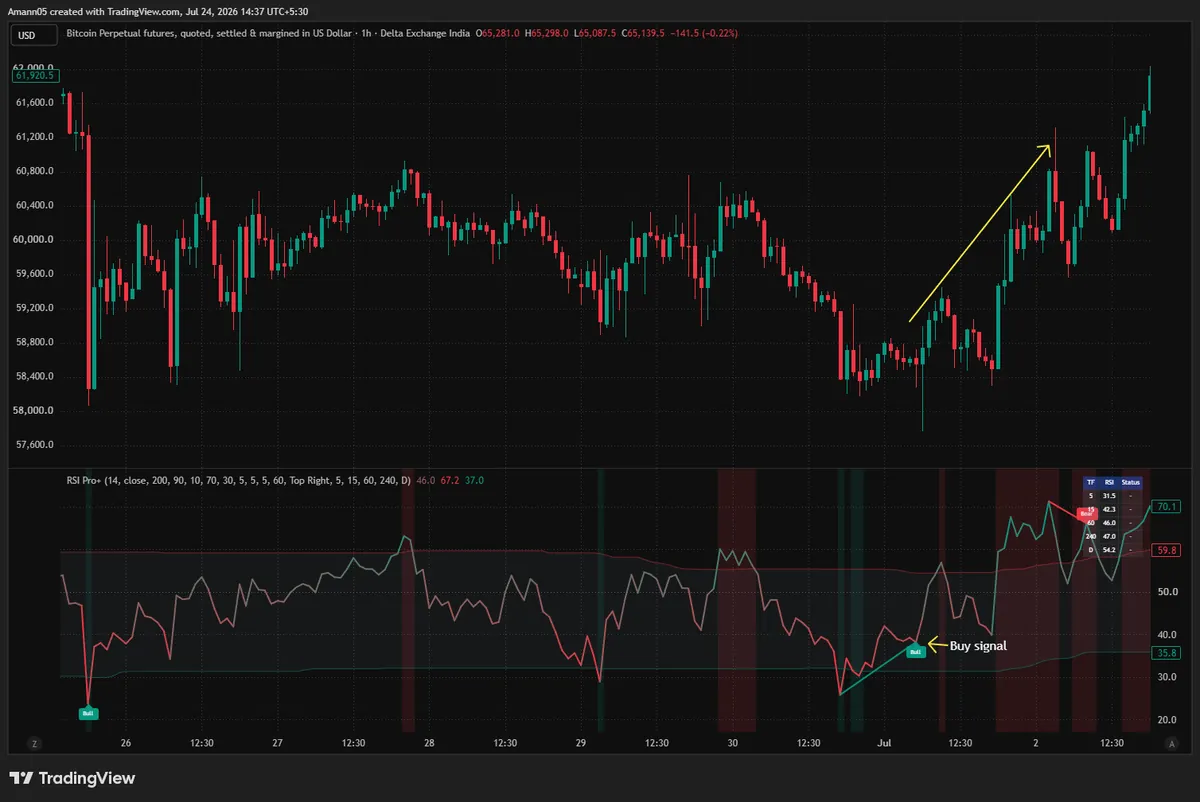
Bitcoin: a clean bullish divergence into a rally
RSI Pro+ on Bitcoin (1H) — a bullish divergence tag at a swing low, followed by a strong rally.
Mirror case to Screenshot 1. An earlier RSI trough is followed by a second, higher RSI trough (tagged "Bull") even as price pressed to a similar or lower level — the regular bullish divergence pattern. Note this chart also shows an earlier, un-tagged "Bull" marker further left at a deeper RSI low that preceded a smaller bounce — a reminder that the engine tags every confirmed pivot divergence it finds, not just the ones that lead to the biggest moves. Instrument: BTCUSD.P (Bitcoin perpetual futures, Delta Exchange India).
Screenshot 3 of 12
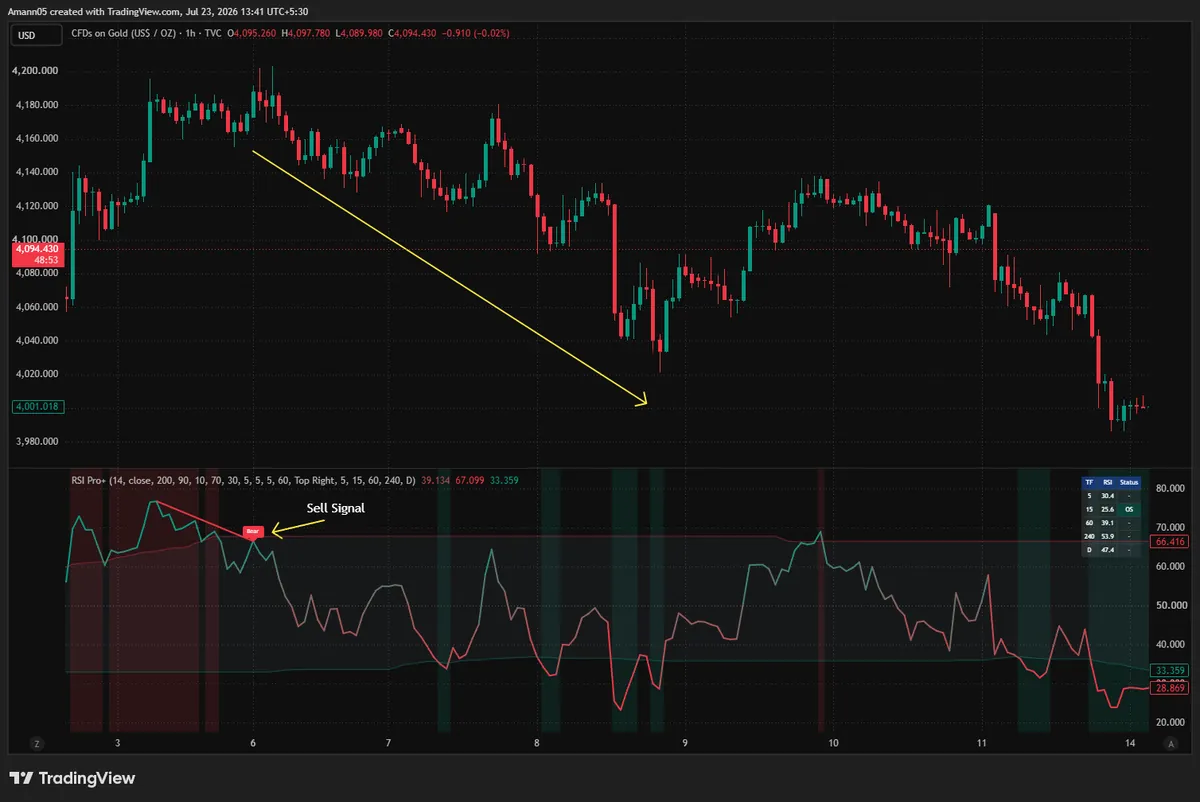
Gold: reading the MTF dashboard alongside a sell signal
RSI Pro+ on Gold (1H) — a bearish divergence with two timeframes already flagged oversold on the MTF dashboard.
This is the screenshot to teach the dashboard with. At the moment the Bear tag prints on the 1H chart, the table shows the 5m and 15m timeframes already status-flagged OS (oversold on their own adaptive bands) while 60m/240m/Daily read neutral. That's a genuine cross-timeframe read, not decoration — a trader following the product's own "check the dashboard before acting" guidance would see the lower timeframes already stretched and weigh that against the 1H divergence. Instrument: Gold.
Screenshot 4 of 12
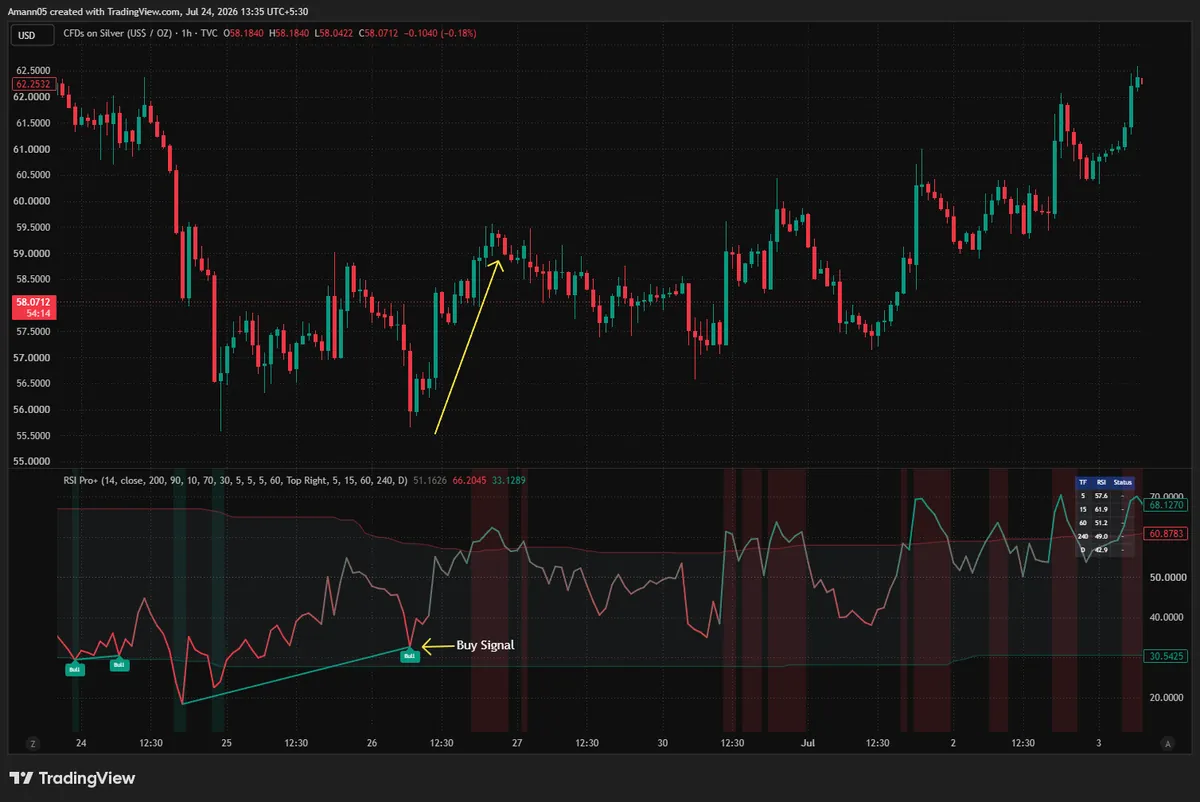
Silver: MTF dashboard in full agreement (no OB/OS, just direction)
RSI Pro+ on Silver (1H) — three sequential bullish divergence tags with the MTF dashboard trending up across every timeframe.
Not every useful dashboard read involves an OB/OS flag. Here the Status column shows - on every row (no timeframe is at an adaptive extreme), but the RSI values themselves — 57.6, 61.9, 51.2, 49.0, 42.9 — are all on the rising side, which is the "higher timeframes agree" case the dashboard is built for. Also visible: three separate Bull tags formed at successive, rising RSI troughs in the same base before the labeled "Buy Signal" — divergence tags accumulate as pivots confirm, they don't just fire once. Instrument: Silver (XAG/USD CFD).
Screenshot 5 of 12
Bitcoin: watching the adaptive bands move
RSI Pro+ on Bitcoin (1H) — the adaptive oversold band visibly climbing as the market's RSI regime shifts.
This is the clearest illustration of the adaptive-band mechanism in the whole set — you can trace the green adaptive-oversold line sloping upward over the course of the chart as Bitcoin's recent RSI distribution shifts higher. A fixed "30" line would have stayed put; this one moved with the market's own recent behavior. Two bearish divergence tags print early (connected by the red trendline, "Sell Signal" labeled) ahead of a decline; a bullish tag later marks a subsequent low. Instrument: BTCUSD.P.
Screenshot 6 of 12
Gold: a signal that didn't stop the trend (showing the engine's honesty)
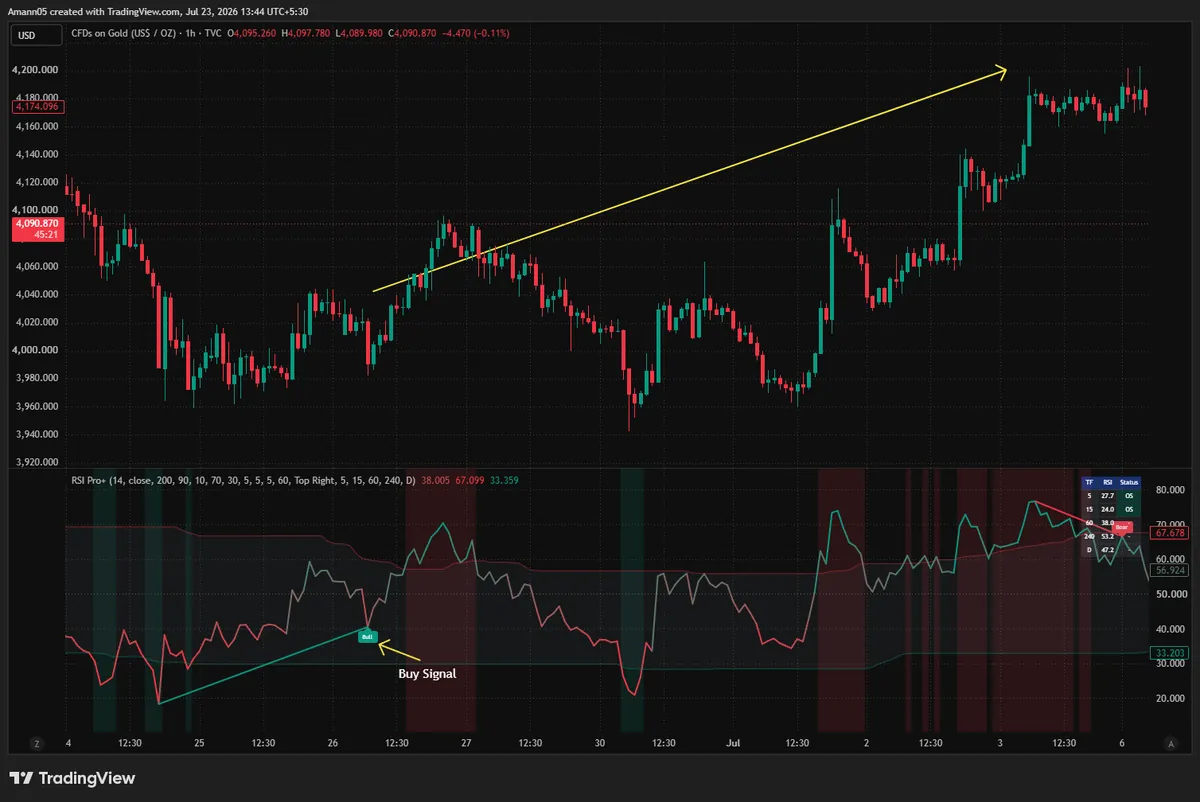
RSI Pro+ on Gold (1H) — a bullish divergence into a strong rally, with a later bearish tag that price initially shrugged off.
Included deliberately to show the tool as it behaves, not as a highlight reel. The labeled "Buy Signal" bullish divergence at the low is followed by a strong, sustained rally — a clean case. Later in the same chart a second (un-labeled) bearish divergence tag prints near the new high, and price does not immediately reverse in this snapshot. Divergence tags flag conditions, not guaranteed turning points — this is exactly why the product page frames RSI Pro+ as "not a complete trading system" and why the MTF dashboard exists as a filter, not a guarantee. Instrument: Gold.
Screenshot 7 of 12
Gold: second clean sell example, different regime
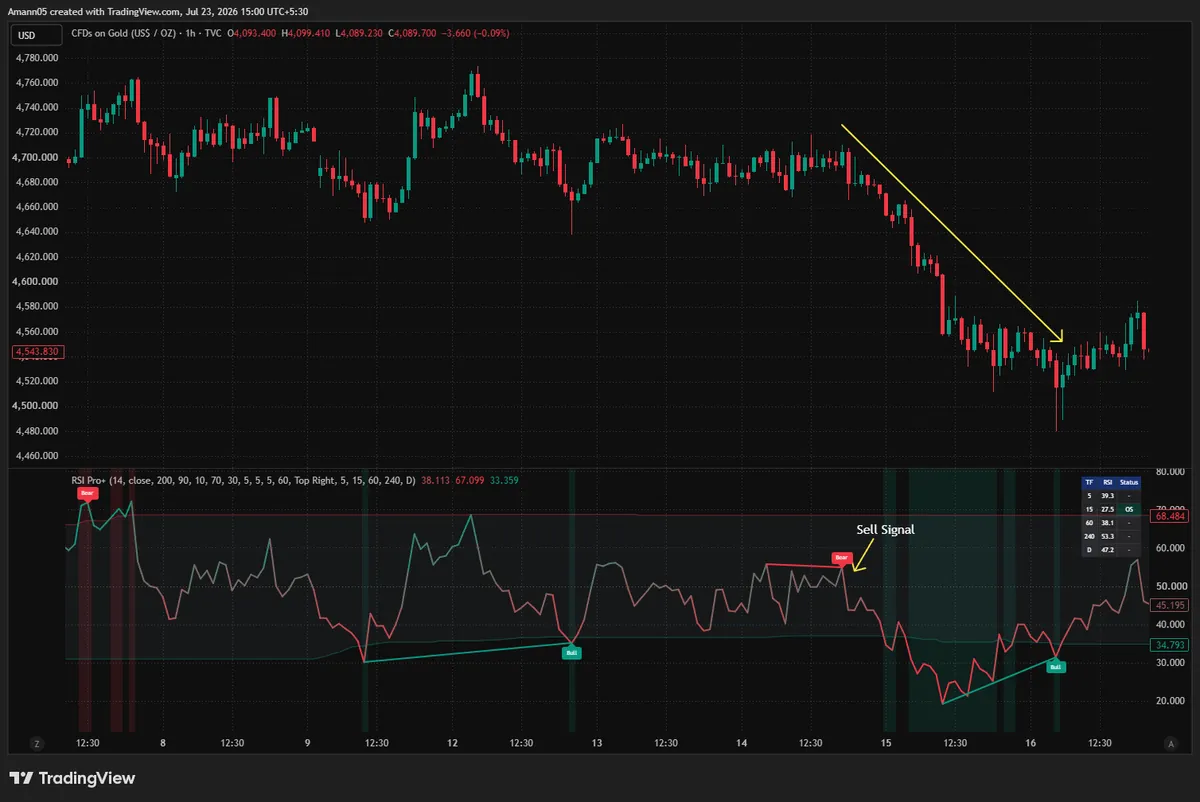
RSI Pro+ on Gold (1H) — a bearish divergence at a swing high, followed by a multi-day decline.
A second Gold example at a different price level and time window, included to show the same bearish-divergence mechanism repeating in a separate regime rather than relying on one lucky chart. Two bullish "Bull" tags also appear (one early, one after the decline), each anchored by their own rising-RSI-trough trendline — showing the engine working on both sides of the market within a single chart, not just the featured sell case. Instrument: Gold.
Screenshot 8 of 12
Silver: double bearish divergence into a decline
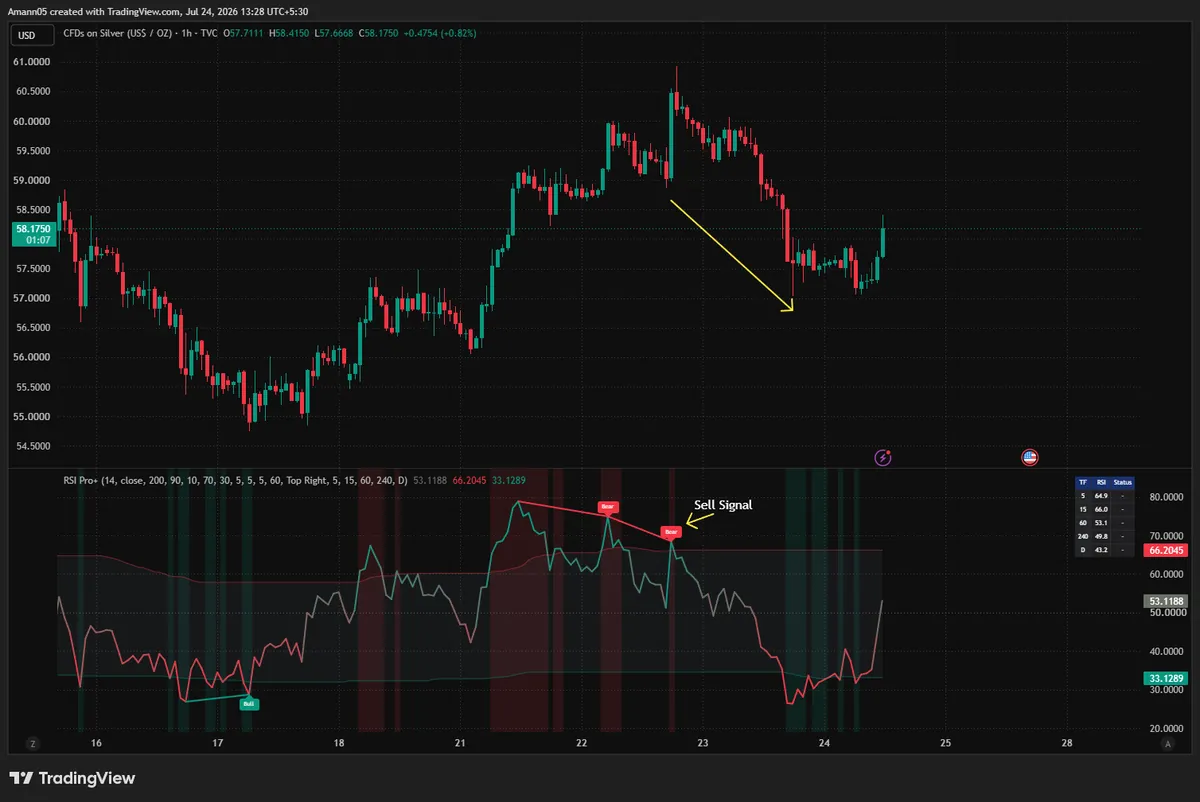
RSI Pro+ on Silver (1H) — two connected bearish divergence tags at a swing high, followed by a drop of roughly $3.
Two RSI peaks form close together, both above the adaptive overbought line, with the second one lower than the first even as price held near its highs — the engine draws the connecting line across both confirmed pivots and tags the second one. An earlier Bull tag at the prior swing low is also visible. Instrument: Silver.
Screenshot 9 of 12
Silver: the full buy-then-sell cycle in one chart
RSI Pro+ on Silver (1H) — the same move as Screenshot 8, zoomed out to show the prior Buy signal that started the rally.
This is the widened view of Screenshot 8 — it shows the complete round trip: bullish divergence at the low → rally of roughly $4.50 → bearish divergence at the resulting high → decline. Useful as a single-image summary of how the engine reads a full swing, not just one side of it. Instrument: Silver.
Screenshot 10 of 12
Silver: a choppy range produces more tags
RSI Pro+ on Silver (1H) — four bullish divergence tags and one bearish tag across a ranging, directionless stretch.
Included to set expectations honestly: in a choppy, range-bound market the divergence engine confirms more pivots and prints more tags — four separate Bull signals here, only one of them (the featured one) leading to a clearly labeled move. This is where the MTF dashboard and the (optional) hidden-divergence toggle matter most, as a way to filter which of several tags to weight. Instrument: Silver.
Screenshot 11 of 12
Silver: buy signal into a sustained multi-day rally
RSI Pro+ on Silver (1H) — a bullish divergence at a low near $62, followed by a rally past $71, with a new bearish tag forming at the top.
The longest, cleanest single trend example in the set — over $9 of follow-through after the labeled Buy Signal. By the right edge of the chart a new bearish divergence tag has already formed near the peak, which is the engine flagging the next thing to watch, not a guarantee the rally is over. Good chart for showing "what a strong signal followed by strong continuation looks like" without overstating it as typical. Instrument: Silver.
Screenshot 12 of 12
Bitcoin: cross-asset close
RSI Pro+ on Bitcoin (1H) — the same bearish divergence mechanism, on crypto this time.
Closing the set back on Bitcoin to reinforce the point running through all 12 charts: the same three mechanisms — adaptive bands, divergence engine, MTF dashboard — produced comparable, readable signals on a precious metal, a commodity, and a crypto perpetual future, with no asset-specific tuning required. Instrument: BTCUSD.P.
Want the full settings, alert list and parameter reference for this indicator?
Fast reversal cues via divergence + adaptive bands on lower timeframes, cross-checked against the MTF table before entry.
Swing Traders
The 5-timeframe dashboard keeps swing entries aligned with higher-timeframe RSI direction.
Reversal & Momentum Traders
The two divergence types cover both jobs: regular divergence for reversal entries, hidden divergence for continuation entries in an existing trend.
FAQ
Common Questions
What is RSI Pro+?
RSI Pro+ is an RSI toolkit that combines three things traders normally need separate indicators for: an automatic divergence engine (regular and hidden), regime-adaptive overbought/oversold bands, and a multi-timeframe RSI dashboard — all in one pane.
How is it different from the built-in RSI?
The underlying oscillator is Wilder's classic RSI, but RSI Pro+ adds three layers the built-in version does not have: adaptive percentile-based OB/OS bands, an automatic pivot-based divergence engine that draws regular and hidden divergences, and a five-timeframe RSI confluence table.
What are adaptive OB/OS bands?
Instead of fixed 70/30 lines, the overbought and oversold levels are computed as rolling percentiles of the RSI's own recent distribution (default 90th and 10th percentile over 200 bars). In strong uptrends the overbought band rises; in downtrends it falls. Static 70/30 levels remain available as a toggle.
What is the difference between regular and hidden divergence?
Regular divergences (price makes a lower low while RSI makes a higher low, or the bearish mirror) signal potential reversals. Hidden divergences (price makes a higher low while RSI makes a lower low) signal potential trend continuation and are most useful with the higher-timeframe trend.
Do the signals repaint?
No forward repainting. Pivots confirm a fixed number of bars (default 5, the Pivot Lookback Right setting) after the actual high/low forms — this is inherent to pivot detection and is the honest trade-off for non-repainting signals. Once a divergence line or label is printed, it stays. Use "Once per bar close" for alerts.
Which markets and timeframes does it work on?
All symbols and all timeframes — stocks, indices, forex, crypto, and futures. The MTF dashboard defaults to 5m, 15m, 1H, 4H and Daily but every timeframe is user-selectable.
Is it a complete trading system?
No. RSI Pro+ is a technical analysis tool, not financial advice and not a complete trading system. Always combine it with your own risk management.
Do the yellow arrows and "Buy/Sell Signal" labels on these screenshots come from the indicator?
No. RSI Pro+ prints the Bull/Bear tags and the connecting trendline only. The yellow price-chart arrows and "Buy Signal"/"Sell Signal" text on this page are annotations added afterward to help you see which divergence tag preceded which price move.
Does every Bull/Bear tag lead to a big move?
No, and Screenshot 6 above shows an example where it didn't. Divergence tags flag a condition in price/RSI behavior, not a guaranteed outcome. That's why RSI Pro+ ships with the adaptive bands and the MTF dashboard as additional context, not as a standalone trigger.
Is RSI Pro+ included in the free plan?
Quantzee is paid-only — there is no free plan. RSI Pro+ is one of the 7 indicators unlocked by the paid Quantzee subscription (from $9.99/mo).
See These Signals Live on Your Own Charts
RSI Pro+ ships with the other 7 Quantzee indicators on a single subscription — invite-only TradingView access, real-time alerts, all markets and timeframes.
Disclaimer: Quantzee provides analytical software, not investment advice. RSI Pro+ and all Quantzee indicators are for educational and informational purposes only and are not financial, investment, or trading advice, and do not constitute a recommendation to buy or sell any security or instrument. The screenshots on this page illustrate how the indicator's signals are generated on historical price data — they are not a track record and do not represent future performance. Past signals do not guarantee future results. Trading involves risk of loss, including the possible loss of principal. Always do your own research and consult a qualified financial advisor before making trading decisions.
Wait — before you go
See these indicators live on your charts — for the price of a coffee.
Get all 7 paid Quantzee indicators on TradingView. Non-repainting signals, real-time alerts, every market.