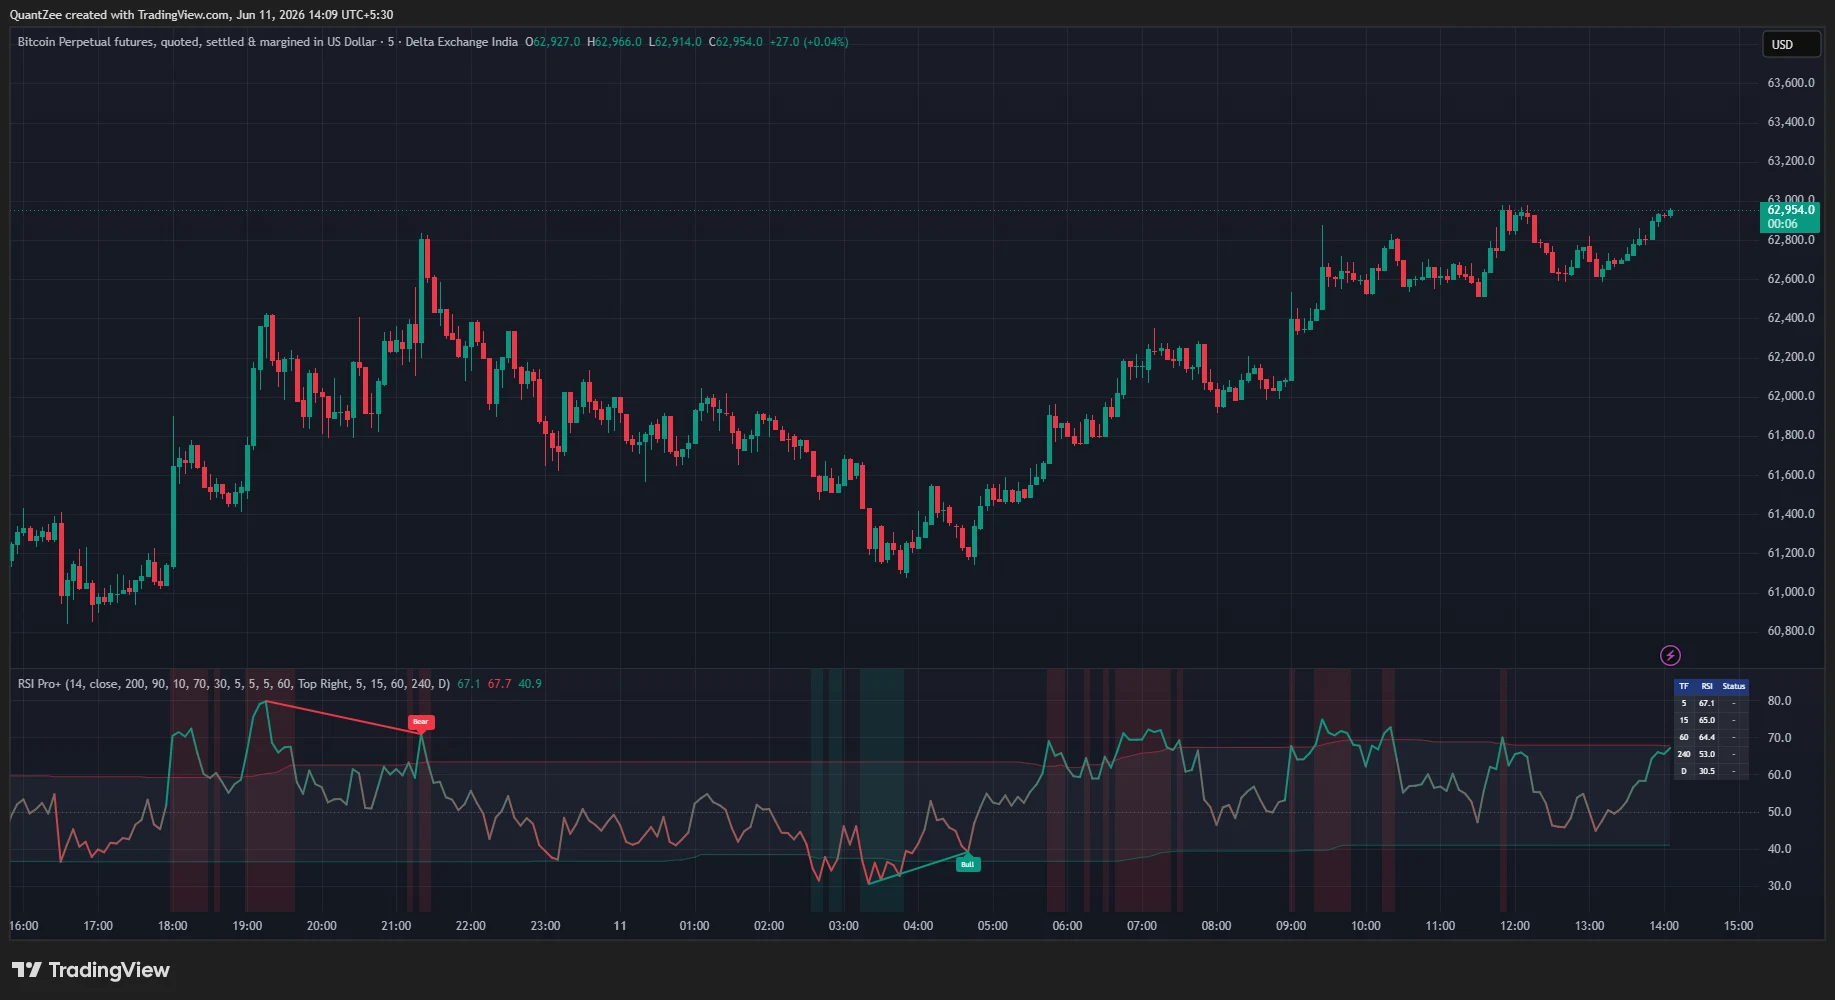
RSI Pro+
Divergence + Adaptive Bands + MTF.
Three RSI tools in one pane — adaptive, automatic, non-repainting.
RSI Pro+ combines three things traders normally need separate indicators for: an automatic divergence engine, regime-adaptive overbought/oversold bands, and a multi-timeframe RSI dashboard — all in one clean pane.
The underlying oscillator is Wilder's classic RSI, but Pro+ layers on percentile-based adaptive bands, a pivot-based regular & hidden divergence engine, and a five-timeframe confluence table — so you read momentum, exhaustion, and higher-timeframe context at a glance.
14-day money-back guarantee · Invite-only access granted on subscription
The Core Concept
RSI That Adapts to the Market — Not the Other Way Around
Fixed 70/30 lines fail in trends: RSI can sit "overbought" for an entire rally. RSI Pro+ solves this by computing the overbought and oversold levels as rolling percentiles of the RSI's own recent distribution. In strong uptrends the overbought band automatically rises; in downtrends it falls — so the bands describe what is actually extreme for the current regime.
On top of the adaptive bands sits an automatic divergence engine and a five-timeframe RSI table, turning a single oscillator into a complete momentum-context system.
New to the concept? Read our glossary explainer on RSI and momentum. For the underlying theory, see Investopedia's reference on the Relative Strength Index (RSI) and TradingView's documentation on the built-in RSI indicator.
3-in-1
Single Pane
Divergence engine, adaptive bands, and an MTF RSI dashboard combined — no more stacking three separate indicators.
Regime
Adaptive Levels
Percentile-based bands move with the market so RSI stops sticking "overbought" through a whole trend.
No
Repainting
Pivot-confirmed divergences and lookahead-off MTF data mean printed signals never disappear.
Key Features
Everything an RSI Should Be
Three RSI tools fused into one pane — adaptive bands, an automatic divergence engine, and multi-timeframe confluence.
Adaptive OB / OS Bands
Instead of fixed 70/30 lines, the overbought and oversold levels are computed as rolling percentiles of the RSI's own recent distribution (default: 90th and 10th percentile over 200 bars). In strong uptrends the overbought band automatically rises; in downtrends it falls — reducing the classic problem of RSI staying "overbought" through an entire trend. In practice this means the adaptive oversold band on a trending equity often sits 5–10 RSI points below the static 30 level, capturing genuine exhaustion zones rather than producing premature reversal signals. Static 70/30 levels remain available as a toggle.
Automatic Divergence Engine
Detects and draws regular and hidden, bullish and bearish divergences using pivot-based logic. A divergence needs two confirmed RSI pivots within a configurable bar range, with price and RSI disagreeing in direction. Regular divergences signal potential reversals; hidden divergences signal potential trend continuation. Each detection is a connecting line plus a label, and each type has its own alert.
Multi-Timeframe RSI Dashboard
A compact table shows the live RSI reading and overbought/oversold status across five user-selectable timeframes, so you can check higher-timeframe momentum confluence without switching charts — and avoid taking counter-trend signals against the bigger picture.
Momentum Gradient & Background
The RSI line is colored with a gradient that gives a quick visual read of momentum direction, while a background highlight marks the bars where RSI is beyond the adaptive bands — so exhaustion zones jump off the chart instantly.
Non-Repainting by Design
Pivots confirm a fixed number of bars (default 5) after the high/low forms — the honest trade-off for signals that never repaint. Once a divergence line or label is printed, it stays. Multi-timeframe data is requested with lookahead off.
Six Built-In Alerts
Alert conditions for regular bullish, regular bearish, hidden bullish, and hidden bearish divergence, plus RSI exiting overbought and RSI exiting oversold. "Once per bar close" is the recommended trigger setting for confirmed signals.
How To Use It
Reading the Signals
- Reversal cues. Regular bullish divergence near or below the adaptive oversold band = potential exhaustion of a down-move. Regular bearish divergence near the adaptive overbought band = potential exhaustion of an up-move.
- Continuation cues. Hidden divergences (off by default, enable in settings) are continuation signals — most useful when trading with the higher-timeframe trend shown in the dashboard.
- Momentum at a glance. The background highlight marks bars where RSI is beyond the adaptive bands; the gradient color of the RSI line gives a quick visual read of momentum direction.
- Avoid counter-trend trades. Use the MTF table to skip bearish divergences on a 5-minute chart when the 1-hour and 4-hour RSI are both rising and far from overbought.
What You Can Achieve
From a Single Number to Full Context
Catch Cleaner Reversals
Regular bullish divergence near or below the adaptive oversold band flags potential exhaustion of a down-move — and vice versa near the overbought band.
Trade With the Trend
Hidden divergences are continuation signals — most useful when traded with the higher-timeframe trend shown in the MTF dashboard.
Read Momentum at a Glance
Gradient line coloring and band-aware background highlights make overbought/oversold exhaustion obvious without reading the number.
Filter Counter-Trend Risk
Use the MTF table to skip bearish divergences on a 5-min chart when the 1H and 4H RSI are both rising and far from overbought.
Who It's For
Built for Momentum Traders
Whether you scalp reversals intraday or hold swing positions, RSI Pro+ adapts to your chart — the adaptive bands recalibrate to every symbol and timeframe, and the MTF table keeps you aligned with the bigger picture.
Intraday Scalpers
Swing Traders
Reversal & Momentum Traders
Alerts
Six Alert Conditions
Regular bullish, regular bearish, hidden bullish and hidden bearish divergence, plus RSI exiting overbought and RSI exiting oversold. Route them to email, mobile push, or webhooks — and use "Once per bar close" for confirmed, non-repainting triggers.
Go Deeper
See exactly how these signals are generated
Twelve real TradingView charts — Bitcoin, Gold and Silver — walking through every adaptive band, divergence tag and multi-timeframe dashboard read, one signal at a time.
See the 12 signal charts →FAQ
Common Questions
What is RSI Pro+?
RSI Pro+ is an RSI toolkit that combines three things traders normally need separate indicators for: an automatic divergence engine (regular and hidden), regime-adaptive overbought/oversold bands, and a multi-timeframe RSI dashboard — all in one pane.
How is it different from the built-in RSI?
The underlying oscillator is Wilder's classic RSI, but RSI Pro+ adds three layers the built-in version does not have: adaptive percentile-based OB/OS bands, an automatic pivot-based divergence engine that draws regular and hidden divergences, and a five-timeframe RSI confluence table.
What are adaptive OB/OS bands?
Instead of fixed 70/30 lines, the overbought and oversold levels are computed as rolling percentiles of the RSI's own recent distribution (default 90th and 10th percentile over 200 bars). In strong uptrends the overbought band rises; in downtrends it falls. Static 70/30 levels remain available as a toggle.
What is the difference between regular and hidden divergence?
Regular divergences (price makes a lower low while RSI makes a higher low, or the bearish mirror) signal potential reversals. Hidden divergences (price makes a higher low while RSI makes a lower low) signal potential trend continuation and are most useful with the higher-timeframe trend.
Do the signals repaint?
No forward repainting. Pivots confirm a fixed number of bars (default 5, the Pivot Lookback Right setting) after the actual high/low forms — this is inherent to pivot detection and is the honest trade-off for non-repainting signals. Once a divergence line or label is printed, it stays. Use "Once per bar close" for alerts.
Which markets and timeframes does it work on?
All symbols and all timeframes — stocks, indices, forex, crypto, and futures. The MTF dashboard defaults to 5m, 15m, 1H, 4H and Daily but every timeframe is user-selectable.
Is it a complete trading system?
No. RSI Pro+ is a technical analysis tool, not financial advice and not a complete trading system. Always combine it with your own risk management.
14-Day Money-Back Guarantee
Get Invite-Only Access to RSI Pro+
One subscription unlocks all 13 Quantzee indicators, real-time alerts, and multi-market access.