MACD Pro+
Cross Quality + Divergence + MTF.
The MACD that tells you which crosses to ignore.
MACD Pro+ rebuilds the classic MACD around the one problem every MACD trader knows: most signal-line crosses near the zero line are whipsaw noise. It grades every cross Strong or Weak using an adaptive chop zone, adds a price-normalized mode for cross-symbol comparison, a 4-phase histogram, a divergence engine, and a multi-timeframe dashboard.
The underlying oscillator is the standard MACD; Pro+ layers on a self-adjusting noise band that separates the crosses worth taking from the noise — no manual threshold tuning, on any symbol or timeframe.
14-day money-back guarantee · Invite-only access granted on subscription
The Core Concept
Grade Every Cross — Trade Only the Ones That Matter
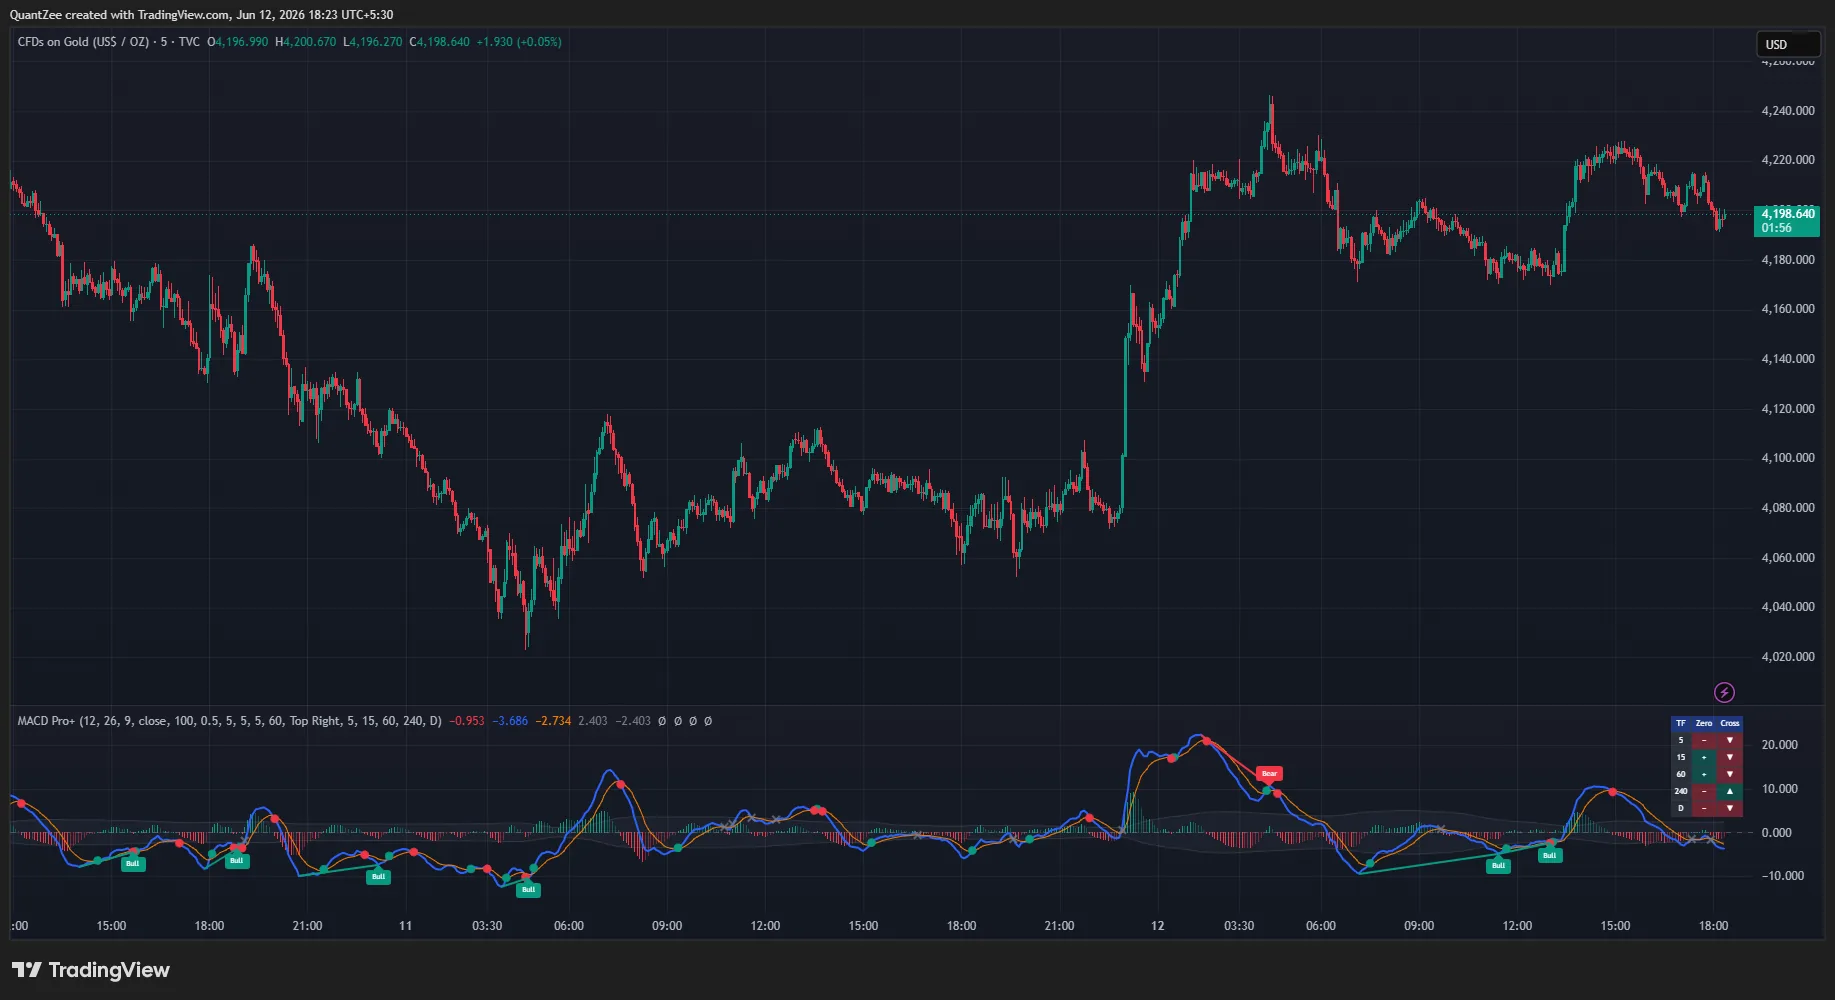
Most MACD crosses near the zero line are whipsaw noise. MACD Pro+ builds an adaptive chop zone around zero, sized from the MACD's own recent volatility, and grades each signal-line cross by where it lands: inside the zone is Weak (a grey ×), outside is Strong (a solid circle). Because the band derives from the indicator's own statistics, it self-adjusts to every symbol and timeframe with no manual tuning.
On top sit a normalized mode for cross-symbol comparison, a 4-phase histogram, a pivot-based divergence engine, and a five-timeframe dashboard — turning a standard oscillator into a complete momentum-quality system.
New to the concept? Read our glossary explainer on MACD and momentum oscillators. For the underlying theory, see Investopedia on Moving Average Convergence Divergence (MACD) and TradingView's docs on the built-in MACD indicator.
Auto
Chop Zone
An adaptive noise band sized from the MACD's own volatility grades every cross Strong or Weak — no manual threshold tuning, self-adjusting per symbol.
4
Histogram Phases
Colored by side and direction so momentum acceleration vs deceleration is readable before any cross prints.
No
Repainting
All conditions from completed-bar values; divergence pivots confirm and never repaint once printed; MTF data with lookahead off.
Key Features
Everything the Classic MACD Is Missing
An adaptive chop zone, cross-symbol normalized mode, a 4-phase histogram, a non-repainting divergence engine and a five-timeframe dashboard — fused into one pane.
Cross Quality Grading via an Adaptive Chop Zone
The script computes a noise band around the zero line, sized from the standard deviation of the MACD's own recent values (lookback and width configurable). Signal-line crosses INSIDE the band are graded Weak and marked with a small grey ×; crosses OUTSIDE it are graded Strong and marked with a solid circle. The band is drawn as a shaded zone so you see whipsaw territory at a glance. Because it is derived from the MACD's own volatility, it self-adjusts to every symbol and timeframe — no manual threshold tuning.
Normalized Mode for Cross-Symbol Comparison
Optionally express MACD as a percentage of price instead of absolute points. Standard MACD values are not comparable across symbols — a reading of 50 on a large index versus 0.5 on a low-priced stock says nothing relative. Normalized mode puts every instrument on the same scale, which makes visual comparison, screening, and alert thresholds portable across your whole watchlist.
4-Phase Histogram Coloring
The histogram is colored by both side and direction — rising above zero, falling above zero, falling below zero, rising below zero — so momentum acceleration versus deceleration is readable instantly, before any cross occurs. A visibly shrinking histogram while price pushes to a new high or low is one of the earliest divergence signals, often forming 3–8 bars before the pivot-based detection engine confirms the divergence.
Divergence Engine
Pivot-based detection of bullish divergences (price lower low, MACD higher low) and bearish divergences (price higher high, MACD lower high), drawn with connecting lines and labels on the MACD line. Pivots confirm a configurable number of bars after the pivot forms (default 5) and never repaint once printed.
Multi-Timeframe MACD Dashboard
A compact table shows, for five user-selected timeframes (default 5m, 15m, 1h, 4h, Daily), whether MACD is above or below zero and whether it is above or below its signal line — a one-glance momentum confluence check to align trades with the higher-timeframe regime.
Non-Repainting by Design
All conditions are computed from completed-bar values. Divergence pivots confirm a configurable number of bars after the pivot forms (default 5) and never repaint once printed. Multi-timeframe data is requested with lookahead off. For alerts, "Once per bar close" is the recommended trigger setting.
How To Use It
Reading the Signals
- Filter the chop. Treat the shaded chop zone as a no-trade filter for crosses: grey × markers are the crosses that would historically have whipsawed; solid circles are the ones occurring with real displacement from equilibrium.
- Know your trade type. Strong bullish crosses below zero are mean-reversion style entries; strong bullish crosses above zero are continuation entries — the zero side of the marker tells you which type you are taking.
- Watch the histogram phase. A fading histogram (lighter shade) while price pushes to new extremes often precedes the divergences this script detects.
- Align with the MTF table. A chart-timeframe strong cross in the same direction as the higher-timeframe zero-line position is structurally stronger than one against it.
What You Can Achieve
From Noisy Crosses to Graded Signals
Filter Out Whipsaw Crosses
Treat the shaded chop zone as a no-trade filter: grey × markers are the crosses that would historically have whipsawed; solid circles are crosses with real displacement from equilibrium.
Know Which Trade You Are Taking
Strong bullish crosses below zero are mean-reversion style entries; strong bullish crosses above zero are continuation entries — the zero side of the marker tells you which type you are taking.
See Momentum Fade Early
A fading histogram (lighter shade) while price pushes to new extremes often precedes the divergences this script detects — momentum acceleration vs deceleration is readable before the cross.
Align with Higher Timeframes
A chart-timeframe strong cross in the same direction as the higher-timeframe zero-line position is structurally stronger than one against it — the MTF dashboard shows it at a glance.
Who It's For
Built for MACD Traders
Whether you trade momentum continuations, fade exhausted moves on divergence, or screen a watchlist for the same setup, MACD Pro+ adapts to your chart — the chop zone recalibrates to every symbol, and normalized mode makes thresholds portable across instruments.
Momentum & Trend Traders
Mean-Reversion Traders
Multi-Symbol Screeners
Alerts
Six Alert Conditions
Strong bullish cross, strong bearish cross, zero-line cross up, zero-line cross down, bullish divergence, and bearish divergence. Route them to email, mobile push, or webhooks — and use "Once per bar close" for confirmed, non-repainting triggers.
FAQ
Common Questions
What is MACD Pro+?
MACD Pro+ rebuilds the classic MACD around the one problem every MACD trader knows: most signal-line crosses near the zero line are whipsaw noise. It grades every cross via an adaptive chop zone, adds an optional price-normalized mode for cross-symbol comparison, 4-phase histogram coloring, a divergence engine, and a multi-timeframe MACD dashboard.
How is it different from the standard MACD?
The underlying oscillator is the standard MACD (fast EMA minus slow EMA with an EMA signal line). MACD Pro+ adds cross-quality grading via an adaptive noise band around zero (Strong vs Weak crosses), a normalized mode that expresses MACD as a percentage of price for cross-symbol comparison, a 4-phase histogram, a pivot-based divergence engine, and a five-timeframe MACD dashboard.
How does cross quality grading work?
The script computes a noise band around the zero line, sized from the standard deviation of the MACD's own recent values. Signal-line crosses INSIDE this band are graded Weak (classic whipsaw territory) and marked with a grey ×; crosses OUTSIDE it are graded Strong and marked with a solid circle. Because the band is derived from the MACD's own volatility, it self-adjusts to every symbol and timeframe — no manual threshold tuning.
What is normalized mode?
Optionally express MACD as a percentage of price instead of absolute points. Standard MACD values are not comparable across symbols — 50 on a large index versus 0.5 on a low-priced stock says nothing relative. Normalized mode puts every instrument on the same scale, making visual comparison, screening, and alert thresholds portable across your whole watchlist.
What does the 4-phase histogram show?
The histogram is colored by both side and direction — rising above zero, falling above zero, falling below zero, rising below zero — so you can read momentum acceleration versus deceleration instantly, before any cross occurs. A fading histogram while price pushes to new extremes often precedes the divergences the engine detects.
Does it repaint?
No. All conditions are computed from completed-bar values. Divergence pivots confirm a configurable number of bars after the pivot forms (default 5) and never repaint once printed. Multi-timeframe data is requested with lookahead off. Use "Once per bar close" for alerts.
Which markets and timeframes does it work on?
All symbols and all timeframes. MACD Pro+ is a technical analysis tool, not financial advice and not a complete trading system. Always apply your own risk management.
14-Day Money-Back Guarantee
Get Invite-Only Access to MACD Pro+
One subscription unlocks all 13 Quantzee indicators, real-time alerts, and multi-market access.