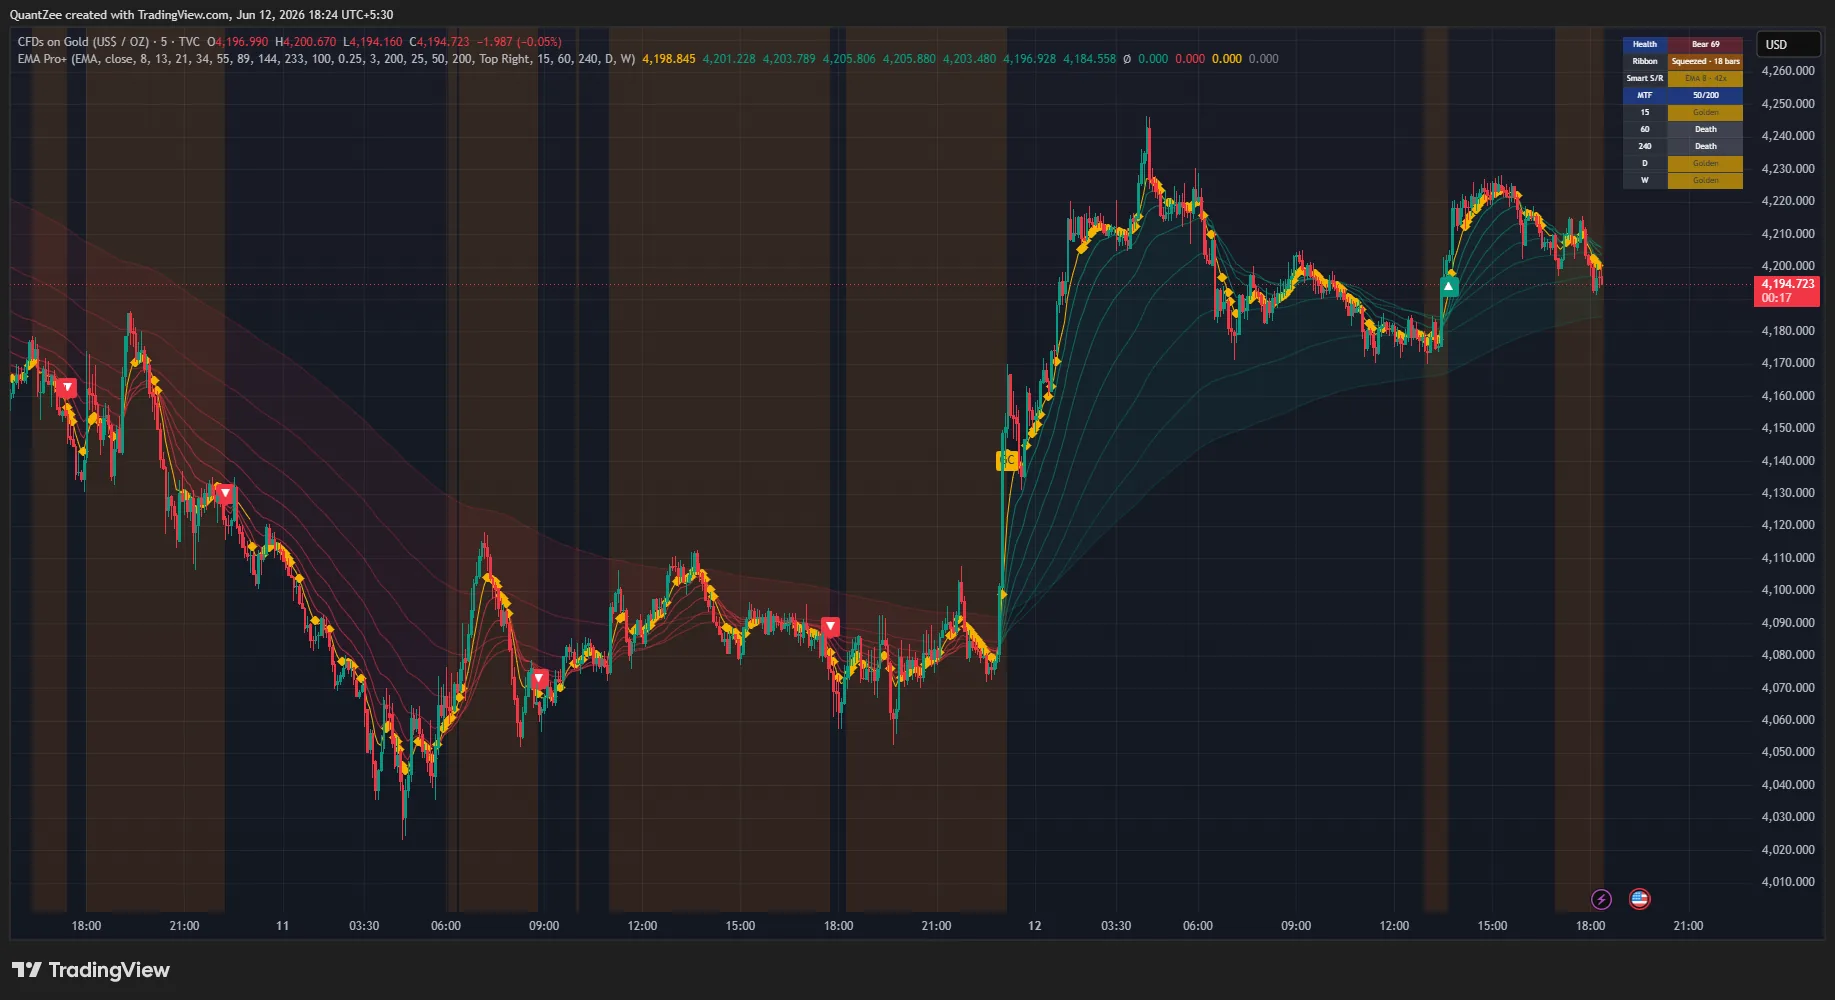
EMA Ribbon Pro+
Smart S/R + Compression + Trend Health.
The ribbon that measures which MA your chart actually respects.
EMA Ribbon Pro+ is an 8-line moving-average ribbon that answers the question traders argue about endlessly — which MA is this chart actually using as support and resistance? — empirically, by counting touches. It adds a compression/expansion engine with breakout signals, a 0–100 trend health score, golden/death cross markers, and a multi-timeframe cross dashboard.
The ribbon itself is standard; Pro+ layers on Smart S/R detection that highlights the most-respected line in gold, a squeeze engine, and one number for trend quality — so you stop guessing whether this chart "likes" the 20, 50 or 100, and let it tell you.
14-day money-back guarantee · Invite-only access granted on subscription
The Core Concept
Stop Guessing Which MA — Let the Chart Tell You
Every ribbon shows you eight moving averages; none of them tell you which one matters. EMA Ribbon Pro+ counts, for each line, how many times price has touched it within an ATR tolerance and closed back on the prevailing side — then renders the most-respected MA in gold with its touch count. Around that, a compression engine flags when the ribbon squeezes and prints a directional break on release.
A 0–100 trend health score from MA stacking order and slope agreement turns the whole ribbon into one readable number, and a five-timeframe golden/death cross table gives instant regime context.
New to the concept? Read our glossary explainer on moving averages and EMA ribbons. For the underlying theory, see Investopedia on the Exponential Moving Average (EMA) and TradingView's docs on the built-in EMA indicator.
8
Line Ribbon
EMA/SMA/WMA/HMA ribbon on Fibonacci lengths (8 → 233) with empirical Smart S/R detection of the most-respected line.
0–100
Trend Health
A single score from MA stacking order (60%) + slope agreement (40%) — clean trend vs half-formed, at a glance.
No
Repainting
All conditions from completed-bar values; Smart S/R uses historical touch counts; MTF data requested with lookahead off.
Key Features
A Ribbon That Measures, Not Guesses
Empirical Smart S/R, an ATR-normalized squeeze engine, a 0–100 trend health score, a configurable golden/death cross and a five-timeframe dashboard — fused into one overlay.
Smart S/R — The Most-Respected MA, Measured
For each of the 8 ribbon lines the script counts, over a configurable lookback, how many bars price touched the line within an ATR-based tolerance and closed back on the prevailing side — a respect, not just an intersection. The line with the most respects (above a minimum threshold) is drawn in gold, reported in the panel with its touch count (e.g. "EMA 21 · 6x"), and marked with a diamond on each new test. Instead of guessing whether this chart "likes" the 20, 50 or 100, the script measures it.
Compression / Expansion Engine
Ribbon width (highest MA minus lowest MA) is normalized by ATR and compared to a rolling percentile of its own history. When width falls below the percentile threshold the ribbon is in compression — the moving-average equivalent of a volatility squeeze — highlighted on the chart with a bar counter in the panel. When compression releases AND price closes beyond the entire ribbon, a directional expansion-break signal prints.
0–100 Trend Health Score
One number for trend quality, blending two measurable components: stacking order — how many of the 7 adjacent MA pairs are in proper bullish or bearish sequence (60% weight) — and slope agreement — how many of the 8 MAs are rising or falling (40% weight). "Bull 86" is a clean, aligned, rising ribbon; "Bull 55" is a half-formed trend. No more squinting at line order.
Golden / Death Cross Module
A classic configurable fast/slow cross (default 50/200) with on-chart GC/DC markers, computed with the same selectable MA type as the ribbon (EMA, SMA, WMA or HMA), plus a dashboard showing the cross state across five user-selected timeframes.
Multi-Timeframe Cross Dashboard
A compact panel reports the golden/death-cross state across five timeframes (default 15m, 1h, 4h, Daily, Weekly) alongside the live health score, compression state and Smart S/R reading — instant regime context so you know when a chart-timeframe long is fighting four higher-timeframe Death rows.
Non-Repainting by Design
All conditions are computed from completed-bar values; the Smart S/R selection uses only historical touch counts. Multi-timeframe data is requested with lookahead off. For alerts, "Once per bar close" is the recommended trigger. The HMA option is smoother but inherently more reactive to recent price than EMA/SMA — choose deliberately.
How To Use It
Reading the Signals
- Pullback traders. Instead of defaulting to "buy the 20 EMA," check the gold line — that is where this chart's buyers have actually been defending. The diamond markers and the Smart S/R alert notify you on each new test.
- Breakout traders. Wait for the compression highlight, let the bar counter build, and act on the expansion-break signal in its printed direction; the longer the compression, the more meaningful the release tends to be.
- Position management. Use the health score as a gauge — scores above ~70 indicate a clean, aligned trend where holding makes sense; a falling score with price still elevated is an early warning of trend decay.
- Regime context. The MTF cross table gives instant context — a chart-timeframe long against four "Death" rows is a counter-trend trade and should be treated as such.
What You Can Achieve
From Eight Lines to One Decision
Buy What the Chart Defends
Instead of defaulting to "buy the 20 EMA," check the gold line — that is where this chart's buyers have actually been defending. Diamond markers and the Smart S/R alert notify you on each new test.
Trade the Squeeze Release
Wait for the compression highlight, let the bar counter build, and act on the expansion-break in its printed direction — the longer the compression, the more meaningful the release tends to be.
Manage Positions by Score
Scores above ~70 indicate a clean, aligned trend where holding makes sense; a falling score with price still elevated is an early warning of trend decay.
Read Regime Instantly
The MTF cross table gives instant context — a chart-timeframe long against four "Death" rows is a counter-trend trade and should be treated as such.
Who It's For
Built for Trend & Pullback Traders
Whether you buy pullbacks into the line your chart actually defends or trade the release of a ribbon squeeze, EMA Ribbon Pro+ adapts to your chart — Smart S/R re-measures as character changes and the compression engine recalibrates to every symbol and timeframe.
Pullback & Trend Traders
Breakout Traders
Multi-Timeframe Swing Traders
Alerts
Six Alert Conditions
Ribbon compression started, bullish expansion break, bearish expansion break, golden cross, death cross, and Smart S/R touch. Route them to email, mobile push, or webhooks — and use "Once per bar close" for confirmed, non-repainting triggers.
FAQ
Common Questions
What is EMA Ribbon Pro+?
EMA Ribbon Pro+ is an 8-line moving-average ribbon (EMA, SMA, WMA or HMA) that answers the question traders argue about endlessly — "which moving average is this chart actually respecting?" — empirically, by counting touches. It adds a ribbon compression/expansion engine with breakout signals, a 0–100 trend health score, golden/death cross markers, and a multi-timeframe cross dashboard.
How is it different from a normal moving-average ribbon?
Moving averages and ribbons are standard tools. EMA Ribbon Pro+ layers on Smart S/R detection (it counts, per line, how often price touched and respected it, then highlights the most-respected MA in gold), an ATR-normalized compression/expansion engine with directional breakout signals, a 0–100 trend health score from stacking order and slope agreement, a configurable golden/death cross module, and a five-timeframe cross dashboard.
How does Smart S/R pick the most-respected MA?
For each of the 8 ribbon lines, the script counts how many bars over the lookback price touched the line within an ATR-based tolerance and closed back on the prevailing side — a respect, not just an intersection. The line with the most respects above the minimum threshold is rendered gold, reported in the panel with its touch count (e.g. "EMA 21 · 6x"), and marked with a diamond on each new test.
What is the compression / expansion engine?
Ribbon width (highest MA minus lowest MA) is normalized by ATR and compared to a rolling percentile of its own history. When width drops below the percentile threshold the ribbon is compressed — a moving-average squeeze — highlighted with a bar counter. When compression releases and price closes beyond the entire ribbon, a directional expansion-break signal prints.
How is the trend health score calculated?
It is a 0–100 score blending two measurable components: stacking order (how many of the 7 adjacent MA pairs are in proper bullish/bearish sequence, weighted 60%) and slope agreement (how many of the 8 MAs are rising or falling, weighted 40%). "Bull 86" is a clean aligned rising ribbon; "Bull 55" is a half-formed trend.
Does it repaint?
No. All conditions are computed from completed-bar values, and the Smart S/R selection uses only historical touch counts. Multi-timeframe data is requested with lookahead off. Use "Once per bar close" for alerts. Note the HMA option is smoother but inherently more reactive to recent price than EMA/SMA — choose deliberately.
Which markets and timeframes does it work on?
All symbols and all timeframes. Touch counts describe past behavior; a gold ribbon line with 8 or more respects over a 200-bar lookback is a statistically meaningful level — the kind of zone where institutional buyers or sellers have repeatedly stepped in. That is not a guarantee of future behavior, but it is a measurably different starting point than picking a round number. This is a technical analysis tool, not financial advice. Always apply your own risk management.
14-Day Money-Back Guarantee
Get Invite-Only Access to EMA Ribbon Pro+
One subscription unlocks all 13 Quantzee indicators, real-time alerts, and multi-market access.