The SuperTrend indicator is one of the most widely used trend-following tools in trading. Its combination of simplicity, visual clarity, and practical utility has made it a staple for traders across crypto, forex, commodities, and global equities — particularly for intraday and short-term swing trading. If you just need the formula and a quick definition, see the Supertrend Indicator glossary entry — this guide goes straight into best settings, visual patterns, and combination strategies.
But “the SuperTrend indicator” used on default settings is also one of the most frequently misused indicators in retail trading. The default parameters (ATR Period 10, Multiplier 3.0) were not designed to be optimal across all markets and timeframes — they were designed as a starting point. Using them without understanding what they do produces mediocre results, and leads many traders to dismiss SuperTrend as “not working” when the real issue is misconfiguration.
This complete guide covers the SuperTrend formula and what its parameters actually control, the optimal settings for every major trading style and market (including Bitcoin, Gold, and other commodities), the most effective combination strategies, multi-timeframe methodology, and the limitations of the standard SuperTrend that AI-enhanced versions address.
⚡ Key Takeaways
- Default settings (ATR 10, Multiplier 3.0) suit daily swing trading on moderate-volatility assets — using them on 5-minute intraday charts produces signals hours after meaningful moves have already occurred.
- ATR period controls reaction speed; multiplier controls band width — for scalping use (ATR 5, Mult 1.5), for intraday (ATR 7, Mult 2.0), for position trading (ATR 10–20, Mult 4–5).
- SuperTrend has no concept of market context and generates repeated false signals in sideways markets — always combine it with a trend quality filter such as ADX, EMA, or RSI.
- Multi-timeframe alignment dramatically reduces false signals: only take a signal when the macro (4H/Daily), intermediate (1H), and execution (15m/5m) timeframes all agree on direction.
- SuperTrend Pro+ (part of Quantzee's one-time $59.99 suite) automates dual-SuperTrend confluence, an ATR Entry/TP/SL ladder on every signal, and a built-in 5-timeframe dashboard.
What Is the SuperTrend Indicator?
SuperTrend was developed by Olivier Seban and published in his book “Tout le monde peut être riche” (Everyone Can Be Rich). It’s an Average True Range (ATR)-based trend-following indicator that plots a dynamic band above or below price to indicate the current trend direction. You can study the open-source reference implementation in the TradingView Pine Script documentation.
The SuperTrend Formula
SuperTrend calculates its upper and lower bands using the following logic:
Basic Band Calculation:
Upper Band = (High + Low) / 2 + (Multiplier × ATR)
Lower Band = (High + Low) / 2 − (Multiplier × ATR)
Final SuperTrend Value:
- If the current close is below the Upper Band, the trend is bearish — SuperTrend plots above price (resistance)
- If the current close is above the Lower Band, the trend is bullish — SuperTrend plots below price (support)
The ATR (Average True Range) measures the average daily range of price movement over the specified period. Multiplying ATR by the multiplier factor determines how far the SuperTrend band sits from the midpoint price.
What the Parameters Mean
ATR Period: The number of bars used to calculate the Average True Range. A shorter ATR period is more reactive to recent volatility but noisier. A longer ATR period is smoother but slower to respond to volatility changes.
- Short ATR (5–7): Fast, reactive, more signals, more false signals
- Standard ATR (10): Balanced — the default for most applications
- Long ATR (14–20): Smooth, fewer signals, less noise, more lag
Multiplier: Determines how many ATR units away from the midpoint the band is placed. A higher multiplier creates a wider band — price needs to move further to trigger a trend reversal signal. A lower multiplier creates a tighter band — more reversals, more signals, more noise.
- Low Multiplier (1.0–2.0): Tight band, many signals, frequent reversals, prone to whipsaws in ranging markets
- Standard Multiplier (3.0): Default — reasonable balance for daily charts
- High Multiplier (4.0–5.0): Wide band, fewer signals, strong trend confirmation only, misses early trend entries
SuperTrend Formula: Full Step-by-Step Calculation
The quick formula above is enough to recognize what SuperTrend is doing, but calculating it bar-by-bar requires one more piece: the indicator doesn’t just plot two static bands — it locks in a “final” band each period and only switches sides when price closes through it. Here is the complete calculation, step by step.
Step 1 — Calculate ATR. Compute the Average True Range over your chosen ATR Period (default 10). True Range for each bar is the greatest of: (High − Low), |High − Previous Close|, |Low − Previous Close|. ATR is the moving average of True Range over the period.
Step 2 — Calculate the Basic Bands.
Basic Upper Band = (High + Low) / 2 + (Multiplier × ATR)
Basic Lower Band = (High + Low) / 2 − (Multiplier × ATR)
Step 3 — Calculate the Final Bands. The Basic Bands recalculate every bar, but the Final Bands only move in the direction that tightens the trend (this is what stops SuperTrend from repainting or jumping backward against the trend):
Final Upper Band =
  IF (Basic Upper Band < Previous Final Upper Band) OR (Previous Close > Previous Final Upper Band)
  THEN Basic Upper Band
  ELSE Previous Final Upper Band

Final Lower Band =
  IF (Basic Lower Band > Previous Final Lower Band) OR (Previous Close < Previous Final Lower Band)
  THEN Basic Lower Band
  ELSE Previous Final Lower Band
In plain terms: the upper band can only move down (or reset up on a bearish flip), and the lower band can only move up (or reset down on a bullish flip). This one-way ratchet is what makes the Final Band behave like a trailing stop instead of a repainting line.
Step 4 — Determine the SuperTrend Value and Trend Flip.
IF Previous SuperTrend = Previous Final Upper Band AND Close <= Final Upper Band
  THEN SuperTrend = Final Upper Band   (trend stays bearish)

IF Previous SuperTrend = Previous Final Upper Band AND Close > Final Upper Band
  THEN SuperTrend = Final Lower Band   (trend flips to bullish)

IF Previous SuperTrend = Previous Final Lower Band AND Close >= Final Lower Band
  THEN SuperTrend = Final Lower Band   (trend stays bullish)

IF Previous SuperTrend = Previous Final Lower Band AND Close < Final Lower Band
  THEN SuperTrend = Final Upper Band   (trend flips to bearish)
This is the actual flip logic: SuperTrend doesn’t switch sides just because price touches a band — it switches only on a confirmed close through the currently active Final Band, and the newly active band becomes the opposite one. That’s why a SuperTrend flip always plots on the opposite side of price from where it was a moment ago.
Worked Example (ATR Period 10, Multiplier 3.0)
Assume a stock closes at $100 with a 10-period ATR of $2.00, and the bar’s High/Low midpoint is $100.
Basic Upper Band = 100 + (3.0 × 2.00) = 106.00
Basic Lower Band = 100 − (3.0 × 2.00) = 94.00
If the trend was already bullish and the previous Final Lower Band was 93.50, and price stayed above it, the Final Lower Band ratchets up to the new Basic Lower Band of 94.00 (since 94.00 > 93.50) — SuperTrend plots at 94.00, acting as a rising trailing stop. If instead the close on the next bar fell to 93.00 — below the 94.00 Final Lower Band — the trend flips bearish, and SuperTrend jumps to the new Final Upper Band, now plotting above price as resistance instead of below it as support.
This ratchet-and-flip mechanic is the entire indicator: an ATR-scaled trailing band on one side of price that only lets go and switches sides on a confirmed close through it — everything else (multiplier tuning, timeframe choice, MTF confluence) discussed elsewhere in this guide is about controlling how sensitive that flip is.
Reading Supertrend on a Chart — Visual Patterns
Knowing the formula is only half of using Supertrend effectively. Visual interpretation requires recognizing three distinct chart patterns that appear across all markets and timeframes.
The Clean Trend Pattern: Price moves consistently above the green Supertrend line (or below the red line) for an extended sequence of bars with no crossovers. This is the ideal Supertrend use case — the line acts as a dynamic trailing stop that follows the trend without requiring manual adjustment. In strong trending markets, clean trend patterns can persist for weeks on daily charts.
The Whipsaw Pattern: The Supertrend flips rapidly between green and red over a short sequence of bars, with each flip generating a small loss before reversing again. This almost always appears during consolidating, range-bound markets when price oscillates around the ATR band threshold. Widening the multiplier or moving to a higher timeframe typically resolves this pattern.
The Breakout Signal Pattern: Price is range-bound with the Supertrend line green but nearly flat, then suddenly accelerates. The Supertrend line kicks sharply away from price as ATR expansion widens the band, keeping the trailing stop well below the developing trend — traders who learn to spot this compressed-then-accelerating pattern are positioned early in the most powerful part of a trend move.
Understanding these three visual signatures explains why Supertrend performs differently across instruments: markets with persistent directional momentum produce clean trend patterns; mean-reverting or choppy markets produce whipsaw patterns that reduce net profitability without better volatility filtering.
Combining Supertrend with Other Tools
Supertrend is a trend direction filter, not a complete analytical system. Pairing it with complementary tools addresses its three core limitations: precise entry timing, trend strength validation, and volatility context.
Supertrend + RSI: RSI confirms momentum alignment before acting on a Supertrend flip. A bullish flip combined with RSI moving from below 50 to above 50 confirms momentum is aligned with the new direction.
Supertrend + Volume: Low volume during a flip often indicates a false signal driven by a news spike rather than genuine selling/buying pressure. Above-average volume on the flip bar strengthens the signal and reduces whipsaw probability.
Supertrend + VWAP (intraday): Combining Supertrend direction with VWAP position (price above VWAP = buying pressure, below = selling pressure) creates a two-factor filter that reduces signal count while keeping exposure to the strongest directional moves.
Supertrend + CPR (Central Pivot Range): CPR defines session support and resistance from the prior period’s High-Low-Close. A bullish Supertrend signal that forms while price is above CPR’s central pivot provides both directional bias and structural level confirmation that pure trend-followers miss.
Default Settings: What They Mean and When They Work
Default SuperTrend Settings: ATR Period 10, Multiplier 3.0
These defaults work best on:
- Daily charts with moderate volatility assets
- Assets with stable, sustained trends
- Markets where overnight gaps are relatively uncommon
They underperform on:
- Intraday charts (too slow to react to intraday trend changes)
- High-volatility periods (multiplier too wide to capture trend shifts)
- Range-bound markets (no settings make SuperTrend effective in sideways conditions — this is a structural limitation)
- Crypto assets (higher baseline volatility means the default band is often too narrow or too wide depending on regime)
The most common mistake traders make with SuperTrend defaults: using ATR 10, Multiplier 3.0 on a 5-minute chart. The result is an indicator that barely registers intraday moves as trend changes, generating signals hours after meaningful directional shifts have occurred.
Best SuperTrend Settings for Different Trading Styles
Intraday Trading (5-Minute Chart)
Recommended settings: ATR Period 7, Multiplier 2.0
Why: On 5-minute charts, you’re looking for trend changes that develop over 20–40 bars (100–200 minutes of trading). A shorter ATR period keeps the indicator responsive to intraday volatility without being overly noisy. Multiplier 2.0 tightens the band enough to capture trend reversals within a trading session.
How to use on 5-min charts:
- Wait for the SuperTrend to flip direction (color change from red to green or vice versa)
- Confirm the flip with a close above/below the SuperTrend level — not just a brief penetration
- Use VWAP as the higher-level filter: only take long signals when price is above VWAP, only take shorts below VWAP
- Initial stop-loss is the SuperTrend level at entry; trail as the SuperTrend moves
When to avoid: In the first 15 minutes after any major market open or news release (extreme volatility and price discovery). Mid-session typically produces the cleanest SuperTrend signals on 5-minute charts.
Swing Trading (Daily Chart)
Recommended settings: ATR Period 10, Multiplier 3.0
The defaults actually work well for swing trading on daily charts. The 10-period ATR captures roughly two weeks of volatility context, and the 3.0 multiplier provides enough buffer to hold through normal daily noise without getting stopped out on minor retracements.
How to use on daily charts:
- SuperTrend signals on daily charts are higher conviction — expect 5–20 trading day holds
- Enter on the first close after a SuperTrend flip with confirming volume
- Use the SuperTrend level as a trailing stop: raise it as price moves in your favor
- Layer with weekly EMA trend filter (50 EMA or 200 EMA) to avoid taking trades against the broader trend
Alternative aggressive swing settings: ATR 7, Multiplier 2.5 This combination catches trend changes slightly earlier with some additional noise tradeoff. Useful if you prefer more active position management.
Scalping (1-Minute Chart)
Recommended settings: ATR Period 5, Multiplier 1.5
On 1-minute charts, you’re looking for very short-term directional moves lasting 5–20 bars. The short ATR period keeps the indicator calibrated to recent 5–10 minute volatility, and the tight multiplier (1.5) allows the indicator to register directional changes quickly.
Important caveats for 1-minute scalping:
- False signals are significantly more common on 1-minute charts — the signal-to-noise ratio is much lower
- The tight multiplier means more frequent SuperTrend flips — avoid trading every flip; wait for price to confirm the new direction with at least 2–3 bars moving in the signal direction
- Volume confirmation is essential: only trade SuperTrend flips that occur with above-average volume
- Spread and slippage have more impact at this timeframe — test with your broker’s actual execution costs included
Long-Term Position Trading (Weekly Chart)
Recommended settings: ATR Period 10, Multiplier 4.0–5.0
For position traders holding weeks to months, a wider multiplier prevents being whipsawed out of trends during normal weekly volatility fluctuations.
- ATR 10, Multiplier 4.0: Catches major trend changes with moderate lag
- ATR 10, Multiplier 5.0: Only registers major structural trend shifts — for the longest-duration positions
These settings generate very few signals per year on most assets — typically 4–8 on a liquid instrument’s weekly chart. Each signal, however, tends to represent a genuinely significant trend change.
SuperTrend for Crypto: Bitcoin and High-Volatility Digital Assets
Cryptocurrency markets present unique challenges for SuperTrend because of their elevated and highly variable baseline volatility. A BTC/USD chart can move 5–10% in a single day during active trending phases — a range that would be extreme over weeks in traditional equity markets.
The core adjustment principle for crypto: wider multipliers, shorter ATR periods.
BTC (Bitcoin) Intraday Settings (1H Chart)
Recommended settings: ATR Period 10, Multiplier 3.0–3.5
On the 1-hour BTC chart, the standard ATR 10 period is kept for smoothness, but the multiplier is nudged to 3.0–3.5 rather than the equity default. This wider band accounts for Bitcoin’s higher intraday volatility range and prevents the SuperTrend from flipping on every 2–3% pullback within a sustained move.
Practical observations on BTC:
- SuperTrend works best during Bitcoin’s trending phases — the 2023–2026 cycle has shown extended multi-week trends where ATR-based trailing stops capture large moves
- During consolidation (low-ATR periods following a major move), BTC can create repeated false SuperTrend flips; this is not a settings failure — it is the market regime
- Combining SuperTrend with volume analysis on BTC is particularly useful: SuperTrend flips accompanied by volume spikes above the 20-bar average are significantly more reliable than low-volume flips
BTC Swing Trading (Daily Chart)
Recommended settings: ATR Period 14, Multiplier 3.5
The longer ATR period (14 vs the standard 10) smooths out Bitcoin’s elevated daily volatility, preventing the SuperTrend from reacting to short-term price swings within a macro trend. The 3.5 multiplier further widens the band for the same reason.
Example analytical framework (educational illustration, not investment advice): On BTC/USD daily charts, a SuperTrend flip from bearish to bullish when ATR is expanding (rising daily ranges) historically corresponds to early-trend momentum. Conversely, a flip when ATR is already elevated and contracting may indicate a volatility exhaustion move rather than a new sustained trend. This distinction — ATR expansion vs contraction at the time of the flip — is the single most useful contextual factor for evaluating Bitcoin SuperTrend signals.
Altcoins and Higher-Volatility Crypto
For altcoins with higher volatility than BTC (ETH, SOL, and other large-cap alts), widen the multiplier further to 4.0–5.0 on daily charts, or accept more noise with a 3.0 multiplier and filter by BTC direction (only trade altcoin long signals when BTC SuperTrend is also bullish).
Note: All examples in this section are analytical illustrations of how the SuperTrend indicator behaves on historical data. Nothing here constitutes investment advice or a recommendation to trade any asset. Conduct your own analysis and apply appropriate risk management.
SuperTrend for Gold (XAUUSD) and Commodities
Gold (XAUUSD) occupies a middle ground between equity indices and crypto from a volatility standpoint. Its daily ATR tends to be moderate relative to price, but Gold is susceptible to sharp, high-conviction moves driven by macro catalysts (Federal Reserve policy, dollar strength, geopolitical risk) — which is precisely where SuperTrend shines.
Gold Intraday (15-Minute Chart)
Recommended settings: ATR Period 7, Multiplier 2.5
The 15-minute Gold chart is the most popular intraday timeframe for XAUUSD. With ATR 7 and Multiplier 2.5, the SuperTrend balances responsiveness to Gold’s intraday swings while filtering out minor noise from spread and thin liquidity periods.
XAUUSD-specific characteristics to factor in:
- Gold most often trends clearly during the London-to-New-York overlap session (13:00–17:00 UTC); SuperTrend signals during this window have historically produced cleaner follow-through
- Outside active sessions (Asian session in particular), Gold can range narrowly, causing SuperTrend to generate unreliable signals — filter by session time
- Pre-Fed announcement periods (FOMC days) typically show compressed ATR, followed by an ATR spike at the announcement. Avoid acting on SuperTrend signals within 30 minutes of a major Fed release; wait for the ATR to stabilize before trusting the new direction
Gold Daily Chart (Swing/Position)
Recommended settings: ATR Period 10, Multiplier 3.0
Standard settings work well for Gold on the daily chart. Gold’s trending periods — especially during risk-off macro environments — can sustain for weeks to months, making daily-chart SuperTrend an effective trailing stop mechanism for longer holds.
Analytical example (educational, not advice): The June 2026 Gold rally — which SuperTrend Pro+ captured with a confluence long signal at approximately $4,090–$4,120 (see the SuperTrend Pro+ Gold signal case study) — illustrates how the indicator can track a sustained macro move. The dual-SuperTrend confluence approach (fast + slow both aligning) filtered the prior short signals at lower-highs before confirming the sustained long. The ATR ladder auto-plotted TP levels at $4,194/$4,228/$4,261 from the entry zone, giving a structured, rule-based trade plan without discretion.
Crude Oil and Other Commodities
Crude oil (WTI, BRENT) and commodities like Silver (XAGUSD) respond well to SuperTrend because commodity markets are inherently trend-prone — supply-demand imbalances can persist for extended periods, creating the sustained directional moves SuperTrend is designed to track.
Crude Oil (1H chart): ATR Period 7, Multiplier 2.5 — similar rationale to Gold; the extra multiplier width accounts for crude’s higher intraday percentage swings relative to Gold.
Silver (XAGUSD, daily): ATR Period 10, Multiplier 3.5 — Silver is more volatile than Gold, so the wider multiplier prevents excessive noise in the SuperTrend band during sharp intraday moves.
Note: All examples above are educational illustrations of analytical methodology. They are not investment advice, trading recommendations, or guarantees of any outcome. Always conduct your own research and apply your own risk management.
Multi-Timeframe SuperTrend Methodology
One of the most powerful and underused approaches to SuperTrend is multi-timeframe (MTF) analysis: using multiple SuperTrend instances on different timeframes simultaneously to confirm trade direction before acting on a chart-timeframe signal.
The Three-Timeframe Framework
The MTF approach uses three timeframes in a hierarchy:
-
Macro timeframe (4H or Daily): Defines the primary trend direction. Trade ONLY in the direction of this SuperTrend. This is the filter — if the daily SuperTrend is bearish, do not take long signals on lower timeframes regardless of how compelling they look.
-
Intermediate timeframe (1H): Refines the entry timing within the macro direction. An intermediate-timeframe SuperTrend flip that aligns with the macro trend confirms a meaningful entry zone.
-
Execution timeframe (15min or 5min): The specific entry candle. A SuperTrend flip here in the direction of both the macro and intermediate trend is the actionable signal.
Why this works: False signals on any single timeframe are filtered by the higher timeframe’s directional bias. A SuperTrend flip on a 5-minute chart that goes against the 4-hour trend is noise. A flip that aligns with both the 4-hour and 1-hour trends has genuine confluence.
Practical MTF Setup on TradingView
- Open your 15-minute (execution) chart on BTC/USD or XAUUSD
- Add three SuperTrend instances:
- Instance 1 (macro): Set your indicator to pull the Daily SuperTrend using Pine’s
request.security()function, or simply open the daily chart separately for reference - Instance 2 (intermediate): Use the default settings (ATR 10, Multiplier 3.0) calibrated to your 1-hour timeframe
- Instance 3 (execution): Use ATR 7, Multiplier 2.0 on the 15-minute chart
- Instance 1 (macro): Set your indicator to pull the Daily SuperTrend using Pine’s
- Only take a signal when all three are aligned in the same direction
- Stop-loss = the execution-timeframe SuperTrend level at signal bar close
MTF Signal Quality Scoring
Rank your signals before committing:
- 3-timeframe alignment (macro + intermediate + execution all agree): Highest conviction — full position size within your risk parameters
- 2-timeframe alignment (macro + execution agree, intermediate is neutral): Moderate conviction — reduced position size
- 1-timeframe (execution only): Low conviction — pass or paper trade only
SuperTrend Pro+ and the MTF Dashboard
The SuperTrend Pro+ indicator from Quantzee includes a built-in multi-timeframe trend dashboard that displays the slow SuperTrend direction across five user-selectable timeframes in a compact table — giving you the full MTF picture without manually opening multiple chart windows. The default dashboard shows 5m, 15m, 1H, 4H, and Daily direction simultaneously, letting you assess alignment instantly before acting on a chart-timeframe signal. This is the same analytical approach described above, built directly into the indicator.
SuperTrend Trading Strategies
Strategy 1: Basic Trend Following
The simplest SuperTrend strategy: trade in the direction of the indicator.
Rules:
- Buy when SuperTrend flips from red to green (bullish)
- Sell/short when SuperTrend flips from green to red (bearish)
- Initial stop-loss: SuperTrend level at entry
- Trail stop using the SuperTrend band as price moves in your direction
- Exit when SuperTrend reverses direction
Best timeframes: 15-minute, 1-hour, daily
Strength: Simple, clearly defined rules, works well in trending markets Weakness: Generates significant losses in ranging, sideways markets where SuperTrend flips repeatedly without establishing a trend
Strategy 2: SuperTrend Reversal Entry
Rather than entering immediately on a SuperTrend flip, wait for a pullback to the SuperTrend level after the initial direction change.
Rules:
- SuperTrend flips to bullish (green)
- Wait for price to pull back toward (not through) the SuperTrend support level
- Enter long when price bounces from the SuperTrend level with a bullish candle
- Stop-loss: below the SuperTrend level at entry
- Target: 2–3× the ATR value from entry
Why it works: The initial flip often occurs on a momentum spike — entering at the pullback provides a better risk-reward ratio and confirmation that the new trend level is acting as support.
Strategy 3: SuperTrend + RSI Combination
Combine SuperTrend for trend direction with RSI for entry timing.
Long entry rules:
- SuperTrend is bullish (green, below price)
- RSI drops to the 40–50 zone (pullback within an uptrend, not full reversal)
- RSI turns back up from the 40–50 zone
- Enter long
Short entry rules:
- SuperTrend is bearish (red, above price)
- RSI rises to the 50–60 zone (bounces within a downtrend)
- RSI turns back down from the 50–60 zone
- Enter short
Why it works: SuperTrend ensures you’re trading with the trend. RSI timing ensures you’re entering on a pullback rather than a breakout — typically providing a 20–40% improvement in entry price.
Strategy 4: SuperTrend + MACD Momentum Confirmation
Use SuperTrend for direction and MACD for momentum confirmation.
Long entry rules:
- SuperTrend is bullish
- MACD line is above the signal line (or crossing above)
- MACD histogram is expanding (increasing momentum)
- Enter long
Short entry rules:
- SuperTrend is bearish
- MACD line is below the signal line
- MACD histogram is expanding (negative momentum increasing)
- Enter short
Why it works: MACD confirmation filters out SuperTrend signals that occur during momentum exhaustion — catching only the high-momentum segments of trends where the probability of continuation is highest.
Stop-Loss Placement with SuperTrend
The SuperTrend level itself is the natural stop-loss placement. For aggressive traders:
- Stop-loss = SuperTrend level at entry (tight, most stops hit)
For more conservative traders:
- Stop-loss = SuperTrend level at entry + 0.5 × ATR (adds a buffer zone)
As trade moves in your direction, trail the stop-loss by updating it to the current SuperTrend level each bar. This creates an asymmetric risk profile: maximum risk is defined by ATR, while profit potential is uncapped.
SuperTrend’s Limitations: What the Standard Indicator Can’t Do
Understanding where SuperTrend fails is as important as knowing when it works.
1. Sideways and ranging markets SuperTrend is a pure trend-following indicator. In sideways, range-bound markets, it generates repeated false signals as price oscillates around the band. This is not a settings problem — no combination of ATR and multiplier makes SuperTrend effective in the absence of a trend. When ATR is low and the market is ranging, SuperTrend signals should be filtered out entirely.
2. The ATR lag problem ATR itself is a lagging measure of volatility — it’s calculated from completed candles and represents average volatility over the ATR period, not current volatility. When volatility spikes suddenly (macro news event, liquidity crisis, crypto leverage unwind), the ATR hasn’t yet updated to reflect the new environment, and the SuperTrend band may be too tight or too wide for current conditions.
3. Fixed parameters in dynamic markets The standard SuperTrend uses fixed ATR period and multiplier settings. Markets are not static — volatility regimes change, correlations shift, and the optimal SuperTrend parameters for Q1 may not be optimal for Q3. Manual parameter optimization is time-consuming and often results in curve-fitting to historical conditions that don’t persist.
4. No signal quality differentiation A SuperTrend flip in a strong trend looks identical to a SuperTrend flip in a choppy range from a signal presentation standpoint. The indicator doesn’t tell you whether the current signal is high-confidence or low-confidence — it just flips.
Introducing SuperTrend Pro+: The Next Generation
The SuperTrend Pro+ indicator — part of the Quantzee AI trading indicator suite — builds four structured layers on top of the standard SuperTrend formula to address its core limitations. It is an analytical tool designed to help traders make more informed, structured decisions; it does not provide investment advice or guarantee any trading outcome.
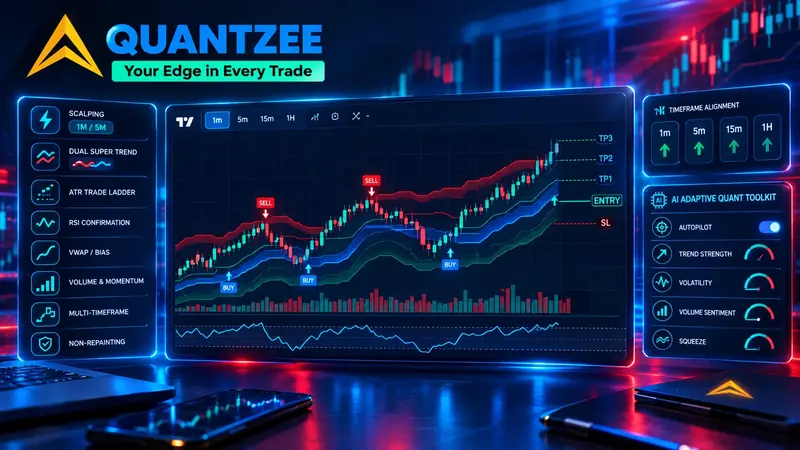
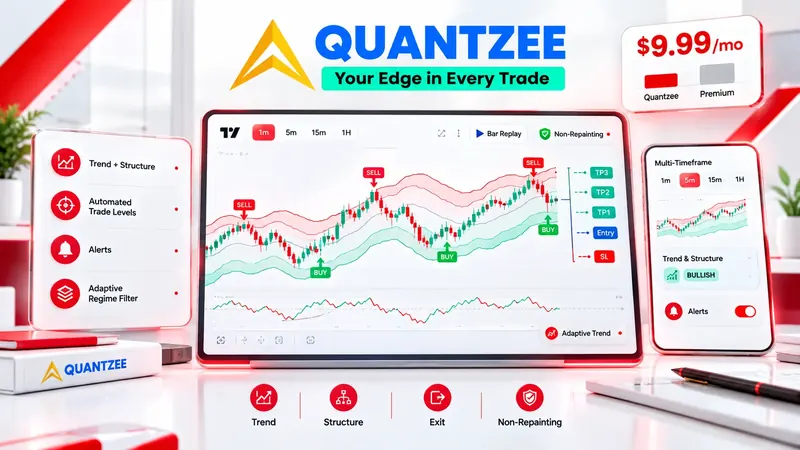
1. Dual-SuperTrend Confluence SuperTrend Pro+ runs two SuperTrend instances simultaneously: a fast one (default factor 2, ATR 10) and a slow one (default factor 4, ATR 20). The zone between them is shaded only when both agree on direction, and a signal fires only on the bar where both first align — not on every fast-line flip. This filters out a large share of whipsaw signals that a lone SuperTrend produces in ranging markets on any asset class — stocks, crypto, Gold, or forex.
2. Automatic ATR Trade-Level Ladder On each confluence signal, the script plots the entry price, three take-profit levels at configurable ATR multiples (default 1x / 2x / 3x ATR), and a stop-loss at the slow SuperTrend line. These are labeled horizontal rays extending until the next signal — a complete, objective analytical trade plan rather than a bare directional arrow. The ladder is a visualization of ATR-based levels, not a guarantee of any outcome.
3. Trend-Strength Gradient The fast SuperTrend line’s opacity reflects the distance between price and the slow SuperTrend, normalized by ATR. A fading line warns that the trend is losing energy before any flip occurs — an early-exit analytical cue that standard SuperTrend coloring doesn’t provide.
4. Multi-Timeframe Trend Dashboard A compact table shows the slow SuperTrend direction across five user-selectable timeframes simultaneously. The default configuration covers 5m, 15m, 1H, 4H, and Daily — giving you full multi-timeframe trend alignment at a glance before committing to a chart-timeframe signal. This implements the MTF methodology described earlier directly within a single indicator.
SuperTrend Pro+ is non-repainting by design. Confluence signals are evaluated on the chart timeframe and the trade-level ladder is drawn only on confirmed bar closes. Multi-timeframe data is requested with lookahead off, and SuperTrend by construction does not repaint historical flips.
For a real-world analytical case study showing how SuperTrend Pro+ applied its dual-confluence and ATR ladder to Gold (XAUUSD) in June 2026, see the SuperTrend Pro+ Gold signal case study.
Explore SuperTrend Pro+ in detail | See Quantzee pricing
How Quantzee SuperTrend Pro+ Improves on the Standard
The SuperTrend Pro+ indicator from Quantzee’s AI trading indicator suite addresses the standard SuperTrend’s core limitations through dual-SuperTrend confluence and AI-enhanced volatility adjustment.
Volatility-adaptive ATR: Rather than using a fixed ATR period, SuperTrend Pro+ dynamically adjusts its ATR calculation window based on the current volatility regime. In high-volatility conditions, the lookback adapts to prevent premature signal generation. In low-volatility conditions, it tightens to maintain signal sensitivity. The result is more consistent signal quality across different market environments.
Dual-SuperTrend confluence: Rather than relying on a single ATR band calculation, SuperTrend Pro+ runs a fast and a slow SuperTrend and only signals when both agree on direction. This reduces the false-signal problem in sideways markets — when the two lines disagree (as they do in ranging conditions), signal generation is suppressed.
Signal confidence scoring: SuperTrend Pro+ includes a confidence metric for each signal, allowing traders to differentiate between high-conviction and borderline trend signals. This addresses the standard SuperTrend’s inability to distinguish signal quality.
Non-repainting architecture: All signals in SuperTrend Pro+ are generated on bar close and locked — they never retroactively change, unlike some enhanced SuperTrend versions that use future data in their calculations.
“Non-repainting signals and adaptive trend logic helped filter bad trades in forex.” — Jason Smith ⭐⭐⭐⭐⭐
Step-by-Step TradingView Setup for SuperTrend
Using the Free Built-In SuperTrend:
- Open TradingView and navigate to your preferred chart
- Click the “Indicators” button in the top toolbar (or press ”/”)
- Search for “Supertrend” in the search bar
- Select “Supertrend” from the built-in indicators list (it will show the TradingView logo)
- Click the settings gear icon next to the indicator name in the chart
- Adjust ATR Length and Factor (multiplier) to your desired values based on the settings guide above
- Click OK
Adding Quantzee SuperTrend Pro+:
- Buy Quantzee at Quantzee.com/pricing — one payment of $59.99
- The Pine Script source for all six indicators is emailed to you within about a minute. Open
04-SuperTrend-Pro-Plus.pinein any text editor and copy all of it - In TradingView, click Pine Editor at the bottom of the screen, clear the sample code, and paste the SuperTrend Pro+ code in
- Click Save, give it a name, then click Add to chart. It will also appear under Indicators → My scripts for any future chart
- For SuperTrend Pro+, the confluence system and ATR ladder configure automatically
Setting Up Alerts with SuperTrend:
- Right-click on the SuperTrend indicator on your chart
- Select “Add Alert on Supertrend…”
- Configure the condition: “Crossing Up” for bullish signals, “Crossing Down” for bearish
- Set notification method (email, mobile push, webhook)
- For automated trading integration, use the webhook URL option to connect to your execution platform
- For SuperTrend Pro+: use the built-in alert conditions — Long Confluence, Short Confluence, Fast Flip Up, Fast Flip Down. Set to “Once per bar close” for confirmed, non-repainting signals.
SuperTrend Settings Quick Reference
| Trading Style | Market / Asset | Timeframe | ATR Period | Multiplier |
|---|---|---|---|---|
| Scalping | Any | 1 min | 5 | 1.5 |
| Intraday | Stocks, Forex, Indices | 5 min | 7 | 2.0 |
| Intraday | Gold (XAUUSD) | 15 min | 7 | 2.5 |
| Intraday | Bitcoin (BTC) | 1H | 10 | 3.0 |
| Swing Trading | Forex, Large-cap stocks | 1H | 10 | 3.0 |
| Swing Trading | Bitcoin (BTC) | Daily | 14 | 3.5 |
| Swing Trading | Gold / Silver | Daily | 10 | 3.0 |
| Position Trading | Any | Weekly | 20 | 4.0–5.0 |
Explore Quantzee Indicators
- SuperTrend Pro+ — dual-SuperTrend confluence that filters chop, with an automatic ATR Entry/TP/SL ladder on every signal and a built-in MTF dashboard
- AI Adaptive Quant Toolkit — self-tuning signals, overlays & dashboard — no repainting
- SuperTrend Pro+ — volatility-adjusted trend signals
- Adaptive AI Oscillation Engine — momentum & divergence detection
View all indicators · See pricing