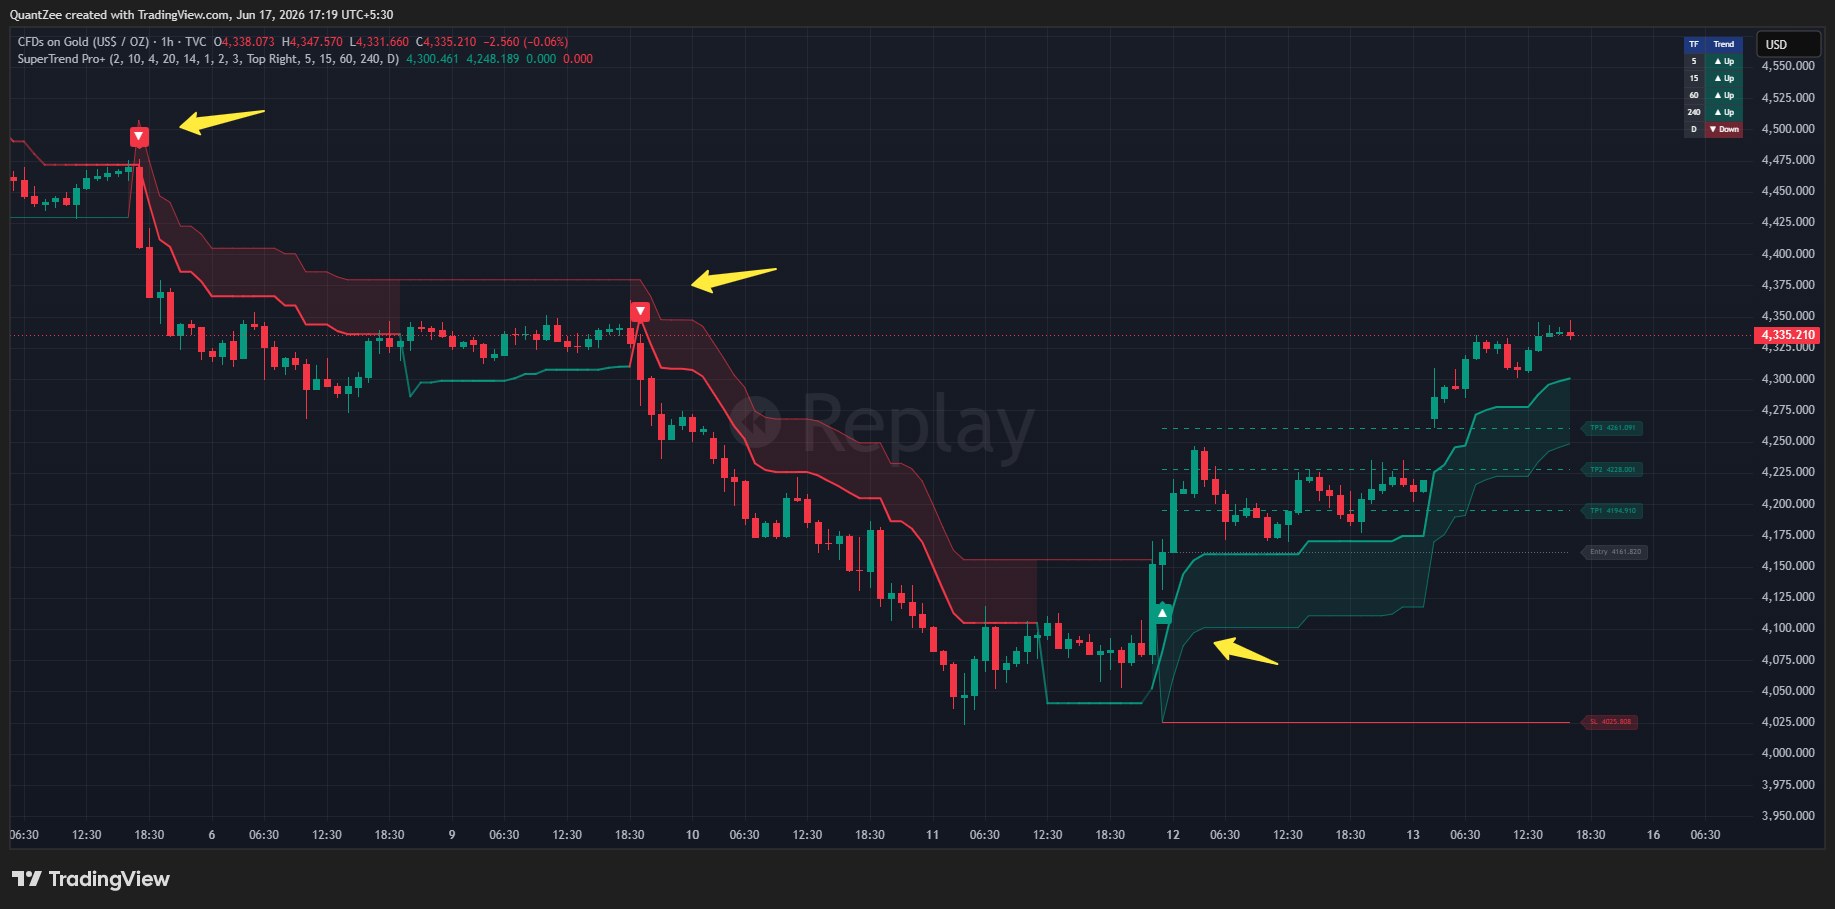
Most trend indicators do half the job: they flip colour, print an arrow, and leave you to guess the entry, stop and targets. The hourly Gold chart below shows the other half — three separate SuperTrend Pro+ confluence signals, each one calling the turn cleanly, with the third arriving complete with an entry, three take-profit levels, a stop-loss and a multi-timeframe read already drawn on the screen.
This is a chart-by-chart breakdown of what the indicator actually plotted on CFDs on Gold (US$/oz), 1-hour chart (TVC), over roughly ten trading days from 6–17 June 2026 — every level read directly off the screenshot, nothing invented or back-fitted. It is an analytical case study of how the tool behaves, not a trade recommendation or a claim about future results.
⚡ Key Takeaways
- SuperTrend Pro+ printed three confluence signals on hourly Gold in June 2026 — two shorts at ~4,500 and ~4,360 that rode the down-leg, then one long at the ~4,090 base, each one calling the turn correctly.
- The long signal auto-plotted a complete ATR ladder — Entry 4,161.82, TP1 4,194.91, TP2 4,228.00, TP3 4,261.09, SL 4,025.81 — with risk defined before the trade, targets spaced by volatility not guesswork.
- Dual-SuperTrend confluence (fast factor 2 + slow factor 4) fires only when both first agree on direction — filtering the range-bound whipsaws a single SuperTrend line produces.
- The multi-timeframe dashboard read 5m/15m/60m/240m all Up with Daily still Down at the long signal — context that argues for managing with the ladder and trailing stop rather than holding open-ended.
- SuperTrend Pro+ is non-repainting by design — the two shorts and one long visible after the fact are the same signals that were present in real time on closed candles.
TL;DR — Key Takeaways
- SuperTrend Pro+ printed three confluence signals on hourly Gold and each one called the move correctly: two short (sell) signals down the decline, then one long (buy) signal at the base.
- Short signal 1 fired at the top near ~4,500 (the first lower-high), as both SuperTrends flipped bearish — price then stair-stepped lower.
- Short signal 2 fired at the next lower-high near ~4,360, confirming the down-leg continued toward the ~4,090 base.
- Long signal fired at the base near ~4,090–4,120: both SuperTrends flipped up together and the indicator auto-plotted a full ATR ladder — Entry 4,161.82, TP1 4,194.91, TP2 4,228.00, TP3 4,261.09, SL 4,025.81.
- Price then climbed through the targets, trading in the 4,330s by capture (17 June 2026, 17:19 IST).
- The multi-timeframe dashboard read 5m / 15m / 60m / 240m = Up and Daily = Down at the long signal.
- SuperTrend Pro+ is analytical software, not investment advice. The signals are visualisations of ATR-based math, not guarantees — markets can reverse before any target, which is exactly why the stop-loss exists.
What Did SuperTrend Pro+ Signal on Gold in June 2026?
On the hourly Gold (US$/oz) chart, SuperTrend Pro+ plotted three confluence signals across the window — two shorts and one long — and each one marked the turn correctly. Two ▼ short signals fired at successive lower-highs (~4,500 then ~4,360) and rode the decline down; one ▲ long signal then fired at the base (~4,090–4,120), where the indicator auto-drew an ATR Entry/TP/SL ladder, and price rallied into the 4,330s.
The screenshot is the SuperTrend Pro+ overlay running on hourly Gold with its default configuration — fast SuperTrend (factor 2, ATR 10), slow SuperTrend (factor 4, ATR 20), an ATR trade-level ladder at 1×/2×/3× ATR, and a multi-timeframe dashboard tracking the 5m, 15m, 60m, 240m and Daily timeframes. The point of the chart is not bravado — it is what the indicator gave you to work with at each signal, before any of the follow-through was known.
The Two Short Signals — Riding the Down-Leg
Reading the chart left to right, Gold began the window rolling over from its highs, and SuperTrend Pro+ caught the decline with two distinct short-side confluence signals:
- Short signal 1 — near 4,500. At the first lower-high, both the fast and slow SuperTrends flipped bearish together, the zone between them shaded red, and a ▼ confluence marker printed right at the peak (~4,500). Price then worked steadily lower — the classic stair-step a trend system is built to ride.
- Short signal 2 — near 4,360. After a small relief bounce, Gold rolled over again into a lower-high around 4,360, and a second ▼ confluence marker fired. The red zone held all the way down to the base, confirming the down-leg rather than fading it.
Both shorts did exactly what a confluence trend signal is designed to do: enter on the side both SuperTrends agree on, and stay on that side until the structure changes. Together they framed the entire decline from ~4,500 down to the ~4,090 base.
The short entries (~4,500 and ~4,360) are read off the bar where the ▼ markers print on the chart. SuperTrend Pro+ would draw its mirror-image ATR ladder for each short the same way it does for the long; the labelled ladder visible in this screenshot is the one attached to the long signal below.
The Long Signal, Level by Level
Around the 4,090–4,120 base, Gold stopped making new lows, the fast and slow SuperTrends flipped up together, the zone between them turned green, and a ▲ marker fired on the bar where both trends first agreed. On that same bar, SuperTrend Pro+ auto-plotted the complete ATR ladder shown on the right of the chart. These are the exact labels on the chart — nothing rounded or assumed:
| Level | Value (US$/oz) | What it is |
|---|---|---|
| Entry | 4,161.820 | The bar where fast + slow SuperTrend first agreed (long) |
| TP1 | 4,194.910 | First take-profit, ~1× ATR above entry |
| TP2 | 4,228.001 | Second take-profit, ~2× ATR above entry |
| TP3 | 4,261.091 | Third take-profit, ~3× ATR above entry |
| SL | 4,025.808 | Stop-loss, anchored to the slow SuperTrend line |
A few things are worth drawing out, because they are the design of the system rather than the outcome:
- The risk was defined before the trade. Entry 4,161.82 against a stop at 4,025.81 is roughly 136 points of defined risk. You did not have to decide where the stop went — the slow SuperTrend placed it for you, below the structure that would invalidate the trend.
- The targets are spaced by volatility, not by hope. TP1→TP2→TP3 step up in roughly equal ~33-point increments because each is an ATR multiple. This is the difference between a plan and a round-number wish.
- It is a scale-out map, not a single exit. The ladder is built so you can bank partial size at TP1/TP2/TP3 and trail the rest against the rising slow SuperTrend — and from this long, price did climb back through the plotted targets into the 4,330s by the time of capture (17 June 2026, 17:19 IST; live bar O 4,338.07 / H 4,347.57 / L 4,331.66 / C 4,335.21).
Important: the ladder is a visualisation of ATR-based levels, not a guarantee of outcomes. Markets can and do reverse before any target; the SL exists precisely because they can.
Why Did the Multi-Timeframe Dashboard Matter Here?
At the long signal, the multi-timeframe (MTF) dashboard confirmed that four of five timeframes had already turned up, aligning the hourly long with lower- and mid-timeframe structure. The lone Daily ▼ Down flagged honestly that the higher timeframe had not yet flipped — useful context for managing the trade rather than treating it as open-ended.
In the top-right of the chart, the MTF trend dashboard read:
| Timeframe | Trend |
|---|---|
| 5m | ▲ Up |
| 15m | ▲ Up |
| 60m | ▲ Up |
| 240m (4H) | ▲ Up |
| Daily | ▼ Down |
This is a textbook example of why the dashboard exists. The four aligned timeframes made the hourly long structurally stronger than a counter-trend one, per the indicator’s own design notes. The lone Daily ▼ Down is just as useful: it marked the rally as a recovery inside a daily down-leg — the kind of context that argues for managing with the ladder and trailing stop. The dashboard does not tell you what to do; it gives you the full picture so the decision is yours, made with eyes open.
What Is SuperTrend Pro+?
SuperTrend Pro+ is a dual-SuperTrend confluence indicator from Quantzee’s AI-powered indicator suite for TradingView. The SuperTrend maths underneath is the standard Average True Range (ATR)-based formula — Quantzee did not reinvent the wheel. What it adds is four layers that turn a single line into a full, objective trade plan.
- Dual-SuperTrend confluence. A fast SuperTrend (factor 2, ATR 10) and a slow one (factor 4, ATR 20) run together. The zone between them shades only when both agree on direction, and a signal fires only on the bar where they first align — not on every fast-line flip. This filters out a large share of the whipsaws a lone SuperTrend produces in chop.
- Automatic ATR trade-level ladder. Every confluence signal plots Entry, TP1, TP2, TP3 (default 1×/2×/3× ATR) and a stop at the slow SuperTrend — drawn as labelled rays, exactly like the Gold chart above.
- Trend-strength gradient. The fast line’s opacity fades as the trend loses energy, giving an early-exit cue before any flip.
- Multi-timeframe dashboard. The compact table you saw — slow-SuperTrend direction across five user-selectable timeframes — so you can check alignment before committing.
And because it is built non-repainting by design: confluence is evaluated on the chart timeframe, the ladder is drawn only on confirmed bar closes, and higher-timeframe data is requested with lookahead off. The arrows you saw — both shorts and the long — were the arrows that were always there; none appeared after the fact.
If you want the deeper mechanics of SuperTrend parameters first, our SuperTrend indicator settings guide covers ATR period and multiplier behaviour across every trading style.
How Do You Read a SuperTrend Pro+ Signal Like This Yourself?
Using the Gold example as a template, the workflow SuperTrend Pro+ is designed around is a five-step, no-guessing routine: read the zone colour, take the entry on confluence, manage with the ATR ladder, watch the trend-strength gradient, and check the MTF dashboard for alignment.
- Trade the zone. Green shading = both SuperTrends bullish, red = both bearish, no shading = the timescales disagree (stand aside or reduce size).
- Take the entry on confluence. The ▲/▼ marker shows the exact bar where confluence began — the highest-conviction moment of the system. On Gold that meant two ▼ shorts down the trend and one ▲ long at the base.
- Manage with the ladder. Scale out at TP1/TP2/TP3, or hold runners against the slow SuperTrend line as a natural trailing stop.
- Watch the gradient. When the fast line visibly fades while price stalls near a target, the trend is decelerating — a reasonable place to tighten stops.
- Check the dashboard. Signals that agree with the higher timeframes (here, 5m–240m all up) are structurally stronger; a lone disagreeing timeframe (here, Daily) is a risk flag, not a veto.
None of these steps require you to guess a level. That is the entire premise: an objective, repeatable trade plan, the same on a 3-minute chart as on a daily structure.
A Note on Expectations
SuperTrend Pro+ is analytical software — a charting and decision-support tool. It is not investment advice, it does not place trades, and it makes no promise about results. The three Gold signals above are a single, illustrative chart read after the fact; they are shown to explain how the tool plots and sequences signals, not to suggest any outcome is typical or repeatable. Trend systems lose in ranging conditions, the stop-loss exists because targets are not guaranteed, and every trader’s risk tolerance and position sizing are their own. Always do your own research.
Frequently Asked Questions
Explore Quantzee Indicators
- SuperTrend Pro+ — dual-SuperTrend confluence with an automatic ATR Entry/TP/SL ladder on every signal
- SuperTrend Fusion — volatility-adjusted, multi-signal SuperTrend
- AI Adaptive Quant Toolkit — self-tuning signals, overlays and dashboard, no repainting
- AI TrendPulse — adaptive trend and momentum detection
View all indicators · See pricing