Most traders discover the “affordable TradingView indicators” search the same way: they try a $50 or $100 per month premium suite, find it underwhelming, and wonder whether there is a middle path between the free built-ins that barely keep up and the flagship subscriptions that cost more than a utility bill. There is — but finding it requires knowing what the money is actually buying.
This guide explains what separates genuinely affordable indicators from cheap ones, what to look for before paying anything, how to calculate whether a subscription can justify its cost at your account size, and which indicators across the price spectrum actually deliver in live trading.
If you are specifically researching whether premium indicators are worth the cost at all, our companion article Do TradingView Indicator Subscriptions Actually Pay for Themselves? runs the break-even math in detail.
⚡ Key Takeaways
- At $9.99/month ($119.88/year), Quantzee's full 12-indicator suite costs under $10 per indicator per year — 5–10x cheaper than LuxAlgo ($54–$84/month) or Market Cipher ($99.99/month)
- Mid-tier indicators ($9.99–$25/month) represent the best value for most retail traders in 2026 — genuine signal quality without paying for features you will never use
- The non-repainting test is the single most important quality filter before paying anything: run TradingView's Bar Replay on any indicator, regardless of price
- Three Quantzee indicators are permanently free — EMA Ribbon Pro+, Bollinger Bands Pro+, VWAP Pro+ — a genuine no-cost starting point to verify signal quality before subscribing
- 14-day money-back guarantee on the full paid suite — test on your actual assets and timeframes before committing
What “Affordable” Actually Means for a Trader
The word “affordable” is doing a lot of work in the TradingView ecosystem. For some sellers it means “cheaper than our flagship tier.” For buyers it should mean something more specific: the subscription cost represents a small, sustainable fraction of trading capital, and the tool is genuinely capable of improving decision quality enough to justify that fraction.
Here is the honest version of the math. Suppose you run a $5,000 trading account, risk 1 percent per trade (a widely recommended ceiling for developing traders), and take twenty trades a month. Your total capital at risk per month is $1,000. A $99 per month indicator subscription is already 10 percent of that risk budget just sitting idle before you place a trade. At $600 per year for a popular suite, you need the indicator to generate at minimum one extra winning trade per month just to break even — and that is before taxes, spreads, and the cost of your TradingView plan itself.
This is why the price tier you choose matters not just as a preference but as a trading decision. The framing is not “can I afford this indicator” — it is “does this indicator pay for itself at my account size.”
| Annual cost | Account needed to keep it under 5% drag | Extra winning trades required (at $50 risk/trade) |
|---|---|---|
| $120 / year ($10/mo) | $2,400 | 2–3 per year |
| $600 / year ($50/mo) | $12,000 | 12 per year |
| $1,008 / year ($84/mo) | $20,160 | 20 per year |
A tool at $9.99 per month is $119.88 per year. Even on a $3,000 account it is a 4 percent annual drag — manageable. A tool at $84 per month on that same account is 33 percent annual drag. That is not an edge. It is a handicap.
Affordable TradingView indicators are not the ones with the lowest sticker price. They are the ones whose cost is small relative to your capital, whose signal quality is verifiable, and whose feature set matches what you actually need — not what looks impressive on a landing page.
The Feature Trap: Paying for What You Will Never Use
Premium suites compete on feature count. The more a homepage lists — AI backtesting, multi-timeframe dashboards, screeners, Pine Script generators, community alerts, strategy portfolios — the more they can justify a high monthly price.
The problem is that most traders use two or three features intensively and ignore the rest. Paying $84 per month for twelve features and actively using three of them means you are paying $28 per feature per month you actually get value from — or roughly the price of a mid-tier subscription for your three features alone.
The honest question before subscribing to any premium indicator suite is: write down the three features you would use every day. Can you find those three features, at sufficient quality, for less?
The answer is usually yes. The practical checklist looks like this:
Must-have signals layer. A trend or momentum signal that confirms direction and generates clear entry and exit conditions. This is the core of any indicator strategy.
Non-repainting guarantee. Not a marketing claim — a verifiable, testable guarantee that signals do not move after the bar closes. Without this, everything else is noise (more on this below).
Multi-timeframe visibility. A way to see whether higher timeframes agree with your chart-level signal before committing. One clean dashboard panel is all this requires — not a full screener suite.
Automated trade levels. Entry, stop-loss, and at least one take-profit target — ideally ATR-based so levels scale with actual market volatility rather than fixed points.
Alert functionality. The ability to trigger an alert when a signal fires, so you are not watching the screen continuously.
Every feature beyond those five is genuinely nice-to-have, and some traders will find real value in the extras. But you should be paying for the five, not the fifteen.
The Non-Repainting Test: The Most Undervalued Quality Filter
Affordability and quality are not opposites, but there is one quality filter that almost entirely separates tools worth paying for from ones that are not: whether the signals repaint.
A repainting indicator silently changes its historical signals as new data arrives. The arrow that appeared to mark a textbook entry on Thursday is gone by Friday, replaced by one that conveniently sits at a better-looking bar. This makes backtested results look better than they are — sometimes dramatically better — and makes live trading unreliable because the signal you acted on may not appear in the chart record afterward.
Before paying for any TradingView indicator at any price point, run this test:
Step 1. Add the indicator to a chart.
Step 2. Open TradingView’s Bar Replay feature and move the playhead to a point where the indicator has placed a signal.
Step 3. Play forward one or two bars, then pause and check whether the signal is still where it was on the original bar.
A non-repainting indicator leaves the signal exactly where it fired. A repainting one moves it, removes it, or adds new ones that were not visible in real time.
This test takes under five minutes and it is the single best filter for separating credible indicators from ones with good marketing. TradingView’s built-in Bar Replay documentation walks through the interface in detail if you have not used it before.
Free TradingView Indicators: What They Do Well, Where They Fall Short
The built-in TradingView library is genuinely useful for foundational indicators. The five most commonly used ones — VWAP, RSI, MACD, EMA, and the standard SuperTrend — are mathematically sound, non-repainting, and free. Understanding why they have limits helps clarify what you are actually paying for when you move to a premium tool.
VWAP calculates the volume-weighted average price since session open. Institutional desks use VWAP as a benchmark, which means price often respects VWAP levels. The limitation is that it resets every session and gives no signal guidance for multi-day positions or assets with irregular volume profiles like crypto.
RSI is a momentum oscillator ranging from 0 to 100. It identifies overbought/oversold conditions and divergence setups. The classic limitation is that strong trending markets can hold RSI above 70 for extended periods, generating premature short signals. RSI alone cannot tell you whether a high reading means “exit now” or “trend continuation.”
MACD measures the relationship between two EMAs and generates histogram-based momentum signals. Useful in trending markets; generates frequent false signals in low-volatility ranges. Signal lag is a persistent issue because it is derived from lagging moving averages.
Standard SuperTrend is an ATR-based trailing stop indicator that colors above or below price to show trend direction. It is excellent for identifying trend and placing trailing stops. The limitation is that a single-line SuperTrend flips frequently in sideways markets, generating a run of false signals before price commits to a direction.
EMA crossovers are visually clear trend-following tools. A fast EMA crossing above a slow EMA signals bullish momentum. The problem is that they lag price movement by definition — you enter after a portion of the move is already gone — and in range-bound conditions they generate constant whipsaw signals as the two lines cross back and forth.
None of these limitations mean the free indicators are bad. They mean that using them effectively requires knowing their failure modes and compensating for them manually — either with experience, additional context, or a premium layer that addresses the specific weakness.
What Premium Indicators Add (and What They Do Not)
The most common marketing claim for premium TradingView indicators is “AI-powered” or “adaptive.” This language covers a wide range of actual implementations, from genuinely useful adaptive algorithms to static formulas with a new label. Before paying for any tool claiming AI or machine learning, it is worth understanding what the term can mean in practice.
Genuine adaptive logic means the indicator’s parameters change in response to market conditions — typically adjusting sensitivity based on measured volatility, regime detection (trending vs. ranging), or multiple timeframe inputs. When these work, they mean the indicator does not need manual recalibration as conditions change.
Non-adaptive AI marketing means the underlying math is a standard moving average, RSI, or similar formula, possibly with a cosmetically modified formula and a “neural network” claim in the marketing copy. The indicator behaves the same way regardless of conditions and requires the same manual parameter management as the free version.
How to tell the difference: look at the indicator’s settings panel. An adaptive indicator typically has parameters related to regime detection, volatility sensitivity, or lookback adaptation. A non-adaptive one has fixed period lengths and factor values identical to the standard formulas.
Premium indicators that genuinely earn their price generally do one or more of the following:
-
Combine multiple timeframes automatically so you get a single actionable signal that already incorporates higher-timeframe context, rather than needing to check three separate chart panes manually.
-
Plot the complete trade plan — entry, stop-loss, and take-profit levels — rather than just a bare signal arrow that leaves all risk management decisions to you.
-
Filter ranging conditions to stay out of the market when no clear trend is present, rather than generating signals continuously regardless of market structure.
-
Provide a calibrated non-repainting guarantee with a clear technical explanation, not just a marketing claim.
The Affordable TradingView Indicator Landscape in 2026
The market has matured considerably in the last two years. In 2024, the choice was roughly binary: free built-ins or $50+ per month premium suites. In 2026, a tier of well-built mid-range tools has emerged that offers genuine signal quality at monthly costs closer to $10.
Here is a realistic breakdown of the major tiers.
Free Built-ins (TradingView Public Library)
Best for: Traders who understand their limitations and use them as confirmation layers, not primary signals.
The free tier includes the five built-ins described above plus thousands of community-published scripts. The community library ranges from genuinely useful to actively misleading — some published scripts repaint aggressively and have impressive backtest results that are entirely fictional. Always run the Bar Replay test before trusting any community script.
Mid-Tier ($9.99–$25/month)
Best for: Traders who want professional signal quality without the overhead of a full analytics platform.
This is where the value case is strongest in 2026. Tools in this range typically focus on one or two core signal types — trend following, momentum, or confluence — and do them well without bundling features you will never use. The best of these tools are non-repainting, adaptive to market conditions, and provide automated trade level guidance.
Quantzee sits in this tier at $9.99 per month for access to the full twelve-indicator suite. The suite spans trend (SuperTrend Fusion, SuperTrend Pro+, AI TrendPulse, AI TrendLevels), momentum (Adaptive AI Oscillation Engine, RSI Pro+, MACD Pro+), volatility (Bollinger Bands Pro+), volume (VWAP Pro+), multi-market structure (AI Adaptive Quant Toolkit), and intraday options frameworks (CPR ThetaEdge). At $119.88 per year for twelve non-repainting tools, the per-tool cost is effectively $10 per year. That is the value case in its simplest form.
Premium Tier ($50–$85/month)
Best for: Professional traders who use the full platform — screeners, AI backtesting, community tools, and Pine Script automation — and can justify the cost against a larger trading account.
LuxAlgo at $54–$84 per month is the flagship of this tier. The platform includes a full analytical toolkit, AI backtesting assistant, and more recently a Pine Script code generation tool (LuxAlgo Quant). For traders actively using multiple platform components, the value is defensible. For traders who primarily want a clean signal layer, the additional monthly cost is hard to justify.
High-Cost Tier ($80–$600+/year)
Best for: Users of platforms that are difficult to replicate or have unique community-driven data.
Market Cipher at $99.99 per month ($600 per year for the annual plan) sits in this tier. It has a dedicated user community and a well-known indicator suite. At that price point on a $5,000 account it represents 12 percent annual drag before any trading. The repainting question has also been raised consistently by users — run the Bar Replay test before purchasing.
SuperTrend Pro+: The Case Study in Affordable Signal Quality
The standard SuperTrend is one of the most useful free indicators available. Its limitation — frequent flips in ranging markets — is also one of the most practically damaging, because entering on false SuperTrend signals in a chop phase is how traders accumulate a run of small losses that erase a good week.
SuperTrend Pro+ addresses this specific limitation through dual-SuperTrend confluence. Two SuperTrends run simultaneously — a fast one (factor 2, ATR 10) and a slow one (factor 4, ATR 20). A signal fires only on the bar where both first align in the same direction. This single change eliminates a large portion of the whipsaw signals a single-line SuperTrend generates in ranging markets, because both timescales have to agree before the indicator calls a trade.
On top of the confluence filter, the indicator adds four layers that address the full practical workflow:
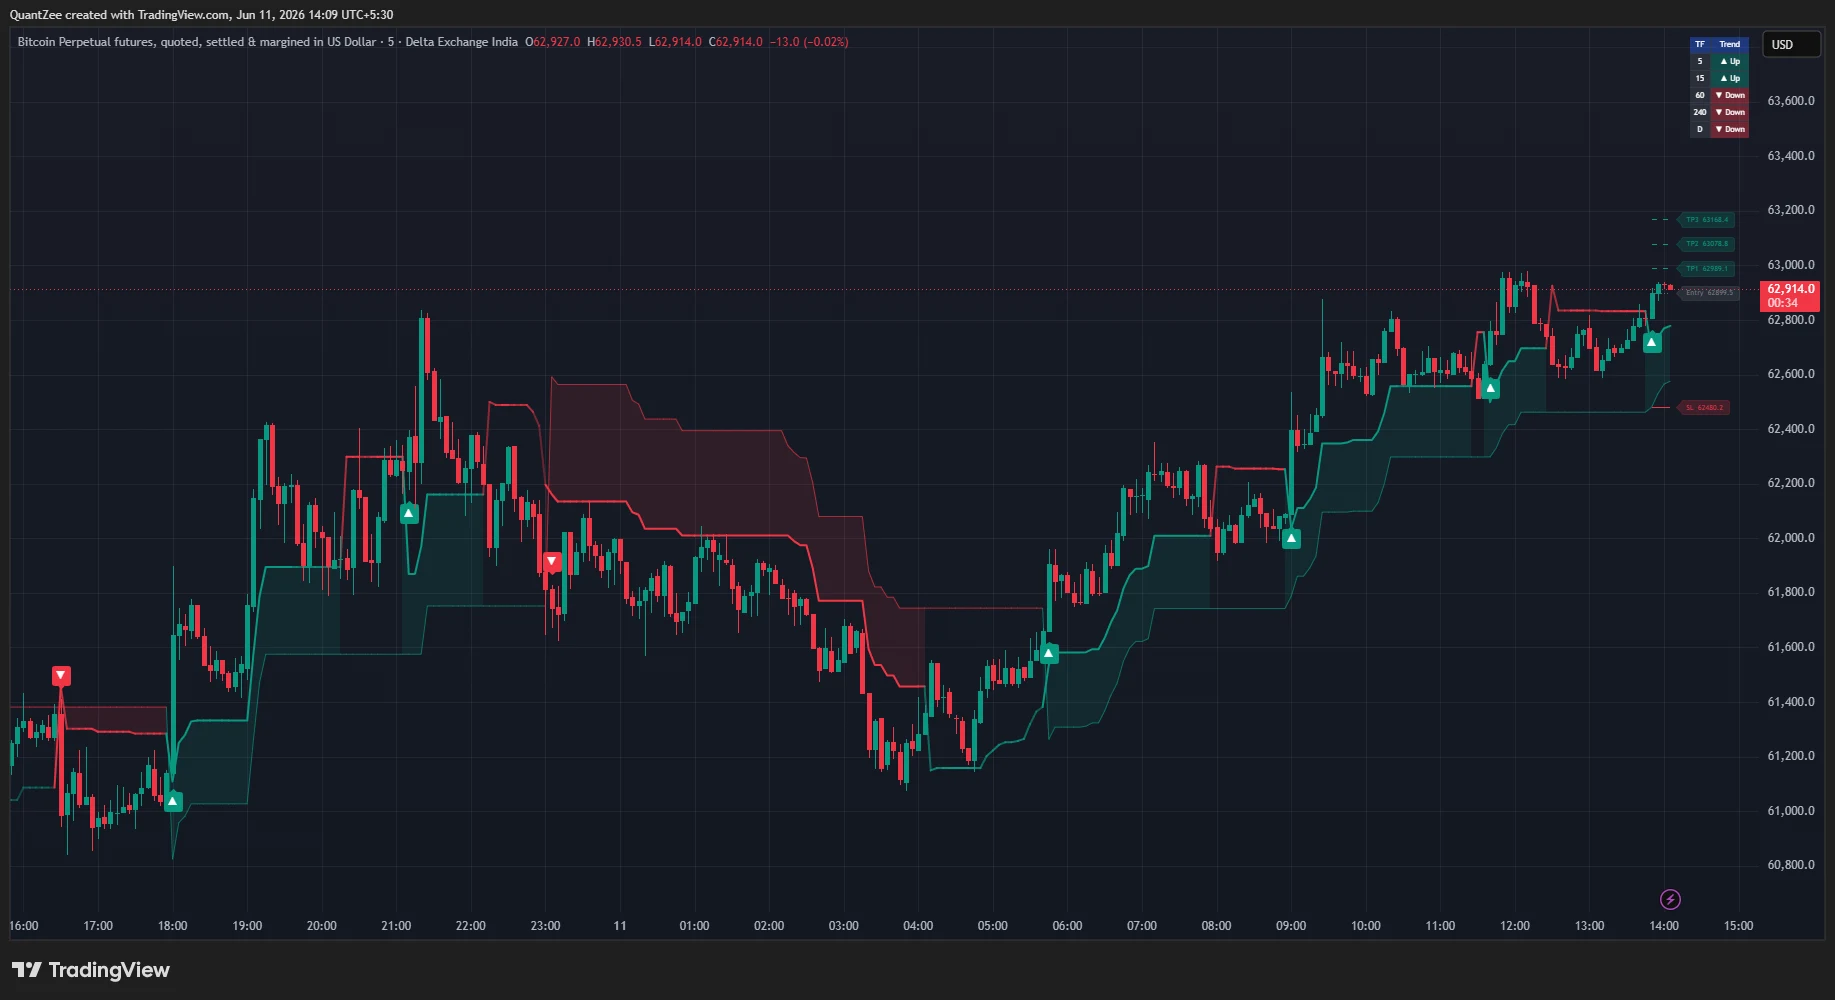
Automatic ATR trade-level ladder. On each confluence signal, the indicator plots entry, TP1 at 1x ATR, TP2 at 2x ATR, TP3 at 3x ATR, and stop-loss at the slow SuperTrend. This means every signal comes with a complete, objective trade plan — not just an arrow. The levels are labeled horizontal rays that extend until the next signal fires.
Trend-strength gradient. The fast SuperTrend line’s opacity tracks how far price is from the slow SuperTrend, normalized by ATR. A fading line signals that trend momentum is weakening before any flip occurs — an early-exit cue that the standard SuperTrend does not provide.
Multi-timeframe dashboard. A compact panel shows the slow SuperTrend direction across five user-selectable timeframes. Before entering a chart-level signal, you can instantly see whether the 1H, 4H, and daily timeframes agree. Chart-level signals that align with higher-timeframe direction are structurally stronger trades.
Non-repainting by design. Signals are evaluated on confirmed bar closes. Multi-timeframe data is requested with lookahead disabled. The trade-level ladder is drawn only after confirmation. You can verify this with Bar Replay on any historical period.
All of this is accessible at $9.99 per month as part of the Quantzee suite. You can explore SuperTrend Pro+ in detail on its indicator page.
How to Evaluate Any Affordable Indicator Before Buying
Price is one input. These are the other seven things to check before subscribing to any TradingView indicator, regardless of price.
1. Is there a free trial or money-back guarantee? Any credible mid-tier indicator offers a trial period or refund window. Quantzee’s 14-day money-back guarantee means you can run the Bar Replay test, trade on paper, and verify signal behavior before committing. A seller who does not offer a trial is asking you to trust marketing claims rather than results.
2. Is the non-repainting claim technically explained?
“Non-repainting” is easy to say. A credible tool explains how: which Pine Script functions are used, whether request.security is called with lookahead=barmerge.lookahead_off, whether signals are calculated on confirmed closes. If the documentation does not explain the technical mechanism, run the Bar Replay test yourself.
3. Does it work on your asset class? Many premium indicators are tuned for specific markets — crypto volatility, US equity opening hours, or options-specific price action. Check whether the indicator has been tested and documented on the assets you actually trade: stocks, indices, forex, or crypto. An indicator with excellent BTC documentation may underperform on the FTSE or EUR/USD.
4. How many indicators are you actually getting? $9.99 per month for one indicator is a different value proposition from $9.99 for twelve. Before comparing monthly costs, compare the per-feature cost. A full suite at low cost is typically a better deal than a single-indicator subscription at the same price, provided the suite features are each genuinely useful rather than padded.
5. What are active users reporting live? TradingView’s comment sections on indicator pages, Reddit’s r/TradingView, and X (formerly Twitter) are better signal sources than the seller’s own testimonials page. Look specifically for comments about live trading experience — not backtests — and for any mention of repainting in real-time use.
6. Is the developer active and the tool maintained? Markets change. An indicator that was well-tuned for 2022 conditions may perform differently in 2026. Check when the tool was last updated and whether the developer actively responds to user questions and bug reports.
7. Can you cancel easily? Subscription traps — monthly plans that are difficult to cancel, annual commitments auto-renewing without notice — are more common than they should be in this market. Check the cancellation policy before subscribing to anything.
Building an Affordable Indicator Stack
The optimal configuration for most traders is not one indicator — it is a small stack of two or three that each serve a distinct function without redundancy.
The classic problem is selecting indicators that measure the same thing. An RSI + MACD + Stochastic setup looks like three data points but is actually one: momentum. When RSI says overbought, MACD is trending down, and Stochastic is in the high zone, all three are confirming the same signal from the same underlying data. Removing two of them does not lose information — it reduces clutter.
A genuinely complementary stack covers three separate dimensions:
Trend direction. One tool that identifies whether price is in an uptrend, downtrend, or range. SuperTrend Pro+‘s dual confluence signal is designed for this role — it confirms trend direction with two layers and stays flat during ambiguous periods.
Market structure. One tool that identifies key levels — support, resistance, demand zones, order blocks, or pivot points — that give the trend signal context. Knowing that a long signal fires at a multi-month support level is more actionable than a signal that fires at a random price in open space.
Exit management. One tool or set of levels that tells you where to scale out and where to place the stop-loss. SuperTrend Pro+‘s ATR ladder handles this automatically on every signal, removing the need for a separate tool.
This three-component stack — trend + structure + exit — can be assembled entirely within the Quantzee suite. AI TrendPulse provides the trend layer, AI Adaptive Quant Toolkit handles structural analysis and regime detection, and SuperTrend Pro+ supplies the combined trend confirmation and automated exit ladder. The full suite at $9.99 per month covers all three roles with tools built to work together on TradingView’s native platform.
The Free vs. Paid Decision: A Simple Framework
This is the decision most traders are really trying to make. Here is a one-page framework for it.
Stay with free indicators if:
- Your account is under $2,000 and any monthly subscription represents over 6 percent annual drag.
- You are still building fundamental skills — chart reading, risk sizing, understanding market structure — and an expensive indicator will not substitute for that learning.
- You trade at low frequency (fewer than five trades per week) and the improvement a premium indicator offers is marginal relative to its cost.
- You have not yet verified whether your current free setup is actually costing you money in bad signals.
Consider mid-tier indicators if:
- You are consistently profitable with free indicators but losing trades to avoidable false signals or repainting behavior.
- The subscription cost is under 5 percent of your annual trading account value.
- You have run the Bar Replay test on the target indicator and the signals hold.
- You need multi-timeframe context or automated trade levels that you are currently constructing manually.
Consider premium-tier indicators if:
- You actively use screeners, backtesting, and code generation features — not just the signal layer.
- Your account size makes the monthly cost genuinely negligible.
- The specific community intelligence (order flow data, proprietary datasets) embedded in the platform has measurable value for your strategy.
Most retail traders reading this article fall into the second category. That is the category where tools like SuperTrend Pro+ and the Quantzee suite earn their price: a monthly cost low enough to be sustainable, signal quality high enough to justify it, and a feature set aligned with what developing traders actually use.
Common Mistakes When Shopping for Affordable Indicators
Confusing low price with low quality. A $9.99 indicator can be better-engineered than a $99 one. Price reflects marketing investment, brand positioning, and feature count — not signal quality. Evaluate quality independently through the Bar Replay test and live user reports.
Buying based on backtested win rates. Any indicator with a repainting bug will show impressive historical performance. The backtest does not capture real-time trading — it captures the indicator’s ability to explain past price movement in hindsight. Only live or replay-verified performance is meaningful.
Subscribing to multiple overlapping tools. Two trend indicators do not give you twice the signal quality. They give you the same signal twice with twice the cost and twice the chart clutter. Before adding a second subscription, check whether it is measuring something genuinely different from what you already have.
Ignoring the cancellation policy. Monthly billing that auto-upgrades or is difficult to cancel is a common source of subscriber frustration. Read the terms before entering payment details.
Not using the trial period. A 14-day money-back guarantee exists for a reason. Use it to trade on paper with the indicator, run Bar Replay verification, and check signal behavior on your specific asset and timeframe before committing.
Frequently Asked Questions
Put It Into Practice
Affordable TradingView indicators come down to four factors: price relative to account size, verifiable non-repainting behavior, adaptive signal logic, and a feature set aligned with what you actually need. The free tier is solid for foundational tools and gets you further than most traders think. The mid-tier — tools in the $10–$25 per month range — earns its cost specifically for traders who are already profitable and losing trades to false signals, repainting behavior, or manual trade-management gaps.
SuperTrend Pro+ addresses all three of those with dual-confluence filtering, non-repainting architecture, and an automatic ATR-based trade ladder that turns every signal into a complete trade plan. At $9.99 per month as part of the Quantzee suite — which also includes AI TrendPulse, AI TrendLevels, AI Adaptive Quant Toolkit, RSI Pro+, VWAP Pro+, Bollinger Bands Pro+, EMA Ribbon Pro+, MACD Pro+, Adaptive AI Oscillation Engine, SuperTrend Fusion, and CPR ThetaEdge — the per-tool cost is lower than any comparable platform.
Explore SuperTrend Pro+ and the full Quantzee suite →
Compare all Quantzee indicators →
See current pricing and start a 14-day trial →
Disclaimer: All Quantzee indicators are analytical software tools intended for educational and informational purposes only. They do not constitute financial advice or investment recommendations. The trade levels displayed — including Entry, TP1, TP2, TP3, and Stop-Loss — are ATR-based visualizations, not guarantees of any particular outcome. Past signal behavior does not guarantee future performance. Always apply your own risk management and conduct your own research before making any trading decisions. Quantzee is not responsible for any financial loss arising from reliance on these tools.