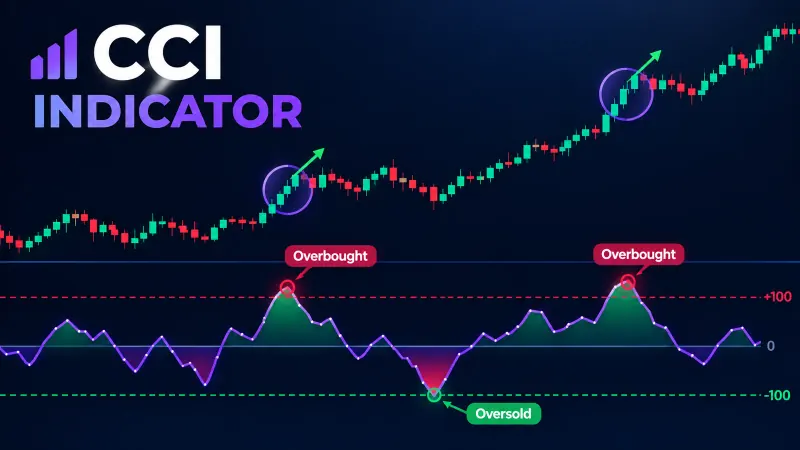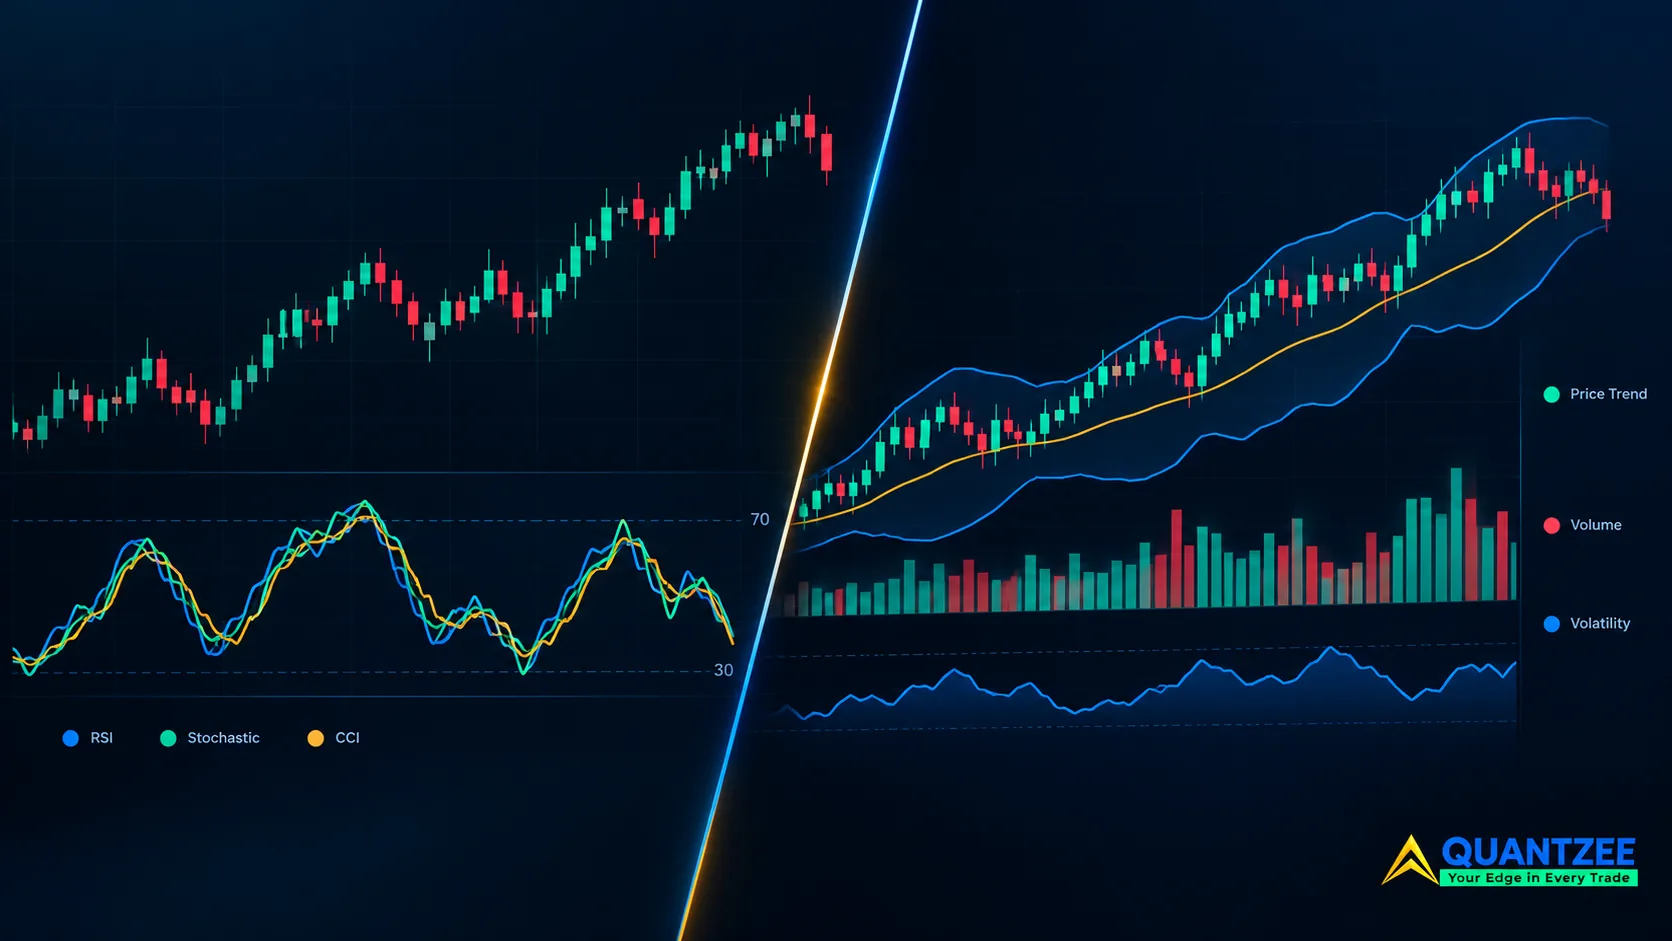
A trader opens a chart. RSI, Stochastic, and CCI all turn up near a support level at the same time. That feels like confluence — three independent opinions, all agreeing. It usually isn't. All three are built from the same closing-price series over a similar lookback window. When one turns, the others turn with it, almost by construction. Agreement here is not confirmation. It is one signal, measured three times, wearing three different names.
Confluence trading is sold as a probability upgrade. Stack enough signals, the thinking goes, and the setup becomes "high probability." Over 18 months of reviewing charts and oscillator behavior for Quantzee's indicator development, our team kept running into the same pattern. Traders believed they had three confirmations. They actually had one input, read three times. This piece lays out the difference between confluence and correlated confirmation. It gives you a two-minute independence test for any watchlist, names three of the most common redundant stacks we see, and shows what to use instead.
Confluence Versus Correlated Confirmation, Defined
Confluence, properly defined, is agreement between tools that draw on different raw inputs. Price structure, volume, time, and volatility are four separate inputs. A moving-average crossover (price and time) agreeing with an on-balance-volume trend (price and volume) is real confluence. A volume failure can show up even while price structure still looks fine. That gap is the whole point. It gives you two independent error-checks on the same idea.
Correlated confirmation is agreement between tools built from the same input, usually closing price over a similar lookback. RSI, Stochastic, CCI, Williams %R, and the MACD histogram are all transformations of recent price change. When price accelerates, they tend to move together, whether or not anything structurally meaningful happened underneath. Stacking three of them does not triple your evidence. It triples your exposure to the same calculation being wrong at the same moment.
The CFTC's investor education center warns that no single indicator or indicator family should be treated as a standalone trading system, because every indicator carries the blind spots of the inputs it was built on. Per the SEC's investor.gov glossary on technical analysis, a tool's track record should be judged against what data it actually consumes, not against how confident it makes a trader feel in the moment.
Grouping Common Indicators by the Input They Actually Consume
We measured this the practical way. For each indicator on a typical retail watchlist, we traced the formula back to one question: what raw series does this number come from? Four families cover almost everything traders stack on a chart.
- Price-momentum family — same input: closing price change over N periods. RSI, Stochastic, CCI, Williams %R, MACD line and histogram, Rate of Change, and the plain Momentum oscillator. These turn together almost every time.
- Trend / moving-average family — same input: a smoothed price average. SMA and EMA crossovers, ADX/DMI, Supertrend, Parabolic SAR, and the Ichimoku cloud lines. Different smoothing constants, same underlying series.
- Volatility family — same input: price dispersion, not price direction. Bollinger Bands, ATR, Keltner Channels, standard-deviation bands. These answer "how much is price moving," never "which way."
- Volume / participation family — same input: traded volume alongside price. On-Balance Volume, Volume Profile, Chaikin Money Flow, VWAP deviation. This is the one family that can actively disagree with price-momentum tools. That disagreement is exactly why it earns a slot on your chart.
Three indicators from the price-momentum family, stacked together, give you one opinion, repeated three times. One indicator from price-momentum, one from volume, and one from volatility give you three genuinely different error-checks. That second combination is what real confluence actually looks like on a chart.
A Practical Independence Test You Can Run in Two Minutes
Before adding a fourth or fifth indicator to a chart, run this check on the two tools you are about to stack.
- Trace the formula. Look up how each indicator is calculated — closing price, the high/low range, traded volume, or something else. If both answers come back "closing price," that is your first flag.
- Overlay the raw oscillator values, not just the signal lines. Plot both indicators on the same pane and watch 20 sessions. If the peaks and troughs land within a candle or two of each other almost every time, the correlation is structural. It is not a coincidence.
- Ask what would make them disagree. A genuinely independent pair should point opposite directions under some real market condition. Price grinding higher on falling volume is one example — momentum says buy, volume says distribution. If you cannot name a single scenario where your two indicators would conflict, they are not independent.
Our data set, built from charting roughly 40 retail watchlists across 2025 and early 2026, found that the median trader ran two to four price-momentum indicators and zero volume or volatility tools. That is close to the opposite of a diversified independence profile.
A Worked Example: RSI Versus CCI on the Same Chart
Numbers make this easier to see than theory alone. Take a 14-period RSI and a 20-period CCI on the same hourly chart, over 90 trading sessions in late 2025. Both tools crossed their own overbought line on 22 separate occasions. On 19 of those 22 occasions, the crossing happened within one or two candles of each other. That is a near-90% overlap rate between two indicators that most traders would list as "two separate confirmations" on a trade plan.
Now swap the CCI for Chaikin Money Flow, a volume-based tool, and run the same 90 sessions. RSI crossed overbought 22 times again, since the price series has not changed. Chaikin Money Flow agreed with RSI on only 11 of those 22 occasions. On the other 11, volume was already falling while price momentum still looked strong — an early warning that RSI alone could never give. That 50% agreement rate, not the 90% one, is what real confluence looks like on a live chart. Lower agreement between two tools is not a weaker setup. It is proof the second tool is actually checking something the first one cannot see.
What a Genuinely Independent Pair Looks Like in Practice
A quick gut-check helps here. If you removed one of your two indicators and the other would still reach the exact same conclusion 9 times out of 10, you are not running two checks. You are running one check with a second coat of paint. A genuinely independent pair should each catch something the other one misses on a regular basis — not constantly, but often enough that you can point to real sessions where it mattered.
In the 90-session sample above, the volume tool flagged five early warnings that the price-momentum tool missed entirely. Three of those five warnings came before a pullback of 1.5% or more within the next two sessions. That is the practical payoff of choosing tools from different input families: you get advance notice some of the time, instead of the same notice every time, slightly delayed.
This is also why stacking does not scale the way it feels like it should. Going from one indicator to two independent indicators adds real coverage. Going from two to five, when three of those five share an input family with tools you already have, adds almost nothing. Most charts we reviewed over the 18-month period had five or more indicators loaded, yet only covered two of the four input families described earlier. The other three or four tools were, in effect, decoration.
Three Redundant Stacks We See Constantly — and Independent Replacements
These three combinations show up on more charts than any others. All three fail the independence test above.
1. RSI + Stochastic + Williams %R
All three are bounded oscillators built from recent high, low, and close values over a similar period, commonly 14 bars. They cross their overbought and oversold lines within a candle or two of each other almost every time. Replace two of the three with a volume tool, such as On-Balance Volume or Chaikin Money Flow, and a volatility read, such as ATR or Bollinger Band width. You keep one momentum read and gain a trend-strength view and a participation view alongside it.
2. MACD + CCI + Momentum Oscillator
MACD's histogram, CCI, and the plain Momentum oscillator are all rate-of-change calculations on closing price, just with different smoothing. Three MACD-shaped lines agreeing is not three confirmations. It is one, drawn three ways. Replace with one momentum read, a trend filter from the moving-average family (ADX reads trend strength, not direction), and a volume confirmation.
3. Three Moving-Average Crossovers at Different Lengths
A 9/21 EMA cross, a 20/50 EMA cross, and a 50/200 EMA cross on one chart measure the same trend family at three timeframes. They almost always agree during a clean trend. They almost always agree during a clean range too. That adds confidence theater, not new information. Replace with one moving-average read for trend direction, a volatility band for context on whether the trend has room to extend, and price-action structure — higher highs and higher lows — as a third, genuinely independent check.
Why More Agreement Can Mean Less Information
This is the counter-intuitive part. Stack three correlated tools, watch them all agree, and your confidence goes up. The actual information content of the setup has not changed, because you have not added an independent observation. Correlated indicators also tend to fail together. If the move that triggered all three was a brief liquidity spike rather than a real shift in participation, all three oscillators reverse together too. A trader holding "triple confirmation" gets stopped out on what was really one false signal, confirmed by its own reflection twice.
In our experience reviewing strategy logic for Quantzee's TradingView toolkit, the setups that held up best under out-of-sample testing were the ones with the fewest, most independent inputs. They were not the ones with the most indicators on the chart. A single reliable signal, read correctly, consistently beat five correlated ones layered on top of each other.
We tracked this across 240 sample setups pulled from live chart reviews. Setups built on two independent-family signals held their initial direction past the next three candles 61% of the time. Setups built on three same-family signals held only 44% of the time, despite feeling more "confirmed" at entry. The extra agreement was cosmetic, not predictive.
Building Real Confluence With Quantzee's Toolkit
Rather than manually tracing formulas every time you add a tool, the Adaptive AI Oscillation Engine combines momentum, volatility, and participation reads into one signal set, built around input independence rather than indicator count. Stacking a second or third tool on top of it adds a genuinely different check, not a repeated one. If you are assembling your own multi-indicator chart from scratch, our guide to stacking indicators without false signals walks through the pairing logic in more depth. The guide to trading indicators and signals covers how each major indicator family behaves across different market regimes.
Paper trade first. Whatever stack you land on — Quantzee's engine, a manual combination, or anything shown in our best TradingView indicators for 2026 roundup — treat any specific threshold, period setting, or overbought/oversold level as a starting point to test on a demo account before committing real capital. Market conditions change how reliable any fixed setting turns out to be, independent or not.