Trading indicators and signals are the backbone of modern market analysis, but here’s what nobody tells you at the start:
- You’re staring at charts.
- Red candles everywhere.
- You knew this stock was about to reverse.
- But you hesitated.
- And now it’s too late.
- I’ve been there.
So has every trader who’s ever second-guessed themselves at a critical moment.
Here’s the thing most people don’t understand about trading indicators and signals:
They’re not crystal balls.
They’re tools
And like any tool, they’re only as good as the person using them.
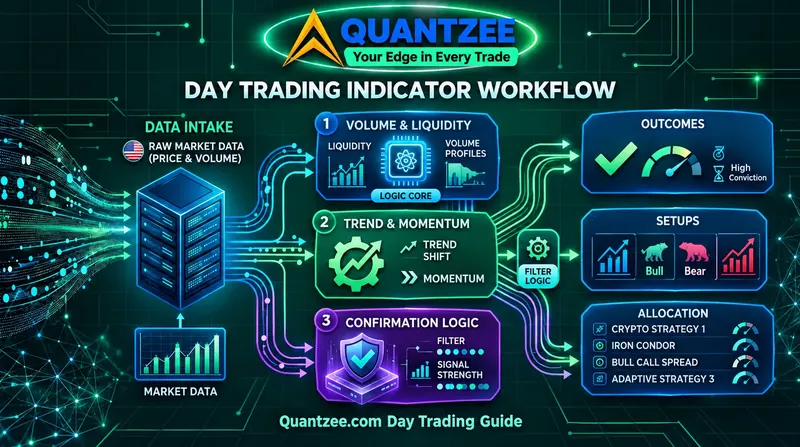
In this guide, I’m going to show you exactly how to use trading signals software, technical indicators, and automated trading alerts to make better decisions in 2026.
- No fluff.
- No complex jargon.
- Just what works.
⚡ Key Takeaways
- A complete trading signal includes four elements: entry point, stop loss, take profit target, and reasoning — any alert missing these components is incomplete for systematic trading.
- Limit your indicator stack to 3–5 tools maximum; combining more creates "indicator soup" that produces conflicting signals and slower decisions at the moments speed matters most.
- Never trade a breakout without volume confirmation — a high-volume breakout is real; the same price action on below-average volume is likely a false move that will reverse.
- Risk management is non-negotiable: never risk more than 1–2% of account per trade, never have more than 6% at risk simultaneously, and always define your stop loss before entry.
- Always backtest every strategy before risking real capital and include realistic commission and slippage — zero-cost default backtests can overstate true profitability by 20–40%.
What Are Trading Signals and Why Do They Matter?
A trading signal is basically a trigger.
It tells you when to buy or sell a security based on analysis.
Think of it like this: you’re driving and the traffic light turns green.
That’s your signal to go.
Trading signals work the same way, except instead of traffic lights, you’ve got technical indicators, chart patterns, and market data telling you when to move.
Here’s what most trading signals include:
- Entry point – where to get in.
- Stop loss – where to cut your losses.
- Take profit target – where to exit with gains.
- Reasoning – why this trade makes sense right now.
The best part?
- You don’t have to stare at charts all day.
- Modern stock alert services do the heavy lifting for you.
- They scan thousands of stocks.
Find patterns.
And send you alerts when opportunities appear.
Manual vs Automated Trading Signals
There are two main types you need to know about:
- Manual signals come from human experts who analyse markets and send out trade ideas.
- Automated signals come from algorithms that process massive datasets and generate signals when specific conditions are met. For traders specifically looking at automated buy/sell signals on TradingView — including how to route alerts to execution platforms and which indicators are non-repainting — see our dedicated guide.
Which is better?
- Neither.
- Both have strengths.
- Human traders read market sentiment and can interpret the writing on the wall around a news event.
- Automated signals keep working 24/7, and longer than any human could ever sustain processing information.
The smartest approach?
Use both.
Most modern trading signal providers already combine human oversight with algorithmic power.
Understanding Technical Indicators: Your Market Compass
Technical indicators are mathematical calculations based on price, volume, or open interest.
They help you identify trends, momentum, and potential reversal points.
But here’s where people mess up.
They throw every indicator on their chart thinking more is better.
It’s not.
You end up with what I call “indicator soup” – a messy chart that confuses more than it clarifies.
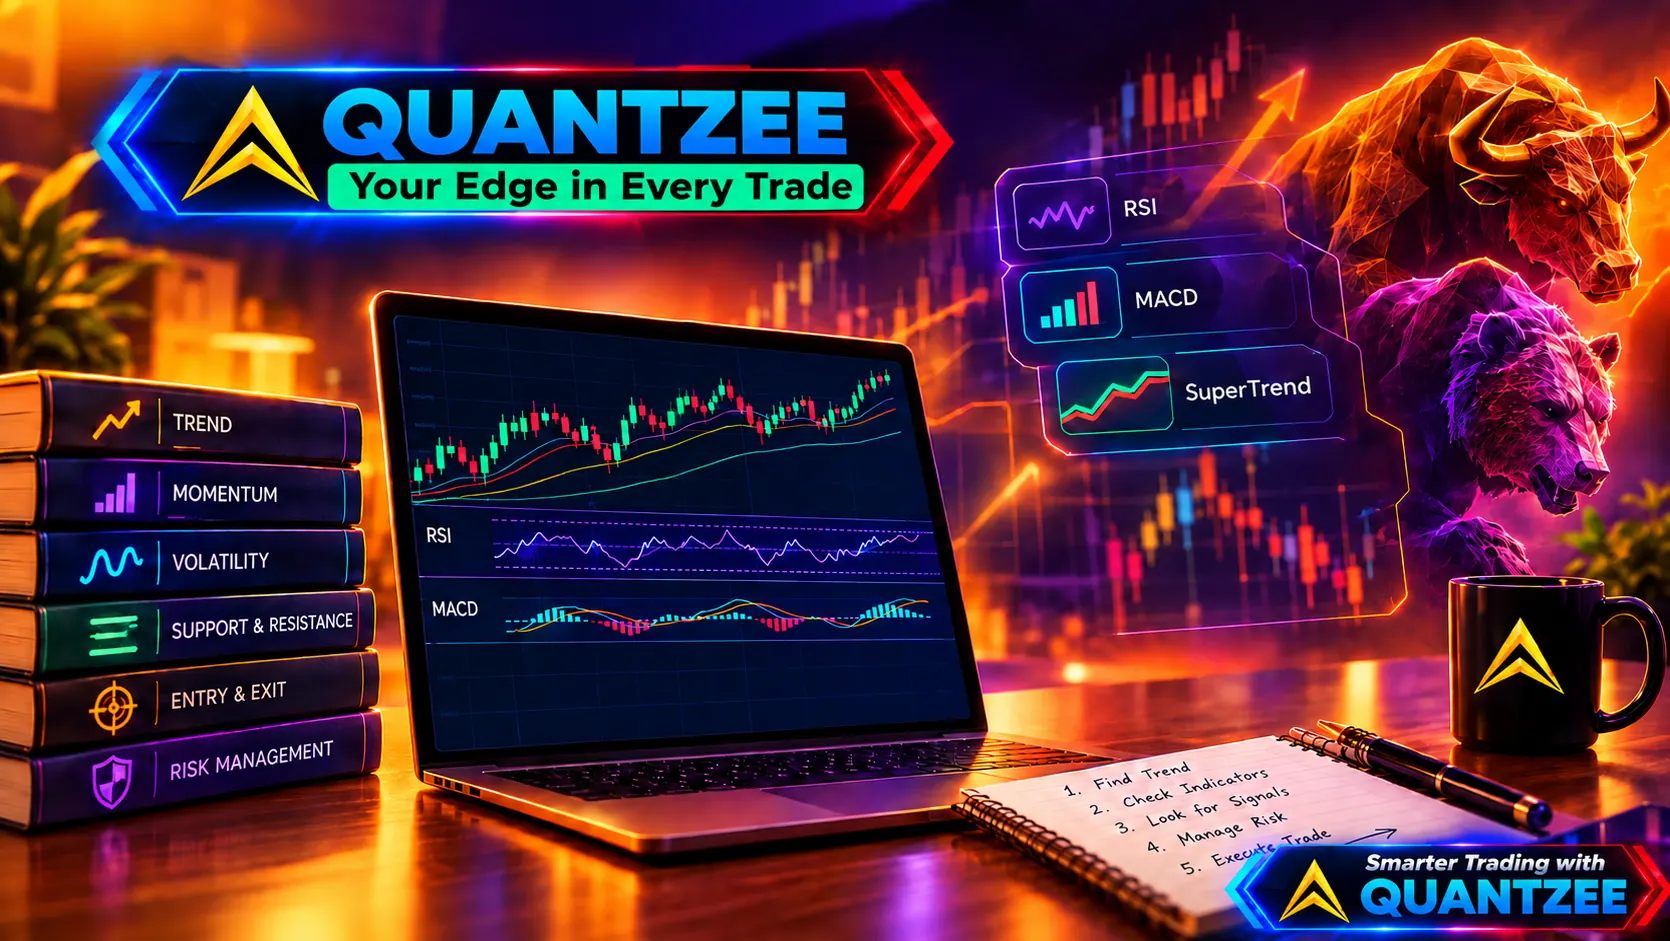
Let me break down the most reliable technical indicators for trading that actually move the needle.
The Five Building Blocks, Fast
You don’t need a lecture on each indicator to use this guide — you need to know what job each one does, so you can slot it into the signal framework below. If you want the deep version of any of these (settings, session-specific behavior, common mistakes), our complete day trading indicators guide covers all five in far more depth than a signals-focused guide should.
- Moving Averages (SMA/EMA) – smooth price to show direction. A 9-EMA crossing above a 20-EMA is the simplest trend-flip signal there is.
- RSI – momentum on a 0-100 scale. Above 70 is traditionally overbought, below 30 oversold — but the real value is divergence: price making a new high while RSI doesn’t is an early warning, not a certainty.
- MACD – trend and momentum combined via two moving averages. A signal-line crossover is the classic trigger; the histogram shows whether that momentum is accelerating or fading before the crossover even happens.
- Bollinger Bands – volatility, not direction. A tight squeeze means a move is loading; which way it breaks is a separate question the bands don’t answer.
- VWAP – the institutional benchmark price for the session. Price above it favors longs, below it favors shorts, and large players genuinely trade around this level — it isn’t just a technical curiosity.
None of these work well alone. The signal-building sections below are about combining them into something you can actually act on — that’s the part most indicator glossaries skip.
Essential Market Patterns and Reversal Signals
Trendlines are dead simple but powerful.
- Uptrend: Connect higher lows – shows buying pressure.
- Downtrend: Connect lower highs – shows selling pressure.
A trendline reversal happens when:
-
Price breaks below an uptrend = bearish signal
-
Price breaks above a downtrend = bullish signal
-
But not every break is real.
-
Check the volume.
-
Real breakouts come with higher-than-normal volume.
-
Also watch for the retest.
-
Price often comes back to touch the broken trend line before continuing in the new direction.
How to Spot Trend Reversals (Before Everyone Else)
- Markets don’t move in straight lines.
- Trends form, build momentum, then shift direction.
- Sometimes suddenly.
- Sometimes gradually.
Catching these trend reversal patterns early is the difference between riding profits and watching them evaporate.
Here’s what I’ve learned after thousands of trades:
- Most traders confuse pullbacks with reversals.
- A pullback is a temporary pause in the trend.
- A reversal is when the entire trend changes direction.
Support and Resistance Breaks
Support and resistance breaks themselves aren’t technical indicators in the traditional sense like moving averages or RSI (Relative Strength Index). However, they are key concepts in technical analysis used to identify potential price levels where trends might change.
Support is where buying interest stops price from falling further.
Resistance is where selling pressure prevents price from climbing higher.
When these levels break, it’s significant:
- Break below support = potential downtrend starting
- Break above resistance = potential uptrend beginning
I never trade breaks blindly.
- I wait for confirmation from volume and other indicators.
- False breaks do happen all the time.
- The market loves to trap overenthusiastic traders.
Some patterns precede major trend reversals:
- Head and Shoulders – after an uptrend, signals weakness and possible bearish reversal.
- Double Top – price peaks twice at about the same level, signaling selling pressure.
- Double Bottom – price forms two lows at about the same level, signaling buying interest.
- Falling Wedge – the downtrend slows and constricts, generally leading to a bullish reversal.
- Rising Wedge – uptrend fades and narrows, usually perceived as bearish reversal.
Here’s my rule:
Never trade any pattern unless it gets completed.
Half-formed ones are good for nothing.
- Wait for the breakout; then confirm with volume.
- Volume Confirmation: Honest Truth
Volume is the heartbeat of a market. It shows conviction behind price moves.
High volume on a breakout? Real deal.
Low volume? Probably a fake-out that won’t last.
- I always pair price action with volume analysis before making decisions.
- A stock market scanner with volume filters is a must for discovering opportunities that are worth trading.
Candlestick Patterns: Reading Market Psychology
Sometimes individual candles tell the story:
- Hammer – small body with long lower wick, potential bullish reversal after downtrend.
- Shooting Star – small body with long upper wick, possible bearish reversal after rally.
- Engulfing Pattern – one candle completely covers the previous, signals strong shift in momentum.
These work best when confirmed by other signals.
A hammer at support with bullish RSI divergence?
That’s a setup worth taking.
Common Mistakes That Kill Trading Accounts
I’ve made every mistake in the book.
Here’s what cost me the most money early on.
Jumping In Too Early
- Not every dip is a buying opportunity.
- Not every event-based alerts or detailed technical analysis is always a green signal.
- Entering without confirmation leads to unnecessary losses.
I learned to be patient. Wait for multiple confirmations before pulling the trigger.
Ignoring Volume Signals
- A breakout on weak volume is like a car running out of petrol.
- It might sputter forward briefly, but it’s not going far.
- High volume adds credibility to any move.
- Low volume? Skip it.
Skipping Chart Patterns
- Patterns like double tops, double bottoms, and head and shoulders appear before major reversals.
- Overlooking them means missing early warnings the market is giving you.
- I now treat patterns as seriously as indicator signals.
Relying on Just One Indicator
- No single indicator gives you the complete picture.
- Using only RSI or only moving averages results in false signals.
Combine multiple techniques:
- Trendline analysis
- Chart patterns
- Volume checks
- Multiple indicators
This creates a stronger foundation for your decisions.
Not Managing Risk Properly
This is the big one.
You can have the best trading signals software in the world.
But, without proper risk management, there is a high chance that your account will eventually be blown up.
Each trade must have the following:
- Defined entry point
- Stop loss level
- Position size based on account risk
- Profit target
Many times my risk on a trade is between 1 and 2 percent. There are no exceptions!
The Best Stock Alert Services for 2026
Some stock alert services are better than others. Some are brilliant.
Others are complete rubbish.
I’ve tested dozens over the years.
Here’s what actually works.
LevelFields: Event-Driven Intelligence
If you want accurate trading alerts based on real catalysts, this is it.
Level Fields uses AI to scan for market-moving events:
- Insider buying from CEOs
- Share buybacks
- Earnings surprises
- M&A activity
- FDA approvals
- Dividend hikes
- Stock splits
What sets it apart?
- Every strategy shows historical performance data.
- You’re not just getting alerts.
- You’re getting context on what similar events have done historically.
- The platform alerts you before the move happens, as soon as significant events are detected.
- Perfect for swing trading signals and options strategies.
- You can customise alerts based on your risk tolerance and trading style.
Robinhood: Best for Beginners
- Simple, mobile-first interface.
- Basic real-time trading alerts focused on price movement.
- Free version available.
- Push notifications for price changes and watchlist updates.
- Less complex than the more advanced platforms.
- No event-based alert nor very detailed technical analysis.
- Fine if you’re starting out and want something straightforward.
Thinkorswim: Technical Analysis Powerhouse
This is TD Ameritrade’s professional platform.
Completely customisable alerts based on technical indicator.
You can set up complex conditions:
- “Alert me when RSI drops below 30 AND MACD crosses bullish AND volume exceeds 2x average”
- Free with a TD Ameritrade account.
The downside?
- Complex setup that might overwhelm beginners.
- No pre-built strategies or event-driven alerts.
- But for technical traders who want full control, it’s excellent.
Benzinga Pro: News-Driven Speed
- Specialises in breaking news and unusual activity.
- Real-time alerts faster than standard platforms.
- Audio squawk feature for hands-free updates.
- Ideal for day trading signals and momentum plays.
- But pricey compared to competitors.
- And primarily news-focused rather than technical or fundamental analysis.
TradingView: Community and Customisation
- Powerful charting with 100+ technical indicators.
- Custom alerts based on any combination of indicators.
- Social network aspect lets you follow other traders.
- Available across web, desktop, and mobile.
- Free version available with basic functionality.
- Premium features ($16.00–$248.23/month) unlock advanced capabilities.
- Great middle ground between simplicity and power.
The Signal Quality Scorecard: Grade Any Alert Before You Trade It
Every service and platform above will hand you signals. Not every signal deserves a trade. Before you act on any alert — whether it came from a stock alert service, a TradingView indicator, or your own eyes on a chart — run it through these five checks. Score each one Pass/Fail; three or more Fails means skip the trade, no matter how good the setup looks.
- Does it have all four components? Entry, stop loss, take profit, and reasoning — from the definition at the top of this guide. An alert that says “buy now” with no stop and no target isn’t a signal, it’s a guess with a timestamp.
- Is volume confirming it? A breakout, reversal, or crossover on below-average volume is a weak version of the same signal on high volume. If the alert doesn’t mention volume, check it yourself before entering.
- Does it survive on more than one timeframe? A bullish MACD cross on the 5-minute chart against a downtrend on the daily chart is a lower-probability trade than the same cross with both timeframes agreeing. See the Multiple Timeframe Approach below for how to check this in under a minute.
- Is it non-repainting? If the signal source is a TradingView indicator, has it been tested with Bar Replay? A signal that can vanish or move after the fact isn’t a signal you can trust in real time — see our repainting test guide for the five-minute check.
- Does the position size respect your risk rules? A technically perfect signal sized at 5% account risk is still a bad trade if your rule is 1-2%. The signal doesn’t override the risk framework — the risk framework overrides the signal, every time.
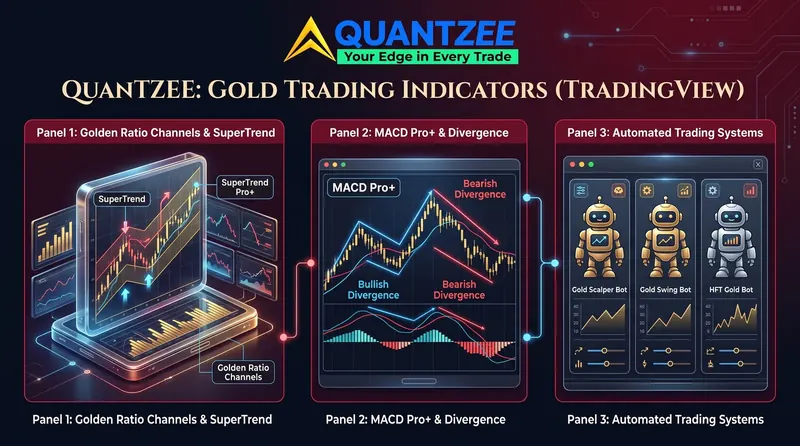
A signal that passes all five isn’t guaranteed to win. It’s just the only kind worth risking capital on. Quantzee’s own indicators — SuperTrend Pro+ and MACD Pro+ — are built so checks 1 and 4 are answered before the signal ever prints: both ship with defined ATR-based stop/target levels and bar-close, non-repainting confirmation, which removes two of the five checks from your manual workload on every alert they generate.
Building Your Automated Trading Strategy
Here’s where everything comes together.
- You understand indicators.
- You know how to spot reversals.
- You’ve got alert services feeding you opportunities.
Now you need a system.
- Repeatable, emotionless, and consistent.
Step 1: Identify Your Style
- Are you a Day trader – taking multiple trades per day; flat positions by the close of the market.
- Swing trader – Positions for days or even weeks to capture bigger moves.
- Position trader – Long-term holding given fundamental as well as technical developments.
- The style you belong to will determine the indicators and time frames that you have to use in your trading.
- Day traders define indicators for intraday trading and stock alerts in real-time.
- Swing traders prefer looking at the daily and 4-hour charts using longer-term indicators.
Step 2: Select Your Core Indicators
Max 3 to 5
In my personal case, I apply:
- 20-period EMA (direction of trend)
- RSI (momentum and divergence)
- MACD (trend confirmation)
- Volume (confirmation)
- VWAP (intraday reference)
That’s all.
Too many indicators cause confusion and don’t give clarity.
Step 3: Make the Entry Rules Very Specific
The entry criteria may look like:
Long:
- Price above 20 EMA.
- RSI between 40-60 (not overbought).
- MACD bullish crossover in the past 3 bars.
- Volume above its 20-day average.
- No big resistance nearby.
Short:
- Price below 20 EMA.
- RSI between 40-60 (not oversold).
- MACD bearish crossover in the last 3 bars.
- Volume above its 20-day average.
- No big support nearby.
Be precise.
Any fuzzy rules lead to messy decisions.
Step 4: Decide Exit Rules
- Exits are way more important than entries.
- Set three levels for every trade.
- Stop loss – places you are wrong, and you need to get out.
- The common is entry point minus 1-2 ATR for a long. First target for partial profit-taking.
- Should have a better-than-2:1 risk-reward ratio.
- Use trailing stops if there is a profit on the trade.
- When the position is favorable, move stops to breakeven.
Step 5: Backtest Everything
Backtest your strategy on historical data before risking real money in the market.
Most signal (software) carries the back testing functionality.
Look at:
- Win rate (should be above 50%).
- Average wins versus average losses (average wins should exhibit more weight).
- Maximum drawdown (how much you could lose in an unfortunate downward streak).
- Profit factor (gross profit divided by gross loss defined as above 1.5).
- If the strategy does not survive the backtest, it will not survive live trading either. See our complete TradingView backtesting guide for the full step-by-step methodology including Strategy Tester setup, reading profit factor and drawdown, and avoiding overfitting.
Step 6: Trade with Small Lot Sizes, Then Scale Gradually
- Trading should begin with small lot sizes.
- Record every trade in your journal.
- Note what worked and what didn’t.
- Only increase position size after proving consistency over 50+ trades.
- Most traders blow up because they size too aggressively too quickly.
How Professional Traders Use Multiple Timeframes
Here’s a technique that transformed my trading.
Multiple time frame analysis.
- You analyse the same stock across different time frames to get the complete picture.
- Think of it like zooming in and out on a map.
- From far away, you see the overall terrain.
- Zoomed in, you see the details of the road you’re on.
The Three-Timeframe Approach
Higher timeframe (weekly or daily) – identifies the major trend.
- Is this stock in a long-term uptrend, downtrend, or range?
- This is your bias.
- Trade this trend, don’t trade against it.
Mid range (4-hour or 1-hour) – identifies the setup.
-
Search for patterns, cues or levels forming.
-
This is where you name some entry areas as well.
Lower timeframe 15m or 5m – time the entry.
- Fine-tune your exact entry point.
- Wait for confirmation signals on this frame before long.
Example: Swing Trade Setup
- Weekly chart: Stock is in an uptrend above the 20-week EMA.
- Daily chart: Price pulled back to the 50-day MA, RSI has positive divergence.
- Hourly Chart: Bullish engulfing at support, MACD is just about to cross bullish.
The combination of these factors across time frames multiplies your success probability like nothing else!
A single timeframe can lie to you.
Multiple timeframes tell the truth.
The Role of AI and Automation in Modern Trading
AI trading bots are changing the game. But not in the manner most people think.
They’re not magic money machines. They are just highly specialized instruments.
What Humans Can’t Do Better Than AI:
- Speed: Able to handle thousands of data points instantly
- Consistency: Never violations of rule or affected by emotion
- Coverage: Monitor dozens of markets at one time
- Pattern Recognition: Recognize extremely complex patterns in huge datasets
- Backtesting: Test performed on strategies with years worth of data in a matter of minutes
What AI Struggles With:
- Unexpected events: Black swan events in which similar occurrences are absent in historical data.
- Market regime changes: When correlations suddenly start breaking down and relationships change.
- Context and nuance: Understanding why price changes.
- Adaptability: Agile enough to pivot when market conditions substantially change.
These days, winning traders use automated trading signals to:
- Scan markets and identify trading opportunities.
- Feed orders into an automated execution system that achieves them at an exact price.
- Monitor position and maintain stops.
- Compile data and track performance.
Use human judgment to:
- Select and adjust strategy
- Set risk parameters
- Carry out major decisions and monitoring for unusual market conditions
- This Hybrid Approach is Best of Both Worlds.
Platforms like QuantConnect and NinjaTrader let you build, test, and deploy automated strategies while maintaining oversight.
You’re not giving up control.
You’re amplifying your capabilities.
Risk Management: The Unsexy Part That Saves Your Account
Nobody wants to talk about risk management.
It’s boring.
It’s restrictive.
But it’s the difference between traders who last and traders who blow up.
Here’s my non-negotiable risk framework:
Position Sizing Rules
- Never risk more than 1-2% of your total account on a single trade.
- If you have $12,600.
- Maximum loss per trade = $126–$252.
- This means if your stop loss is $1.26 away, you can buy 100-200 shares.
- If your stop is $2.52 away, you can only buy 50-100 shares.
- Position size adjusts based on stop loss distance.
- This keeps risk consistent across all trades.
The 6% Rule
- Never have more than 6% of your account at risk simultaneously.
- If you risk 2% per trade, that’s maximum 3 open positions.
- This prevents correlation risk from wiping you out when multiple trades go wrong.
Stop Loss Discipline
- Every trade gets a stop loss.
- No exceptions.
- No “I’ll watch it and get out if it drops more.”
- That’s how small losses become account-destroying losses.
- Set your stop when you enter the trade.
- Don’t move it further away (only tighter as profit develops).
- If you hit your stop, you were wrong.
- Just accept it and move on.
- Protections for Profits
Once a move begins taking advantage of you:
- At 1R (one time your initial risk), move stop to breakeven.
- At 2R, lock in 50% of profits by moving stop.
- At 3R, two-thirds of the way, trail stop using a trading indicator, such as 20 EMA.
- This lets your winners make a meaningful contribution to the account while protecting you from a sudden reversal.
Choosing the Right Trading Platform and Tools
Your trading platform is your workspace and choosing the right one is crucial.
- For Technical Analysis Traders.
- TradeStation – incredible charting, built-in pattern recognition, extensive backtesting.
- TradingView – powerful charting, large community, works across devices.
- Thinkorswim – professional-grade tools, customisable everything, free with TD Ameritrade.
For Algorithmic Traders
- Interactive Brokers – API access, low costs, supports third-party platforms.
- QuantConnect – cloud-based development, extensive data library, multiple languages.
- AlgoTrader – institutional-grade, multi-asset support, complex strategy building.
For Event** **Driven Traders
- LevelFields – AI-powered event scanning, historical performance data, preset strategies.
- Benzinga Pro – fastest news alerts, unusual activity tracking.
What to Look For
- Reliable data – real-time feeds with minimal lag.
- Customisation – ability to set up your workspace your way.
- Mobile access – trade and monitor positions on the go.
- Reasonable costs – commissions and fees that don’t eat your profits.
- Customer support – help when you need it (especially during market hours).
- Integration – connects with your broker and other tools you use.
Don’t choose based on marketing hype.
Open demo accounts, test drive platforms, and pick what feels right for your workflow.
Final Thoughts: Your Path Forward
Indicators and signals are powerful tools in 2026.
But still they are just tools.
Your true edge will be gained from:
- Really knowing what you are doing, managing risk as if your life depended on it, being disciplined, and constantly learning and evolving.
- Start with one or two technical indicators you know inside-out.
- Then add a stock alert service of some quality to point towards opportunities.
- Backtest your approach thoroughly.
- Start small with real money.
- Track everything.
- Refine your process based on results, not opinions.
The markets reward patience, discipline, and proper risk management.
Not cleverness, complexity, or hoping for the best.
If you’re serious about trading, treat it like a business.
- Document your process.
- Measure your performance.
- Continuously improve.
And remember: the goal isn’t to be right every time.
It’s to make more when you’re right than you lose when you’re wrong.
That’s how you build lasting success with trading indicators and signals in 2026 and beyond.
Explore Quantzee Indicators
- AI Adaptive Quant Toolkit — self-tuning all-in-one indicator suite
- AI TrendPulse — trend detection with strength meter
View all indicators · See pricing