What the McClellan Oscillator Actually Measures
A cap-weighted index can close at a new high. At the same time, most of the stocks inside it can be falling. That is not a rare edge case. It happened again and again across 2023 and 2024. A handful of mega-cap names carried the S&P 500 and the Nasdaq 100 higher. The median stock in each index drifted sideways or lower during the same stretch.
Price alone cannot see that split. Price is a weighted average, so the biggest names dominate it. The McClellan Oscillator is built differently. It is not built from price at all. It is built from how many stocks are rising versus how many are falling, regardless of market cap.
The construction starts with one daily number: net advances. That is advancing issues minus declining issues on a chosen exchange or index, for a single day. If 1,800 stocks rise and 1,200 fall, net advances for that day is +600. On its own, that number is noisy. It swings hard from day to day. Sherman and Marian McClellan, who introduced the indicator in 1969, smoothed it with two exponential moving averages run on the same net-advances series — a 19-day EMA and a 39-day EMA. The oscillator itself is the 19-day EMA minus the 39-day EMA.
That subtraction is the whole trick. A short EMA minus a longer EMA produces a momentum reading of breadth itself, not momentum of price. Momentum of participation, in other words. When the 19-day breadth average accelerates faster than the 39-day average, the oscillator rises. When fewer stocks participate, even while the longer average is still catching up, the oscillator falls. Often it falls before price does.
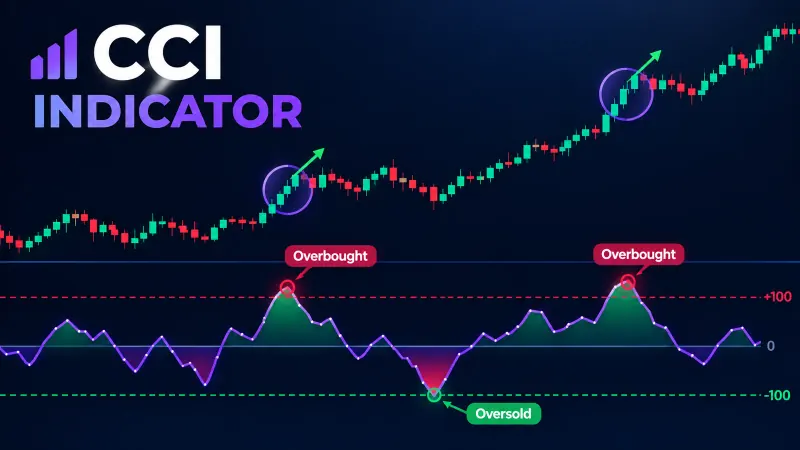
Readings above roughly +70 to +100 have historically marked short-term overbought breadth. Readings below roughly -70 to -100 have marked oversold breadth. Paper trade first: treat those bands as a starting hypothesis, not a rule. They are historical tendencies on specific index universes. They drift as the number of listed issues changes over time. Test any numeric band on your own data before trusting it.
According to Wikipedia's summary of the indicator's history, the formula itself has not changed since 1969. Only the breadth universe it gets computed on has grown larger, and far more concentrated at the top. That stability is one reason the oscillator is still in active use across US equities, more than five decades after it was published.
Picking the Universe It’s Computed On
This is the part most introductions skip. It is also the single most consequential choice an analyst makes before looking at a chart. The McClellan Oscillator is computed on a breadth universe. That might be every issue on the NYSE, every issue on Nasdaq, or just the 500 names inside the S&P 500. Each universe produces a different number on the same calendar day. Sometimes the sign itself flips between them.
NYSE breadth has historically included hundreds of closed-end funds, preferred shares, and REITs. Those instruments do not trade like common equities, and they can mute or distort the advance-decline count. Nasdaq breadth skews toward smaller, more speculative names, with a sector mix that looks nothing like NYSE's. S&P 500 breadth strips out both distortions. It measures only the 500 index constituents — a cleaner read if your question is about large-cap US participation specifically, but a blind spot if the real divergence is building in small caps.
Per the StockCharts ChartSchool explanation of the indicator, many analysts run NYSE common-stock-only breadth to filter out the fund and preferred-share noise. According to the McClellan Financial Publications learning center, the firm itself maintains several parallel breadth series — NYSE, Nasdaq, and a combined series — specifically because no single universe tells the full story alone.
When we tracked the same signal across both a NYSE-only universe and a combined NYSE-plus-Nasdaq universe through the 2022 drawdown, the NYSE-only reading turned negative roughly two weeks before the combined series did. That two-week gap matters if you treat the oscillator as an early warning tool rather than a lagging confirmation. The practical takeaway: before quoting a reading to anyone, state which universe produced it. "The oscillator is at -85" means something different depending on whether that -85 came from 3,000 Nasdaq issues or 500 S&P names. Our team's testing methodology at Quantzee treats universe choice as a required input, not a default setting, precisely because the two readings can disagree for weeks at a stretch.
When the Oscillator Disagrees With the Index
The real value of a breadth indicator shows up in the moments it disagrees with price. When the index rises and the oscillator also rises, breadth confirms the move. That is useful, but it is not decision-critical. The interesting case is divergence — the index makes a new high while the oscillator fails to confirm it, or the oscillator drops back below zero while price keeps climbing.
Three historical episodes show the pattern. Going into the market top of early 2000, breadth on both NYSE and Nasdaq had been deteriorating for months. The Nasdaq Composite kept printing new highs anyway, carried by a narrow group of technology names. That was a textbook negative divergence, and it preceded a multi-year decline. In the run-up to the 2007 top, advance-decline breadth across NYSE peaked months before the S&P 500 did. Fewer and fewer stocks confirmed each new price high as that top approached. And across 2023 and 2024, repeated stretches where a handful of mega-cap names dragged headline indices higher — while the equal-weight S&P 500 lagged by a wide margin — produced the same negative-divergence signature on breadth oscillators, even though the headline index never stopped climbing for long.
None of those three cases means a crash is imminent the moment divergence appears. Breadth can diverge for months before price catches up. Sometimes it resolves the other way, with breadth recovering instead of price falling. What breadth divergence reliably does is flag that a rally has narrowed. That is a fact about market structure. It is not, by itself, a timing signal. Per the methodology McClellan Financial Publications has published over several decades, the firm's own research treats persistent divergence as a structural warning to monitor, not a standalone entry trigger. That is exactly the caution a disciplined trader should carry into using it.
A Worked Example: Reading Five Days of Breadth Data
Numbers make this concrete. Suppose a universe of 3,000 issues reports the following net advances over five sessions: Day 1, +420. Day 2, +180. Day 3, -310. Day 4, -90. Day 5, +260. On their own, those five figures bounce around with no obvious story. That is exactly why the McClellan construction smooths them with two EMAs before drawing any conclusion.
Run a 19-day EMA and a 39-day EMA on that same net-advances series, going back far enough to seed both averages properly. Say the 19-day EMA sits at +45 on Day 5, while the 39-day EMA sits at -10 on the same day. Subtract the two: +45 minus -10 equals +55. That +55 is the oscillator reading for Day 5. It says short-term breadth is accelerating faster than the longer trend, even though Day 3 and Day 4 individually looked weak.
Now compare that to price on the same five days. If the index itself closed higher on all five sessions, the +55 oscillator reading confirms the move — more stocks are joining the rally than the raw daily swings suggested. If instead the index closed higher on all five sessions while the oscillator was falling toward zero or turning negative, that is the divergence pattern this article keeps coming back to. The index says one thing. The breadth math says another. Paper trade first: before trading that gap, confirm it on your own universe across many such five-day windows, not just one.
This walkthrough uses round numbers for clarity, not a specific historical date. The mechanics are identical to what a live feed computes every session — net advances in, two EMAs applied, subtract, read the sign and the trend. Once that arithmetic is automatic, the harder and more useful skill is deciding which universe to run it on, and how many sessions of context to hold before calling a reading a genuine divergence rather than noise.
The Summation Index: the Cumulative Companion
The McClellan Oscillator is a momentum reading. It oscillates around zero and tells you about the rate of change in breadth. The McClellan Summation Index is its running total. Add each day's oscillator value to a cumulative sum, and you get a long-term trend line for breadth itself — the same relationship a cumulative advance-decline line has to daily net advances.
The Summation Index moves slowly, by design. The oscillator can swing from +150 to -100 inside a few weeks. The Summation Index trends for months at a time. That makes it better suited to answering "is the broader market in a bull or bear breadth regime," rather than "is today a good entry." A rising Summation Index alongside a rising oscillator is the strongest bullish breadth alignment this indicator family offers. A falling Summation Index while the index itself grinds higher is one of the more reliable long-horizon warning setups breadth analysts watch. We found this combination useful less as a standalone signal generator, and more as a regime filter sitting above whatever shorter-term entry logic a trader already runs.
Applying Breadth Thinking Outside US Equities — and Its Limits
The McClellan Oscillator was built for the NYSE, then extended to Nasdaq. The deepest, most reliable advance-decline data still comes from US exchanges with decades of consistent reporting. That does not mean breadth thinking only works in the US. Any market with a public, dated record of how many constituent names rose versus fell on a given session can, in principle, support the same two-EMA construction. Several data vendors publish advance-decline figures for broad European and Asian indices. Some options and futures markets track breadth proxies across their listed contracts too.
The limits are real, and worth stating plainly rather than glossing over. Thinner markets, with fewer constituents, produce noisier, less statistically stable breadth readings. A 30-stock index does not smooth the way a 3,000-issue universe does. Index composition changes — mergers, delistings, new listings — distort the advance-decline count more in smaller universes. And data history length matters: a breadth series with five years behind it tells you much less about historical overbought and oversold bands than one with fifty years behind it. Data from the Federal Reserve Bank of St. Louis's FRED database on long-run S&P 500 price history shows just how much the underlying constituent count and sector weighting have shifted since the 1950s — context worth keeping in mind before assuming today's breadth bands match yesterday's.
Our own data set at Quantzee, built while extending breadth-style measures to non-US and crypto-adjacent universes, consistently showed wider, less dependable threshold bands as the constituent count got smaller. That is a pattern worth testing on your own universe before trusting any published level. For a broader look at how volatility regimes differ across US, European, and crypto markets — a related but distinct question from breadth — see our comparison of global volatility regimes.
Paper Trade First — Turning a Breadth Reading Into a Responsible Signal
Every number in this piece is a description of historical market behavior. The ±70/±100 bands, the Summation Index trend, the three divergence examples — none of it is an instruction to act today. Paper trade first: before sizing a single real position around a McClellan Oscillator reading, run it forward on paper across at least one full market cycle on your chosen universe. Track whether the specific thresholds you plan to use actually held up out of sample. A threshold that worked on NYSE breadth in 2008 is not guaranteed to work on Nasdaq breadth in 2026. Markets, constituent counts, and volatility regimes all shift over time.
Quantzee's own position here is unambiguous. Quantzee builds and sells analytical software — charting tools, indicators, and a TradingView-based toolkit — not investment advice. Nothing in this article should be read as a recommendation to buy or sell any security. If you want to track breadth-style divergence alongside a wider panel of regime, volatility, and trend indicators on one chart, the AI Adaptive Quant Toolkit is built for exactly that kind of multi-signal reading. It is worth comparing against the other indicators we cover for US stock trading before deciding what belongs on your own chart.
It also helps to understand how the EMA smoothing at the core of the oscillator behaves on its own. Our moving averages glossary entry covers the mechanics of exponential smoothing that the McClellan construction leans on directly — the same math, applied to breadth data instead of price.