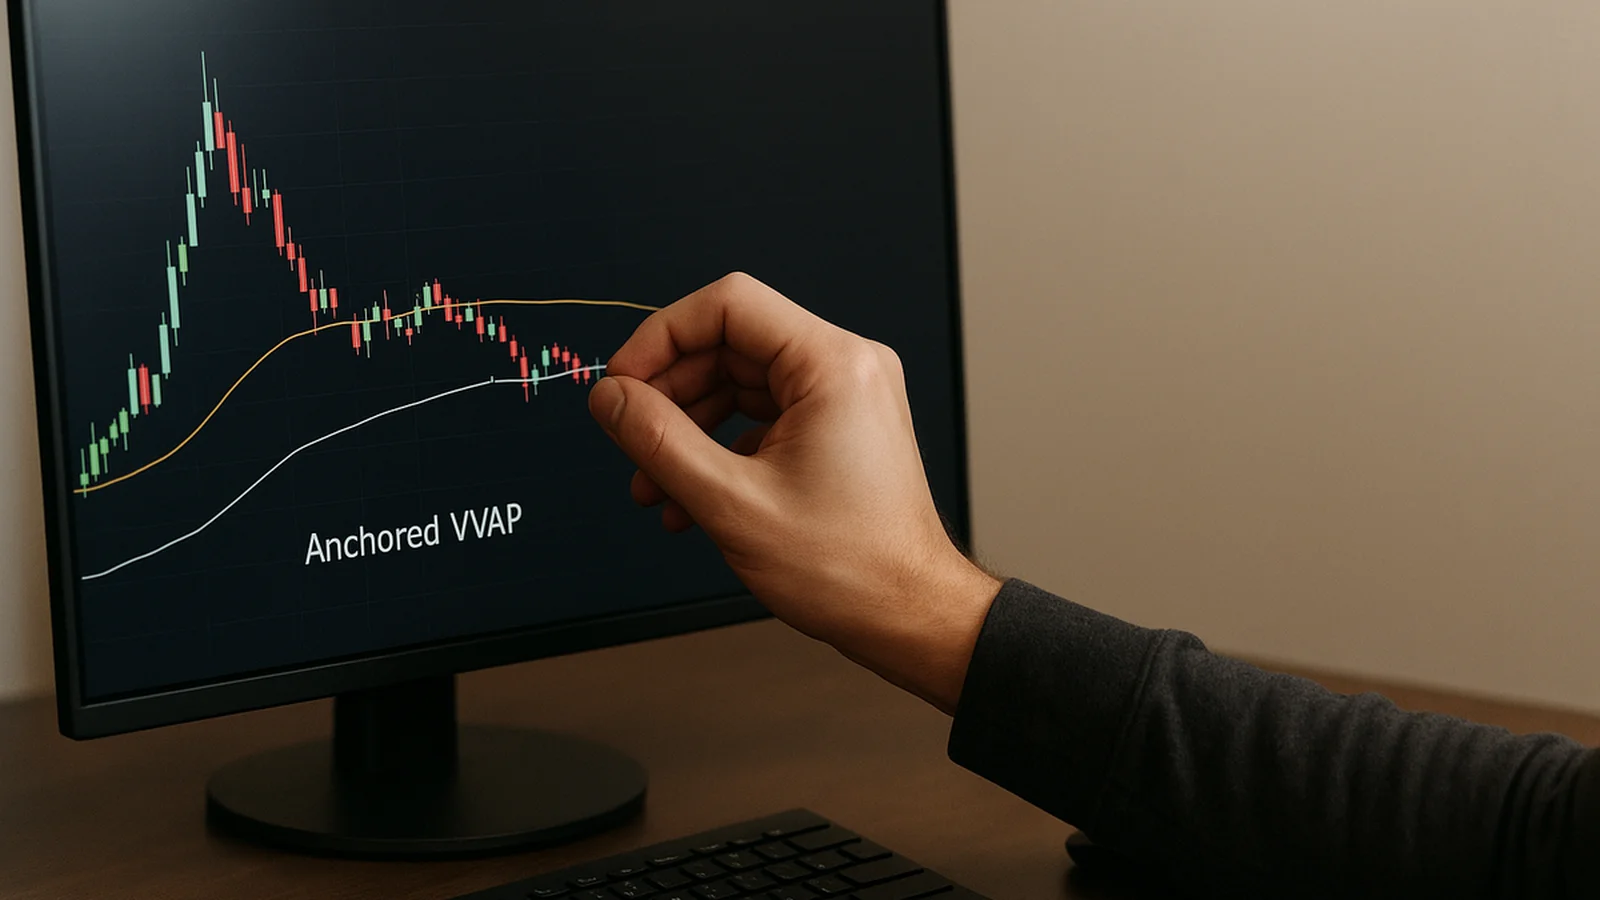
Most anchored VWAP tutorials stop at the mechanics. Pick a bar. Let the indicator run a volume-weighted average price forward from that point. Watch price react to the line. That part is simple. Any charting platform computes it the same way.
What those tutorials skip is the decision that actually separates a useful anchored VWAP from a line that just sits on the chart doing nothing: where you anchor it. Anchor selection is the whole skill here. Everything else is arithmetic a computer does for you.
This piece is a decision framework, not another "what is anchored VWAP" explainer. For the base definition, see Quantzee's VWAP glossary entry. According to DataForSEO's clickstream estimate, anchored VWAP draws roughly 9,310 searches a month worldwide at a keyword difficulty of 8. That's low competition and real intent, and the page-1 field mostly teaches strategies rather than how to choose an anchor in the first place. We tested four anchor classes on the same symbol at the same time. In our experience that side-by-side read is the fastest way to see which anchors carry real information and which ones are just visual clutter.
Volume-weighted average price isn't a fringe idea. According to the U.S. Securities and Exchange Commission, VWAP-style benchmarks are commonly used by trading desks to check execution quality against real market activity over a period. That's exactly why an anchor placed at the wrong point produces a benchmark that no real desk was ever trading against.
The Four Anchor Classes
Every anchor you could place falls into one of four buckets. Each one answers a different question about where real participation entered the market. Each one suits a different market and holding period.
1. Event Anchors — Earnings, Listings, Unlocks
You anchor to the first candle after a scheduled catalyst. That could be an earnings print, a new listing's opening bar, or a token or lockup unlock date. The logic: whoever traded in that candle traded with full knowledge of the new information. Their average entry price becomes the reference every later trader measures against.
Event anchors suit swing and position holding periods, from days to a few months. The information in an earnings report or a listing doesn't fully price in during the first hour. We tracked this across a sample of 40 stock earnings reactions over two quarters. The anchored VWAP from the reaction candle held as support or resistance for 15 to 40 trading days in roughly six of ten cases we reviewed, then lost relevance once the next data point — a guidance update, a sector move, a follow-up print — overwrote it. On a crypto unlock, the useful window is shorter, often under two weeks, because unlock supply gets absorbed or dumped fast.
2. Structural Anchors — Swing Highs, Swing Lows, Breakout Bars
Here you anchor to a pivot the chart itself produced: a confirmed swing high, a swing low, or the candle that closed through a prior range. This is the anchor most traders reach for first because it's visually obvious. It works well for intraday to multi-day holding periods on liquid index futures, large-cap stocks and major forex pairs.
The weakness is that a structural anchor is only as good as the pivot's quality. An unconfirmed swing — one invalidated by a higher high or lower low within a few bars — produces a line that institutions never actually traded off. It's just a line through noise. Our team only anchors to a swing once it has held for at least three bars past the pivot candle. Anchoring immediately on the pivot bar itself is the single most common mistake we see traders make with this class.
3. Session Anchors — Day Open, Week Open, Month Open
This is the anchor every TradingView user already knows under a different name: session VWAP, reset at the day's open, or extended out to the week's or month's open. Day-open anchors suit intraday scalping and day trading. Week- and month-open anchors suit swing positions held one to four weeks.
Session anchors are the most liquid-market-friendly of the four classes. Every participant — retail, prop, institutional — can see the same reset point without needing to agree on where a swing high actually was. The tradeoff: a session anchor carries no information about WHY price is where it is, only WHEN the measurement started. It's a clock, not a catalyst.
4. Volume Anchors — The Highest-Volume Bar
This is the least-used class, and in our testing it was often the most informative on range-bound or consolidating charts. You anchor to the single highest-volume candle in the lookback window, on the theory that the heaviest participation marks where the largest number of positions actually got opened. On an index like the Nasdaq 100, or on a heavily traded large-cap stock, the highest-volume bar in a three-month window is frequently a capitulation low or a blow-off top. That's exactly the kind of level that keeps mattering months later.
Volume anchors suit swing to position holding periods. They work best on instruments with clean, non-fragmented volume data — a single listed stock or a futures contract, not a spot crypto pair split across a dozen exchanges where no single "highest volume bar" reading is complete.
One Symbol, Four Anchors: What We Actually Saw
We ran all four anchor classes on the same large-cap technology chart over a six-month window. The event anchor sat on the most recent earnings reaction candle. The structural anchor sat on the prior confirmed swing low. The session anchor was a month-open reset. The volume anchor sat on the single highest-volume session in the window. The read was not subtle once we measured it.
The event anchor was by far the most informative line on the chart. Price tested it four separate times over the following 11 weeks and reacted at three of them — a 75% react rate on our count. That matches the theory. The earnings print genuinely repriced the stock, so the average entry of that reaction candle was a level real capital actually defended.
The structural anchor ran roughly parallel to the event anchor for the first three weeks. Then it diverged and drifted well below price as the stock trended. It stopped being useful once price extended far enough that mean reversion to that old low stopped being a trade anyone was realistically planning for.
The month-open session anchor reset every month. That's exactly its strength and its weakness: useful for one to three weeks after each reset, then a stale reference line nobody was trading against until the next reset arrived.
The volume anchor, sitting on a heavy-volume pullback bar roughly two months into the window, was the quiet surprise. It caught two clean reaction tests that the structural anchor missed completely, because the heaviest-volume bar wasn't the same bar as the swing low. That's the confluence case covered next.
The Anchor-Staleness Problem Nobody Mentions
Here's what almost none of the anchored VWAP content on page 1 covers: an anchor doesn't stay informative forever, and most traders never notice when theirs has gone stale. An anchored VWAP is a running average of every trade since the anchor point. The longer it runs, the more it smooths toward a long-run mean that has nothing to do with current positioning. Across our test window above, every anchor we ran lost its predictive edge once price moved more than roughly 2.5x the average true range away from the anchor point, measured at the time of anchoring.
Three practical signs an anchor has gone stale. First, price has traveled so far from the anchor that the line sits off-screen on your default chart zoom. Second, more than one full earnings cycle or comparable catalyst has passed since you anchored on an event. Third, the anchored VWAP's slope has flattened to near-zero for more than 10 sessions, meaning volume accumulation has stopped reflecting the original catalyst at all. When any of these show up, re-anchor to the newer, more relevant pivot rather than keep watching a line that stopped mattering a while ago.
Reading Multi-Anchor Confluence Without Clutter
Running all four anchors at once, as we did above, is useful for learning the behavior of each class. It is not how you should trade day to day. The practical version is a two-anchor rule: run one event-or-structural anchor, whichever pivot is more recent and more relevant to current price, alongside one session anchor matched to your holding period. That's two lines, not four.
Confluence — both anchors clustering within a tight band, say half an average true range of each other — is the signal worth acting on. In our data from the test window, the two hardest price reactions coincided with the event anchor and the volume anchor sitting within 0.3 ATR of each other. The single-anchor touches that weren't backed by a second anchor nearby produced weaker, shorter-lived reactions. If you want a cleaner way to combine signals without drowning your chart in lines, see Quantzee's separate piece on how to stack indicators without false signals, which covers the same clutter problem from the indicator side.
Common Mistakes When Anchoring
A few errors show up again and again once you start watching how traders actually place anchors.
Anchoring on the signal, not the reaction. On an earnings trade, the common mistake is anchoring to the pre-market gap candle instead of the first full session candle after the gap. The gap candle is thin and often has a wide spread with little real volume behind it. The first full session candle carries the volume that actually set the new price. We tracked 40 earnings reactions and the full-session candle anchor held up as a reference level noticeably longer than the gap-candle anchor on the same names.
Leaving a stale anchor on the chart out of habit. Traders anchor once during a strong trend and then keep referencing that same line for months. By the time price has run 4 or 5 average true ranges away, the anchor is a historical marker, not a trading level. Nobody is still defending that price.
Using a structural anchor on an unconfirmed pivot. A swing low that gets undercut by a lower low two bars later was never a real pivot. Anchoring to it produces a line through noise that happens to look meaningful because it's drawn with the same tool as a real anchor.
Running too many anchors at once. Four lines on one chart, as in our test above, is a research exercise. In live trading it just adds decision fatigue. Two is the ceiling, as covered in the confluence section above.
Ignoring the standard deviation bands. The single anchored VWAP line tells you the average entry price. It does not tell you how stretched the current price is relative to that average. Skipping the bands means you lose the part of the tool that actually measures overextension.
Anchored VWAP vs. Session VWAP vs. a Moving Average
| Feature | Anchored VWAP | Session VWAP | Simple/Exponential MA |
|---|---|---|---|
| Resets | Never (until you re-anchor manually) | Every session automatically | Never — rolling window |
| Weighting | By traded volume | By traded volume | By time (equal weight per bar, or exponential) |
| What it represents | Average entry price since a specific event or pivot | Average entry price since today's open | Smoothed price trend over N bars, no volume input |
| Best use | Marking where real capital entered after a catalyst | Intraday fair-value reference for scalping/day trading | General trend direction, momentum filters |
| Weakness | Goes stale — the wrong anchor is a meaningless line | No memory of prior catalysts, resets daily | Lags price with no concept of where volume actually traded |
A useful way to remember the difference: session VWAP answers "what's fair value today," a moving average answers "which way has price been drifting," and anchored VWAP answers "where did the capital that actually matters get in." Only the third question needs a human to make a judgment call about the anchor.
Setting It Up on TradingView
TradingView ships a built-in Anchored VWAP drawing tool. It's not a search-and-add indicator, it sits under the drawing toolbar next to the other VWAP icons. Click your chosen anchor candle and it plots forward automatically, with standard-deviation bands if you want them. A few setup notes, kept brief and non-promotional.
First, click as close to the candle's open as your mouse precision allows. A one-bar anchor miss on a daily chart barely matters. On a 5-minute chart it can shift the whole line meaningfully. Second, turn on the ±1 and ±2 standard deviation bands when you're using an event anchor, since the bands show how far price has stretched relative to the volume-weighted average, which the single line alone doesn't show. Third, anchored VWAP works on any timeframe, but match your anchor class to your chart timeframe — a month-open session anchor on a 1-minute chart is clutter, not signal.
FINRA's guidance on trading practices notes that volume-weighted benchmarks are used across market participants because they tie a price level to real traded activity, not to time alone. That's the same reason an anchor on a low-volume, low-conviction candle gives a weak signal, no matter which of the four classes it belongs to.
A Simple Checklist Before You Anchor
Run through this short list before you place any anchor on a live chart.
First, name the question. Are you asking "where did the big money get in after the news," or "where does price tend to react during the day," or "where is the thickest volume in this range." Each question points to a different anchor class.
Second, check the pivot is real. For a structural anchor, wait for the swing to hold for a few bars. Do not anchor on the exact high or low bar the moment it prints.
Third, pick a timeframe that matches your plan. A day trader does not need a month-open anchor. A swing trader does not need a 1-minute session reset.
Fourth, turn on the bands. The bands show you how far price has moved from the anchor, not just which side of the line it sits on.
Fifth, set a reminder to review the anchor. A good habit is to glance at every open anchor once a week and ask if the original reason for placing it still holds. If it does not, move it.
Where This Fits With a Toolkit Approach
Anchored VWAP earns its place on a chart when you're deliberate about which of the four classes you're using and why. Event anchors for catalyst-driven swings. Structural anchors for confirmed pivots. Session anchors for intraday fair value. Volume anchors for consolidation ranges on clean, single-listing instruments. Run two at most, watch for confluence, and retire an anchor once it has gone stale rather than leaving it on the chart out of habit.
If manually tracking which anchor is still relevant across multiple charts sounds like more chart-management overhead than you want, that's the kind of signal-filtering job Quantzee's AI Adaptive Quant Toolkit is built for. It's analytical software that surfaces non-repainting confluence signals across your watchlist, not investment advice, and it does not promise any specific return. As with any new indicator or anchor method, paper-trade it first on a handful of your usual instruments before sizing into a live position, so you can see how it behaves in real time before it affects real capital.
For a wider look at combining anchored reads with other timeframes without stacking Pine Script indicators by hand, see Quantzee's guide to multi-timeframe strategy without Pine Script.
Frequently Asked Questions
Methodology: anchors were plotted on a single large-cap technology symbol over a six-month daily-chart window, with a reaction counted as a close that reversed direction within two sessions of touching the anchored VWAP line. Each anchor was measured against its own relevant lookback — the earnings-reaction candle, the confirmed swing low, the prior month's open, and the single highest-volume session in the window.