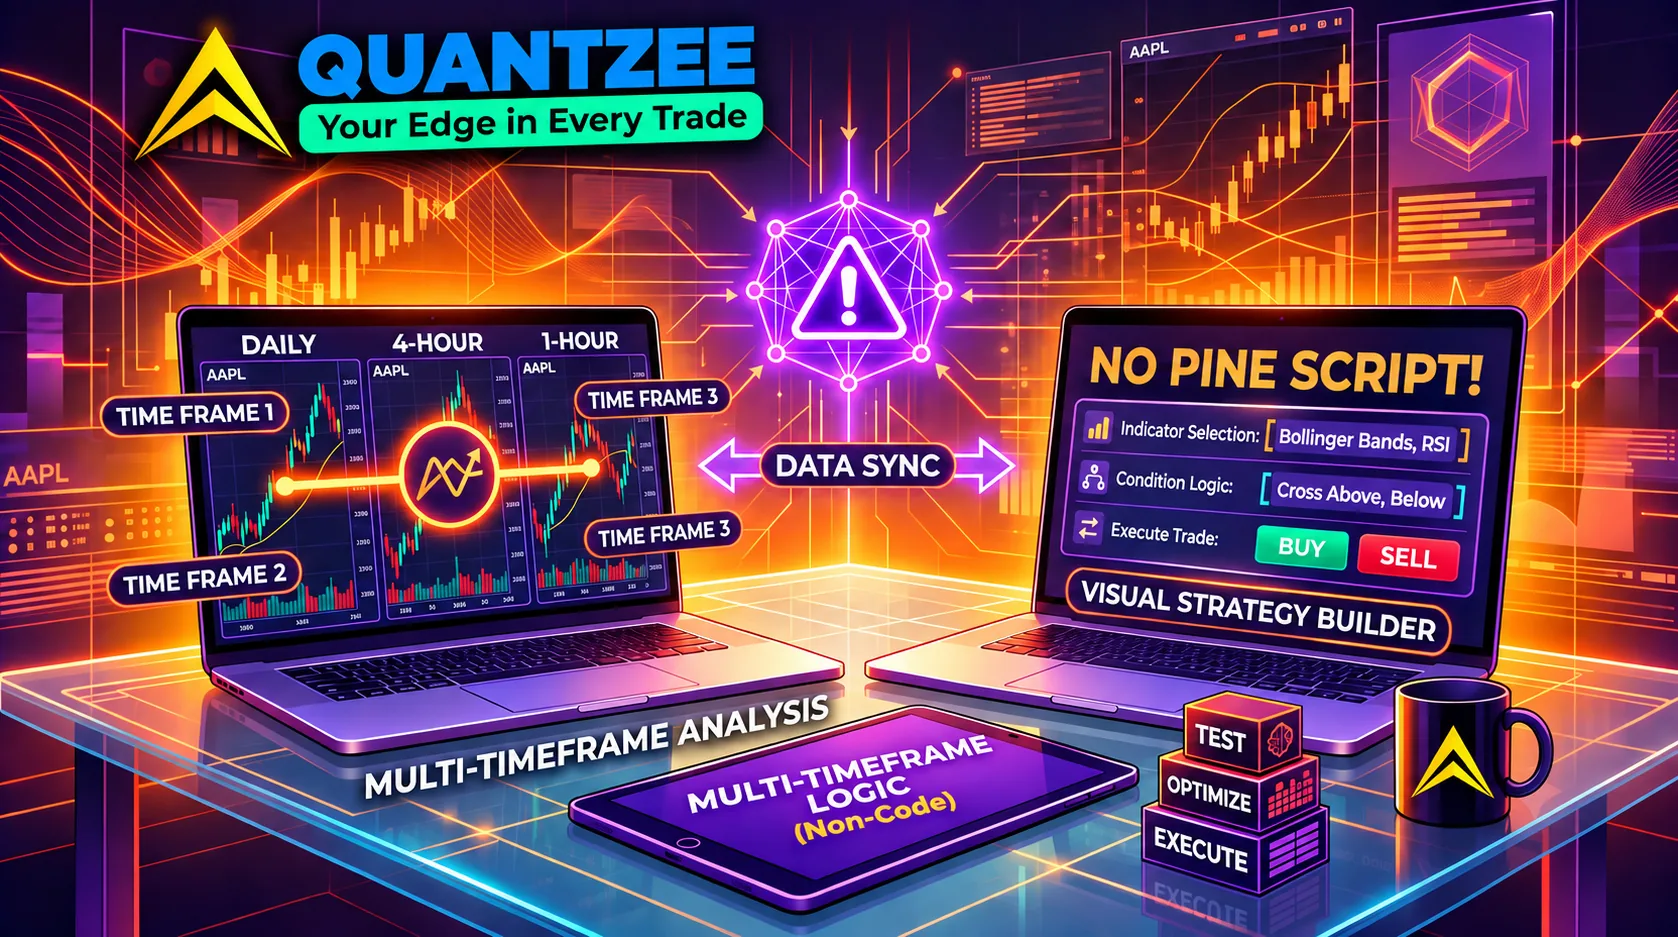
Multi-timeframe (MTF) analysis is one of the most consistently cited edge-improvers in trading — checking that a signal on your entry timeframe agrees with the broader trend on a higher timeframe before you act. It’s also one of the most talked-about-but-rarely-implemented techniques, because doing it properly used to require either constant manual chart-flipping or custom Pine Script to pull higher-timeframe data (request.security() calls, timeframe alignment quirks, repaint traps on the current unclosed higher-timeframe bar) into your working chart.
That barrier has quietly disappeared. In 2026, a well-built non-repainting indicator suite with native MTF dashboards lets you build and run a genuine multi-timeframe confluence strategy — entry timing on a lower timeframe, trend/bias confirmation from higher timeframes — without opening the Pine Script editor at all. This guide walks through exactly how, step by step, using the kind of building blocks that ship in TradingView’s public library and in dedicated MTF-aware indicator suites like Quantzee’s.
This is a global, market-agnostic guide — everything here applies equally to forex majors, crypto perpetuals, gold and other commodities, index futures, or equities on any exchange, in any timezone. There’s nothing region-specific about multi-timeframe analysis; it’s a universal market-structure concept.
⚡ Key Takeaways
- A non-repainting indicator with a built-in MTF dashboard lets you build a real multi-timeframe confluence strategy entirely through settings panels — no Pine Script required
- The load-bearing requirement is non-repainting behavior on the higher-timeframe bias tool; a repainting dashboard's "confirmation" can silently change before the bar closes
- TradingView alerts set to "Once Per Bar Close" (not "Once Per Bar") is the single most important repaint-safety step in the entire no-code workflow
- Most practitioners land in the 4x–12x timeframe ratio range between entry and bias timeframe — too close together adds little noise reduction, too far apart leaves you sidelined
- Confluence reduces certain classes of false signals; it does not eliminate risk, and position sizing/stop-loss discipline remain necessary regardless of how many timeframes agree
A note on positioning before we go further: this article describes a technical analysis workflow using charting software. It is educational content about how to configure indicators and alerts — it is not investment advice, and no strategy described here is a guarantee of profit. Multi-timeframe confluence reduces certain categories of false signals; it does not eliminate risk. Always apply position sizing and stop-loss discipline appropriate to your own risk tolerance, and consider consulting a licensed financial advisor for advice specific to your situation.
Why multi-timeframe confluence works (briefly)
The core idea is simple: a 5-minute chart shows you the current tug-of-war between buyers and sellers, but it doesn’t show you which side has the structural advantage over the next several hours. A 1-hour or 4-hour chart shows the dominant trend, but its entries are too coarse for tight risk management. Combining them — take the lower-timeframe entry signal only when it agrees with the higher-timeframe trend — is a well-documented way to filter out a large share of the false signals that plague single-timeframe systems, particularly during choppy or range-bound conditions where a lower-timeframe oscillator will fire repeatedly in both directions.
The traditional obstacle wasn’t the concept — it was the tooling. Manually flipping between four chart tabs at four timeframes, trying to hold trend state in your head while watching for an entry trigger, is slow and error-prone, especially on fast-moving instruments like crypto or gold. That’s the exact problem MTF dashboards were built to solve.
What you need (no coding required)
- A TradingView account (free tier works for manual analysis; paid tiers unlock more alerts and multi-chart layouts).
- A non-repainting indicator with a built-in multi-timeframe dashboard. This is the load-bearing requirement — an MTF dashboard built on a repainting base signal will show you higher-timeframe “confirmation” that can flip after the fact, which defeats the entire purpose of confluence filtering. Look specifically for indicators that document non-repainting behavior explicitly (not just claim it in marketing copy — test it yourself; see our guide on how to test a TradingView indicator for repainting).
- A trend/bias tool and an entry-trigger tool — these can be the same indicator (many modern MTF indicators combine both) or two separate ones.
- TradingView’s native alert system — this is what turns your no-code setup into something you can actually act on without staring at four screens all day.
None of this requires opening the Pine Script editor. Every step below is done through the indicator’s settings panel and TradingView’s built-in alert creation dialog.
Step 1 — Choose your higher-timeframe bias tool
Your first decision is which timeframe hierarchy fits your trading style:
- Scalping / intraday: 5m entry, 15m and 1H bias.
- Swing trading: 1H or 4H entry, Daily bias.
- Position trading: 4H or Daily entry, Weekly bias.
Pick a trend-following tool for the bias layer — something that gives a clean directional read rather than an oscillating one. SuperTrend-style indicators are popular for this because their output is binary (bullish/bearish) rather than a continuous value you have to interpret. A non-repainting SuperTrend with a built-in MTF dashboard (Quantzee’s SuperTrend Pro+ is one example, with dual confluence and a visible TP/SL ladder) lets you see, directly on your entry-timeframe chart, whether the 1H and 4H trend agree — without switching tabs.
The key setting to configure here (all done in the indicator’s input panel, no code): set the “higher timeframe” input(s) to match your chosen hierarchy, and confirm the dashboard is reading from closed higher-timeframe bars only. Reputable MTF dashboards default to this; if an indicator lets you toggle “confirm on close” and it’s off by default, turn it on — leaving it off means your bias reading on the still-forming higher-timeframe candle can and will change before that candle closes.
Step 2 — Choose your entry-timeframe trigger tool
This is the signal that actually times your entry once the higher-timeframe bias agrees. Common no-code choices:
- VWAP-based mean-reversion or breakout signals — useful for range-bound entry timing within a confirmed higher-timeframe trend. A VWAP tool with multiple anchor modes (session, weekly, custom) lets you pick the anchor that matches your entry timeframe without any scripting — it’s a dropdown setting.
- RSI with adaptive bands and divergence marking — useful for timing pullback entries within a trend rather than chasing breakouts.
- Bollinger Band squeeze/breakout signals — useful for volatility-expansion entries, particularly on instruments that spend a lot of time consolidating (common in forex majors and large-cap equities).
Whichever you choose, the non-repainting requirement applies here too, arguably even more so — an entry trigger that repaints means the backtest you eyeball on the chart literally could not have been traded in real time.
Step 3 — Stack the two on one chart (still no code)
TradingView allows multiple indicators on a single chart pane and multiple sub-panes below it. Add your bias tool (with its MTF dashboard visible) and your entry-trigger tool to the same chart. Now you have, in one view: the current entry-timeframe price action, the entry trigger’s signal state, and the higher-timeframe bias dashboard showing whether 1H/4H/Daily trend agrees.
Your manual (or semi-automated, via alerts — see Step 4) rule becomes something like:
Take the entry-trigger’s long signal only when the bias dashboard shows the higher timeframe(s) also bullish. Skip or fade the signal when they disagree.
This is the entire “strategy” — a filter rule, not a script. You never wrote a line of Pine Script; you configured two indicators’ input panels and applied a simple agreement rule you can even track on paper before automating anything.
Step 4 — Turn it into alerts (still no code)
Once you’re comfortable with the visual confluence rule, TradingView lets you create alerts directly from any indicator’s plotted conditions, no scripting required:
- Right-click the chart (or use the alarm-clock icon) → Create Alert.
- In the “Condition” dropdown, select your entry-trigger indicator and the specific signal (e.g., “Long Signal crossing up”).
- Many modern MTF-aware indicators expose an additional pre-built alert condition that already encodes the confluence logic — e.g., “Long Signal (HTF Confirmed)” — meaning the indicator itself only fires that specific alert condition when its own internal MTF check agrees. This is the highest-leverage no-code move available: the confluence filtering happens inside the indicator’s Pine Script (written by the vendor), and you just select the pre-built alert condition from a dropdown.
- Set alert frequency to “Once Per Bar Close” — not “Once Per Bar.” This single setting is arguably the most important repaint-safety step in the entire workflow, because “Once Per Bar” can fire on an unclosed, still-changing candle, while “Once Per Bar Close” only fires once the bar is final and can’t be edited afterward.
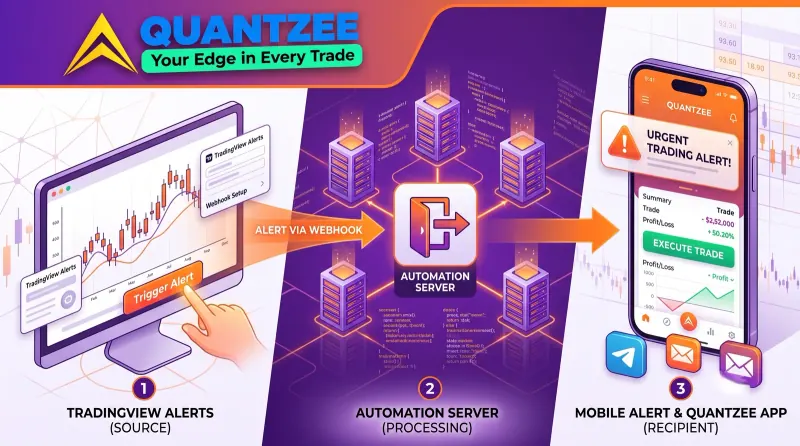
- Choose your notification method — TradingView supports app push, email, SMS (on paid plans), and webhook. A webhook alert can feed into a broker’s automation layer or a bot without you writing the strategy logic yourself — the “automation” is just routing an already-computed no-code signal.
Step 5 — Backtest the rule before trusting it
A no-code confluence rule still needs validation before you trade it with real capital. You can do this without coding too, using TradingView’s replay bar feature: step through historical price action bar by bar, and manually log whether the confluence rule (entry-timeframe trigger + higher-timeframe bias agreement) would have signaled, and what happened afterward. This is slower than a scripted backtest, but it’s genuinely useful because it forces you to see the false-signal-reduction effect (or lack of it) with your own eyes rather than trusting a vendor’s marketing claim.
For a systematic approach to this validation step — including common pitfalls like survivorship bias in manual review and the gap between backtested and live results — see our guides on how to backtest a TradingView indicator and why your backtest doesn’t match live trading.
Common mistakes in no-code MTF setups
- Using a repainting bias tool. If your higher-timeframe dashboard is built on a repainting indicator, the "confirmation" it shows you can silently change, and you won't know until you check the chart again. Always verify non-repainting behavior directly — reload the chart after a higher-timeframe bar closes and confirm the dashboard reading didn't retroactively change.
- Choosing timeframes too close together. A 5m entry with a 15m bias filter provides much weaker noise reduction than a 5m entry with a 1H or 4H bias filter, because 15m and 5m trends are highly correlated in the short run. The bigger the timeframe gap, the more genuine structural information the bias layer adds — but too big a gap (e.g., 5m entry with Weekly bias) can leave you sidelined for very long stretches. Most practitioners land somewhere in the 4x–12x timeframe ratio range between entry and bias.
- Ignoring instrument-specific session structure. VWAP anchor settings, in particular, need to match the instrument's actual trading session — a 24-hour crypto pair anchored to a traditional exchange session will misrepresent the "typical" volume-weighted price. Check your anchor-mode setting against the instrument you're actually trading; most modern VWAP tools expose several anchor modes (session, day, week, custom) precisely so you can match this without coding.
- Alert fatigue from "Once Per Bar" settings. As covered in Step 4, use "Once Per Bar Close." Traders who skip this step report alerts that fire, get acted on, and then the signal disappears moments later on the same still-forming bar — which is a repaint problem showing up through the alert system rather than the chart.
- Treating confluence as a guarantee. Multi-timeframe agreement reduces certain classes of false signals; it does not eliminate losing trades, and higher-timeframe trends can and do reverse. Position sizing and stop-loss placement remain necessary regardless of how many timeframes agree.
A worked example (illustrative, not a trade recommendation)
To make this concrete: suppose a trader is working gold (XAU/USD) on a 15-minute entry chart with a 4-hour bias filter, using a non-repainting SuperTrend for the higher-timeframe bias dashboard and a VWAP mean-reversion signal (session-anchored) for entry timing. The no-code rule: take VWAP reversion-to-mean long signals on the 15m chart only when the 4H SuperTrend dashboard reads bullish; skip or ignore reversion signals against the 4H trend.
This entire setup — indicator selection, MTF dashboard configuration, alert creation with “Once Per Bar Close,” and the confluence rule itself — was built without touching the Pine Script editor. It’s illustrative only; actual instrument choice, timeframe ratio, and risk parameters should be tailored to your own trading plan and validated through your own backtesting or replay-bar review before being used with real capital.
Frequently Asked Questions
Quantzee builds non-repainting, multi-timeframe TradingView indicators for global traders across forex, crypto, commodities, indices, and equities. This article is educational content about a charting workflow and does not constitute investment advice.