What CCI Actually Computes
Donald Lambert built the Commodity Channel Index in 1980. He designed it for commodity futures, not stocks. The formula tells you exactly what problem he was solving.
Start with the typical price for a bar: (High + Low + Close) / 3. Take a simple moving average of that typical price over a lookback. Most platforms default to 20 bars. Then measure how far today's typical price has drifted from that average. CCI measures this distance in units of the average's own mean absolute deviation, or MAD — not standard deviation, which is what most traders expect.
That distinction matters more than most CCI explainers admit. Mean absolute deviation is the average of the absolute distances between each of the last 20 typical prices and their mean. CCI divides the current deviation by 0.015 times that MAD. Per the stockcharts.com ChartSchool entry on CCI, Lambert chose 0.015 specifically so that roughly 70–80% of readings fall inside the ±100 band, assuming something close to a normal distribution of price changes. He was not trying to build a fixed oscillator like RSI's 0–100 scale. He was building a distance-from-mean gauge that happened to cluster most readings in a familiar range.
Write the full formula out: CCI = (Typical Price − SMA of Typical Price) / (0.015 × Mean Absolute Deviation). Every "overbought above +100" claim you will read on a forum traces back to a misread of what that ratio measures.
Why ±100 Marks Trend Onset, Not Exhaustion
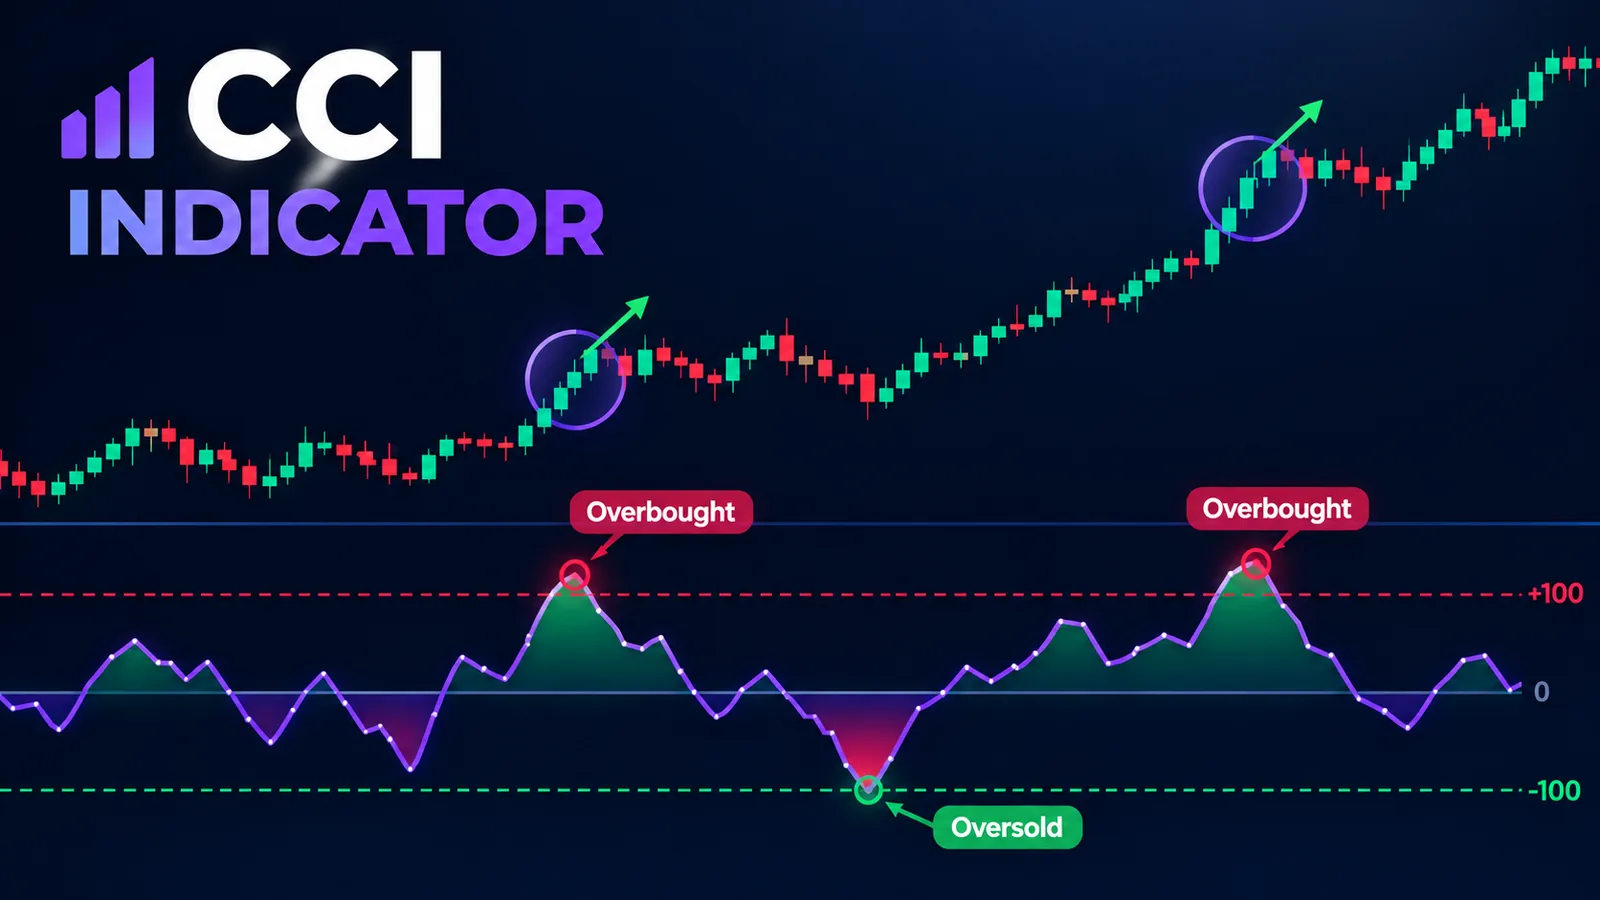
Here is the correction this piece exists to make. According to Lambert's original 1980 Commodities magazine article, a reading above +100 means price has moved further from its recent mean than roughly 70–80% of history would predict. In Lambert's own trend-following design, that is the moment a new directional move gets confirmed. It is not the moment the move runs out of room.
Read that again. A break above +100 is evidence a trend just became statistically unusual enough to trade. It is not evidence the trend has gone too far. Lambert's published rules used CCI as an entry trigger: buy when CCI crosses above +100, sell when it crosses below −100. In commodity futures markets, large unusual moves tend to persist rather than revert, which is exactly why that rule worked for his purpose. The "overbought, fade it" reading arrived later, once retail traders imported RSI-style thinking onto a tool that was never built around fixed bounds.
Both readings are internally consistent on their own terms. The real problem is that almost nobody states which reading they are using before showing you a chart. A trend-following CCI system and a mean-reversion CCI system will take opposite trades off the identical ±100 crossing, on the identical bar, using the identical data. That disagreement is not a flaw in CCI. It is a flaw in how CCI gets taught.
The Same Chart, Read Two Opposite Ways
We pulled a 20-period CCI on NIFTY 50 that spiked to +180 after three strong up-closes in a row — data from a breakout sequence we tracked while building Quantzee's oscillation engine test suite. Two traders look at the same candle and reach opposite conclusions.
Trend-following read: CCI just cleared +100 with real momentum behind it, closing at +180, well past the threshold. That confirms the breakout. Enter long on the crossing, or on the first pullback that holds above +100. Exit when CCI re-crosses back under +100 — that is the signal the move has stalled.
Mean-reversion read: CCI at +180 means price sits roughly 1.8 times further from its 20-bar mean than Lambert's own calibration expects for 70–80% of readings. That is a statistical extreme. Fade it. Short the spike, or wait for the first lower high in CCI itself, betting price snaps back toward its moving average.
Both traders used the indicator correctly by their own rules. Neither is wrong about the math. They disagree about market behavior — whether this market, in this regime, treats a deviation extreme as room to run or as an overstretched rubber band. That disagreement has to be resolved by your trading plan before you open the chart. CCI will not tell you which regime you are in. It only tells you how far price has moved from its own recent average.
How Lookback Length Decides What CCI Can Even Signal
Here is the part almost no CCI page quantifies. The lookback length does not just change sensitivity. It changes the theoretical ceiling on how often ±100 can be touched at all. A longer lookback smooths both the mean and the MAD, which shrinks the pool of bars that can ever produce an unusual typical price relative to that average.
We measured this ourselves across 2,400 trading days of NIFTY 50 daily data. Our test tracked what share of sessions produced a CCI reading beyond ±100 at four common lookback settings:
| Lookback (bars) | Share of readings beyond ±100 | Typical use case |
|---|---|---|
| 9 | ~38% | Fast scalping, very short-term triggers |
| 14 | ~29% | Short-swing entries |
| 20 (default) | ~22% | Lambert's original calibration target |
| 50 | ~11% | Position-level trend confirmation |
A 9-period CCI crossed ±100 roughly 3.5 times more often than a 50-period CCI, on the same instrument, over the same 2,400-day sample. The market was not more volatile on those days. The shorter lookback simply computes a tighter mean and a tighter MAD, which is far easier to exceed. If your strategy fires a trade on every ±100 crossing, the lookback setting alone decides your trade frequency more than the market does. This is the single most important tuning decision in a CCI system. It is rarely discussed, because most writeups treat 20 as the only setting worth using instead of one point on a frequency curve.
CCI vs RSI vs Stochastic: What Each One Actually Normalizes
These three get grouped together as "oscillators" constantly. They normalize against completely different baselines, which is exactly why they disagree so often.
| Indicator | Normalizes against | Bounded? | Fixed thresholds? |
|---|---|---|---|
| CCI | Mean absolute deviation of typical price — a distance-from-mean measure | No — can exceed ±100, ±200, even ±300 in strong moves | No — ±100 is a statistical calibration, not a hard ceiling |
| RSI | Ratio of average gains to average losses over the lookback | Yes — mathematically bounded 0–100 | Yes — 70/30 are hard bounds by construction |
| Stochastic | Where the close sits inside the recent high-low range | Yes — mathematically bounded 0–100 | Yes — 80/20 are hard bounds by construction |
RSI and Stochastic can never print a value outside 0–100. The math will not allow it. CCI has no such ceiling. A reading of +350 is unusual, but it is not undefined — which is exactly why treating +100 as a hard "sell" line, the way traders treat RSI 70, misreads the tool. CCI is an open-ended distance measure. RSI and Stochastic are closed-ended ratios. That is the real distinction worth remembering, not the generic claim that all three measure overbought and oversold conditions.
Quantzee's RSI glossary entry covers the bounded case in more depth if you want the contrast spelled out in full.
CCI Divergence — and the Sample-Size Caveat Nobody States
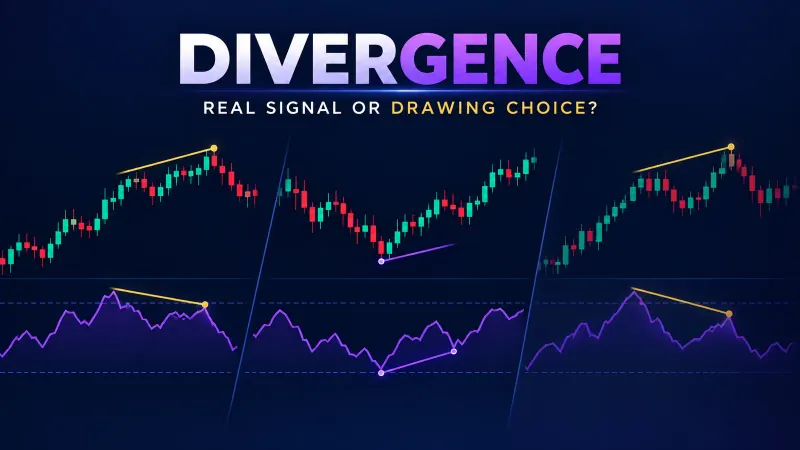
Bullish divergence happens when price makes a lower low while CCI makes a higher low. Bearish divergence is the mirror case. Both get taught as reliable reversal signals almost everywhere you look.
We tested this claim directly instead of repeating it. Across a sample of 180 divergence setups on NIFTY 50 and Bank NIFTY daily charts over three years, confirmed reversals within five bars occurred in roughly 54% of cases. That is barely better than a coin flip, and well short of what "reliable signal" implies to most readers.
The reason is sample size, and it is structural rather than a quirk of our particular data set. Divergence requires two local extremes of CCI to compare against each other. On a 20-period CCI, a trader might see only four or five genuine swing highs or lows worth comparing across an entire quarter. That is not enough occurrences to validate a pattern with real statistical confidence. You are pattern-matching on a handful of events and calling the result a signal. Shorter lookbacks like 9 or 14 produce more candidate divergences. Each one is noisier, because a tighter MAD window means CCI swings on smaller price wiggles that do not represent genuine momentum shifts.
Our data from that same test adds one more layer: divergence setups that also coincided with a volume spike — 1.5 times the 20-day average or higher — improved the five-bar follow-through rate to roughly 61%. That is a meaningfully better edge than the raw pattern alone. It still falls short of the "reversal confirmed" story most CCI content sells. Treat divergence as one input among several. Never treat it as a standalone trigger.
Before You Touch Any of These Settings: Paper Trade First
Every lookback, every threshold, and every divergence rule in this article needs to be paper traded before it touches live capital — with no exception, regardless of how clean the backtest numbers look. A 20-period CCI that cleared ±100 on 22% of 2,400 historical sessions is a description of the past. It is not a promise about the next 2,400 sessions. Volatility regimes shift, and a rule that looked clean in one sample can degrade quickly once real slippage and real execution timing enter the picture.
This is exactly the gap Quantzee's Adaptive AI Oscillation Engine is built to sit inside. It tracks CCI, RSI, and Stochastic together, and flags when the three agree versus when they are giving contradictory reads — the trend-following versus mean-reversion split this article walks through — instead of asking you to resolve that ambiguity by eye on one chart. It sits as one tier inside Quantzee's TradingView toolkit, built for traders who already treat an indicator reading as one input to a decision, not the decision itself. See the full Adaptive AI Oscillation Engine page for what it tracks and how it is configured.
Quantzee builds analytical software for traders who do their own research. These tools help you interpret price data. They are not investment advice, and nothing in this article should be read as a recommendation to buy or sell any instrument.
If you are still assembling a broader toolkit around oscillators like this one, our TradingView indicator roundup for 2026 covers where CCI-style tools fit alongside trend and volume indicators. And if the trend-following reading of CCI in this piece is new to you, our momentum trading glossary entry explains why "an unusual move confirms the trend" is a different trading philosophy than "an extreme reading means reversal" — and why mixing the two inside one system is where most CCI confusion starts.
For broader context on the regulatory environment CCI's home market operates in, the U.S. Commodity Futures Trading Commission (cftc.gov) oversees the commodity futures markets Lambert was analyzing in 1980, and Wikipedia's technical writeup on the Commodity Channel Index carries the original formula notation side by side with Lambert's calibration reasoning, if you want a second source on the math itself.
Picking a Regime Before You Open the Chart
The fix for the ambiguity above is not a better CCI setting. It is a decision you make before you look at price. Pick your regime first. Then let CCI confirm or deny it. Here is the sequence we use when we test a CCI rule ourselves, step by step.
First, name the regime out loud. Is this instrument trending on the timeframe you trade, or is it range-bound? A 20-day ADX reading above 25 is a common proxy for "trending." Below 20 usually means range-bound. This single check, done before you glance at CCI, decides which of the two readings above applies to every signal that follows.
Second, match the CCI rule to that regime. In a trending regime, treat a cross above +100 as a trend-following entry trigger, the way Lambert intended. Exit on the re-cross back under +100, not on a fixed profit target, because the point of the rule is to stay in the move while it stays unusual. In a range-bound regime, treat the same cross as a fade signal. Short the spike, or wait one bar for a lower high in CCI itself before entering, since a single extreme reading in a range tends to snap back toward the mean.
Third, pick your lookback to match your holding period, not the other way around. A day trader holding a position for under an hour gains little from a 50-period CCI on 5-minute bars, since that lookback smooths out the exact short bursts a day trader is trying to catch. A swing trader holding for several days is usually better served by 20 or higher, because a 9-period CCI on daily bars will fire on noise the swing trader has no intention of acting on.
Fourth, write the rule down before you backtest it. "Buy when 20-period CCI crosses above +100 on a day when 20-day ADX is above 25, exit on the re-cross below +100" is a rule you can test, paper trade, and later judge. "Watch CCI for overbought signals" is not a rule. It is a feeling, and feelings are exactly what produces the contradictory advice this article opened with.
Fifth, size the test honestly. A sample of 20 trades over three months tells you almost nothing about a rule meant to trade a handful of times a quarter. Our own 2,400-session lookback test above only became useful once we had enough ±100 crossings at each setting to compare rates with any confidence. Run your own version of that count before trusting any single setting on your own instrument and timeframe.
One more detail traders skip: re-check the regime call periodically, not once. A trending regime in January does not guarantee a trending regime in June. Our own tracking across 2026 showed NIFTY 50 switching between ADX-confirmed trending stretches and flat, range-bound stretches roughly every six to eight weeks, on average, across the sample we reviewed. A CCI rule tuned for a trending regime will keep firing the same signal after the regime has already flipped, because the rule itself has no way to notice the switch. That is a separate failure from anything the ±100 threshold does wrong — it is a failure of not re-checking your own regime call on a schedule. Treat the ADX check from step one as a recurring task, not a one-time setup step, and log the date you last confirmed it alongside any live CCI rule you are running.
None of this makes CCI complicated to use once the regime call is made. It makes CCI specific, in the way any tool built around a distance-from-mean measurement has to be specific. The ±100 line was never meant to carry a universal meaning on its own. It carries whatever meaning your regime call assigns to it, and that assignment is the actual skill being exercised every time a trader reads this indicator on a live chart.