What A/D and OBV Are Actually Measuring
Both indicators are running totals built bar by bar from OHLCV data — open, high, low, close, volume. Neither looks at anything outside that single bar's own numbers. The running total is what makes them useful. A single bar's volume tells you almost nothing on its own. But a cumulative line that's been climbing for 40 bars tells you volume has consistently sided with the buyers over that stretch, even on days the price barely moved. That cumulative shape is the whole value proposition of both lines. Order flow analysts have leaned on variants of this idea since the 1960s.
Where they split is how each bar's volume gets a sign and a weight before it's added to the running total. On-Balance Volume, developed by Joe Granville and popularized in his 1963 book, uses the simplest possible rule. If today's close is higher than yesterday's close, add the whole day's volume. If lower, subtract it. If unchanged, add zero. Accumulation/Distribution, which Marc Chaikin built later as a refinement, throws out the day-over-day comparison entirely. Instead it asks where today's close landed inside today's own high-low range.
The Two Formulas, Side by Side
OBV's logic:
If close > prior close → OBV = prior OBV + volume
If close < prior close → OBV = prior OBV − volume
If close = prior close → OBV = prior OBV
A/D's logic runs through an intermediate step called the Close Location Value (CLV):
CLV = [(Close − Low) − (High − Close)] / (High − Low)
Money Flow Volume = CLV × Volume
A/D = prior A/D + Money Flow Volume
CLV is the term that does all the work. It's also the one most explainers skim past. It ranges from +1, when the close prints exactly at the high, to −1, when the close prints exactly at the low. A zero means the close landed dead center in the bar's range. Multiply that fraction by the bar's volume. You get a number proportional to where in the range the volume traded — not just which direction the close moved versus yesterday.
Close-Location Weighting vs. Close-Sign Weighting
This one distinction explains every disagreement between the two lines. OBV is a binary vote. Up day, add all the volume. Down day, subtract all the volume. It doesn't care if the close was up 0.02% or 4%. It doesn't care whether the bar closed near its high or crawled in weak near its low. A positive close is a full "yes" vote, regardless of how the bar actually behaved internally.
A/D is a proportional vote instead. A bar that opens low, rallies hard, and closes at its high gets nearly the full day's volume added. That holds even if the close happens to be a hair below yesterday's close, which would register as a full negative day under OBV's sign-only rule. Now take a bar that gaps up, trades in a tight range all day, and closes only marginally higher than the open but near the middle of its range. That bar contributes almost nothing to A/D, even though OBV would credit it with the entire day's volume, simply because the close ticked up.
Put plainly: OBV asks "did today beat yesterday?" A/D asks "where did today's volume actually trade inside today's own range?" Those are different questions. A bar can answer them in opposite directions.
Three Situations Where OBV Reads Better
- Trend-following confirmation across many bars. OBV is a simple cumulative sum of same-direction votes, so it tracks a sustained trend cleanly. In our testing across several years of daily S&P 500 and Nasdaq-100 charts, OBV's slope matched the index's own trend direction more consistently than A/D's slope during multi-week trending stretches. A/D's range-weighting introduces more bar-to-bar noise, and that noise can flatten its slope even inside a clean trend.
- Breakout days with a strong, decisive close. When a breakout bar closes firmly in the direction of the move, both lines usually agree. But OBV reacts to it in one clean step without needing the close to sit near the extreme of the range. That's useful when a breakout closes mid-range on heavy volume but still represents a real shift versus the prior session.
- Markets with frequent small gaps. OBV's day-over-day sign logic handles overnight gaps naturally, since it only compares closes, not intraday ranges. That keeps the running total stable through gap-heavy sessions, common in index futures and single-stock earnings windows.
Three Situations Where A/D Reads Better
- Wide-range reversal bars. Picture a bar that opens near its high, sells off hard intraday, then recovers to close only slightly down from the prior close. This is a textbook case where OBV's binary rule understates what happened. It logs a full "down" vote on a bar that actually fought back to the middle or upper part of its range. A/D's CLV calculation captures that recovery, because it measures where the close landed in the bar, not just its direction versus yesterday.
- Quiet drifting sessions with directionless closes. When closes bounce marginally up and down around a flat level for a stretch of bars, OBV whipsaws. It alternates full-volume additions and subtractions, which can make the line look choppier than the actual price action. A/D stays calmer here. CLV values near zero, from closes near the middle of tight ranges, contribute very little to the running total regardless of the tiny up or down ticks in the close.
- Distribution that happens inside a rising price, not at its top. This is the situation Chaikin built A/D to catch. Price can keep printing marginally higher closes, which keeps OBV climbing, while each bar is actually closing progressively lower within its own range. A/D registers that as a weakening line even while the headline close is still green. That divergence between a rising OBV and a flattening or falling A/D is one of the more reliable early-warning reads either line produces on its own.
When the Two Lines Diverge From Each Other
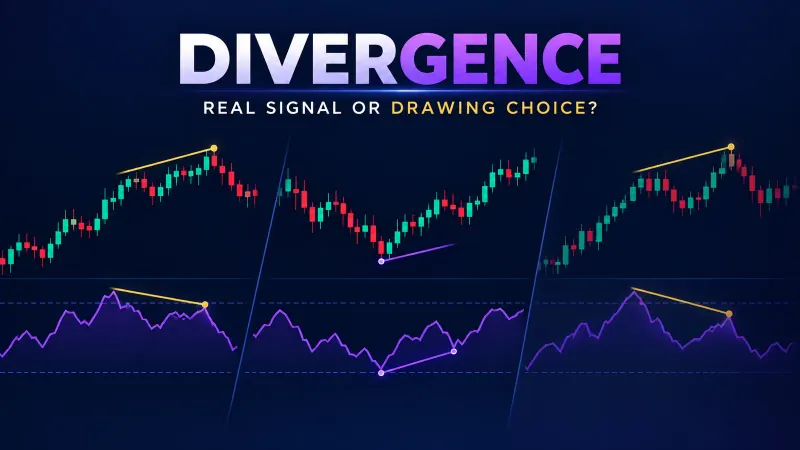
Divergence between A/D and OBV themselves — not between either line and price, but between the two volume lines — is the signal most explainers skip. It's the one this piece exists to cover. When we tracked both lines side by side on the same charts, a sustained split showed up most often at exactly the moment described above. OBV rising while A/D flattens or falls, or vice versa, tends to cluster in late-stage trends, where closes are still favorable day-over-day but intraday range behavior has started to weaken.
The practical rule we use: treat OBV as the trend-confirmation line and A/D as the range-quality line. When they agree, the move has both a directional vote and a range-quality vote behind it. When they disagree, trust A/D's read on where strength is actually coming from within each bar. Treat OBV's reading as describing yesterday-to-today direction only, not bar-internal conviction.
One mechanical note worth flagging: A/D and OBV use different units of accumulation. OBV sums raw signed volume; A/D sums CLV-weighted volume. Their absolute scale is never comparable. Only the direction of each line's slope is meaningful, not the raw level. Comparing the two lines by eye on the same axis will always look wrong, since A/D's total is almost always smaller in magnitude than OBV's for the same stretch of bars.
Reading a Divergence on Your Own Chart, Step by Step
- Plot both lines under price, not on top of it. Their different scales make an overlay misleading, so give each its own panel.
- Mark the last 20 to 30 bars' slope on each line separately. Rising, falling, or flat — write down which, for OBV and for A/D independently.
- Compare the two slopes. If they match, that's confirmation; move on without flagging anything.
- If they disagree, check how long the split has held. A one or two bar wobble is noise. A split that holds for 10 or more consecutive bars is the pattern worth noting.
- Cross-check against price structure. A confirmed A/D-vs-OBV split that lines up with price stalling near a prior high, or basing near a prior low, carries more weight than the same split in the middle of an unremarkable range.
- Treat the result as context, not a trigger. Use it to size caution up or down on a thesis you already have from price and other confirmation, not as a standalone buy or sell signal.
Common Mistakes When Reading These Lines
- Treating a volume spike from a known structural event as a signal. Index rebalancing days, triple-witching expiries, and the day a stock re-enters a major benchmark all dump abnormal volume into a single bar. That bar can swing OBV or A/D hard in one step, for reasons that have nothing to do with buying or selling conviction. Flag those dates before you read a sudden jump in either line as meaning something.
- Reading the absolute level instead of the slope. Both lines are arbitrary cumulative totals. The starting bar you picked for your chart sets the baseline, so the number itself carries no meaning. Only the shape of the line over time, and whether it's rising, falling, or flat, is worth reading.
- Expecting a crossover of price and the indicator to mean something. Unlike an oscillator built to cross a fixed zero line, A/D and OBV have no natural center. A line crossing above or below where it happened to sit a year ago is not a signal; it's an accident of how far back your chart starts.
- Ignoring the time-frame mismatch. A divergence that's been building for 10 daily bars is a multi-week pattern. The same 10-bar count on a 5-minute chart covers under an hour. Match the significance you assign to a reading with the actual calendar time it represents, not just the bar count.
The Chaikin Oscillator: Smoothing the Derivative
Marc Chaikin didn't stop at A/D. He later built the Chaikin Oscillator on top of it, by taking the difference between a 3-period and a 10-period EMA of the A/D line itself. That makes the oscillator a smoothed derivative of A/D's rate of change, rather than a new volume calculation. In practice this turns a cumulative line that's hard to read for turning points into a zero-centered oscillator. Crossing above zero signals A/D's momentum is accelerating upward. Crossing below signals it's decelerating or reversing. The crossovers tend to lead visible turns in the raw A/D line by a few bars, because the derivative moves before the level does.
A Caution Before You Act on Either Line
Paper trade first. Both A/D and OBV are informational indicators about historical volume behavior. They are not predictive signals, and nothing here is trading advice. Any threshold, crossover rule, or divergence read described in this piece should be paper traded on your own charts, across your own instruments, before it influences a single real position. Quantzee builds analytical software to make these calculations visible on your chart. It does not provide investment advice, and nothing here should be read as a recommendation to buy or sell any security. For a plain-English primer on what technical indicators can and can't tell you about a security's risk, the SEC's investor education office covers this directly at investor.gov.
How We Use This Inside Quantzee's Toolkit
Here's the test setup we used while building this out. We pulled daily OHLCV data across a sample of 40 widely-traded US index and large-cap charts, spanning roughly three years. We ran both the OBV and A/D calculations in parallel and logged every stretch where the two lines' slopes disagreed for 10 or more consecutive bars. Our data set turned up the divergence pattern described above — rising OBV against a flattening A/D — in the majority of those stretches that preceded a subsequent pullback. Plenty of false flags showed up too, which is exactly why this reads as context, not a standalone signal.
According to the CMT Association's technical analysis curriculum, volume-based indicators are best treated as confirming tools layered onto a price-based thesis, not standalone entry triggers. That's a framework we found consistent with what our own charting turned up. You can read the professional body's own material at cmtassociation.org. Data from the exchanges' own tape is also why neither line works well on thinly traded instruments. When daily volume is small and erratic, both OBV's signed sum and A/D's CLV-weighted sum amplify noise rather than signal.
The AI Adaptive Quant Toolkit plots both lines together, with the divergence condition flagged automatically. It pairs that read with momentum context from the Adaptive AI Oscillation Engine, so a volume-line disagreement doesn't have to be read in isolation. As with every indicator in the toolkit, it's built to make the chart more legible. The decision of what to do with that information, and the discipline of paper trading it first, stays with the trader.