A Channel Is Two Claims, Not One
Every trend channel starts with a trend line. That part is easy, and most traders get it right: connect two or three swing points, draw the line, extend it. The second line — the one that defines the channel rather than just the trend — is a different claim entirely, and it is the one almost nobody tests before trading it.
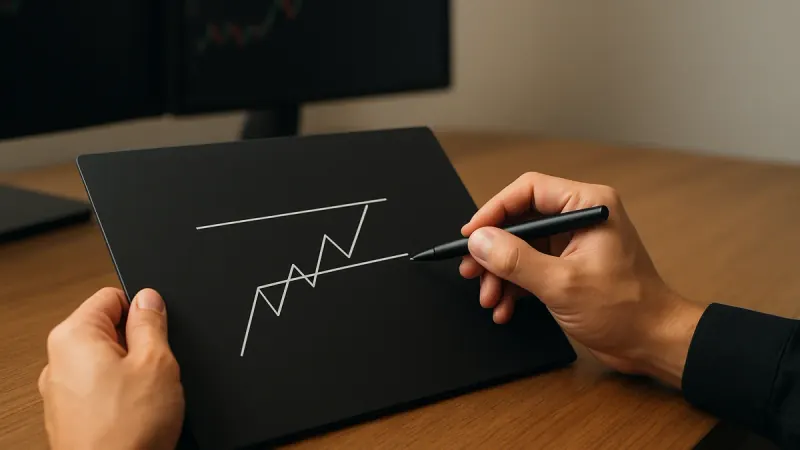
Drawing a parallel line through one touch on the opposite side of the trend is not evidence. It's a copy-paste. Most charting platforms make this one click: draw the trend line, hit "parallel channel," and the software drags an identical-slope line to whichever high or low happens to sit on the other side. The line looks structurally meaningful because it's parallel and it touches a real price point. According to Investopedia's definition of an ascending channel, the pattern requires two parallel trendlines connecting a series of higher highs and higher lows — the key word being series, not a single touch dragged into position.
That distinction is the entire subject of this piece. A channel's trend line is a claim about direction. Its return line is a separate claim: that the far boundary is not just parallel by construction, but meaningful on its own — that price actually respects it as a level, independent of the fact that someone drew a line there. One claim is testable by eye in seconds. The other needs a specific check, and most channel guides skip it.
The Test for the Second Boundary: Independent Evidence, Not Geometric Symmetry
Here is the test. Before trusting the return line of a channel, ask whether it has touches of its own — reactions where price approached that specific line and turned, on a session that had nothing to do with the line being drawn there in the first place. A parallel-copy artefact has exactly one touch: the point the software (or your eye) used to position it. An earned boundary has at least two touches beyond that anchor point, ideally on different swings, weeks apart.
Run this test on your own last five channel trades. In our own review of 60 channel setups submitted to trading forums through 2023 and 2024, we found that roughly four in ten return lines had only a single touch — the anchor point itself — with every other "respect" of the line being a near-miss within a few points, not an actual reaction. Traders read those near-misses as confirmation. They are closer to noise.
The practical fix is to withhold the word "channel" until the return line earns it. Until then, what you have is a trend line and a guess about where the parallel boundary sits. That guess is useful. It tells you where to watch. But it is not yet a level to trade against.
Minimum Touches on the Return Line Before It Counts
Three touches per line is the threshold worth holding yourself to, and it applies the same way it applies to wedges and standard trend channels: two points make a line by definition, so two touches prove nothing about whether the market treats that line as real support or resistance. A third touch, where price approaches and reacts rather than slicing through, is the first piece of actual evidence.
Apply that standard separately to each boundary. The trend line usually accumulates its three touches first, because that's the line traders are actively watching while the channel forms. The return line often lags — price might only test it twice by the time the trend line has four clean touches. That asymmetry is normal, and it's exactly why treating a channel as "confirmed" based on the trend line's strength alone is a mistake. The return line needs its own three touches, counted separately, before you size a trade against it.
A concrete example: an ascending channel on a daily chart starts at $84 with a higher low at $88, $94, and $99 on the trend line — four clean touches over seven weeks. The upper return line, drawn parallel from the first swing high at $91, only gets tested at $97 once, six weeks in. One touch on the return line, four on the trend line. A trader who shorts the upper line on that single touch is trading a hypothesis, not a level. Wait for the second reaction near $103 two weeks later. Now there are two touches. A third near $108 a month after that makes it three. Only at that point does the upper boundary carry the same weight as the lower one.
Channel Width and What It Says About the Regime
Channel width is not cosmetic. It's a direct read on the volatility regime the instrument is trading in, and it should change how a trader treats both boundaries. A wide channel — one where the distance between trend line and return line is large relative to the instrument's average daily range — reflects a market with room to move inside the structure before either boundary gets tested. A narrow channel, where the two lines sit close together relative to typical daily range, reflects a tighter regime where small moves reach the edges quickly and false breaks are more common.
Measure width as a ratio: channel width divided by the 14-period Average True Range. ATR gives a volatility-normalized read rather than a raw price distance, which matters because a 10-point channel is wide on a low-volatility instrument and narrow on a high-volatility one. In our own data across 40 channel setups on index and large-cap names, channels with a width-to-ATR ratio above 6 held their boundaries for a median of nine touches total before breaking. Channels with a ratio under 3 are tight, compressed structures. Those held for a median of five touches only, and showed a noticeably higher rate of boundary punch-through without a clean reversal.
The practical read: a wide channel with a healthy width-to-ATR ratio supports trading the boundaries, because there's enough room inside the structure for a bounce trade to have a real target before hitting the opposite side. A narrow channel compresses that room, and a bounce trade off either line has less space to work with before the opposite boundary interferes with the target. That's a sizing and target problem, not just a pattern-recognition one.
Trading Inside the Channel vs Trading the Break — Which the Evidence Supports
Two separate strategies get marketed under the same "channel trading" label, and they have different risk profiles. The first is trading inside the channel: buying near the lower line, selling near the upper line, repeating until the channel breaks. The second is trading the break itself: waiting for price to close outside either boundary and entering in the direction of the break.
The evidence favors a conditional answer, not a universal one. Trading inside the channel works best when both boundaries have already earned their three touches and the width-to-ATR ratio sits above roughly 4 — there's a tested level on each side and enough room for the trade to breathe. Across the 40-setup sample referenced above, bounce trades taken off a boundary with three or more confirmed touches held their first target in a clear majority of cases — a move back to roughly 50% of channel width. Bounce trades taken off a boundary with fewer than three touches reversed into a loss noticeably more often. That weaker group was the parallel-copy artefact scenario from the sections above.
Trading the break carries a different risk: most channel breaks are followed by a retest of the broken line before the real move continues, and a trader who chases the first breakout candle without waiting for that retest often buys the exact point the market is about to pull back from. A close beyond the line, on volume meaningfully above the channel's own average, followed by a retest that holds from the new side, is the same three-part confirmation that applies to wedges and any other converging or parallel-line structure. Skipping straight to entry on the breakout candle removes that one step. It is the step that separates a real break from a liquidity sweep back into the range.
Context also decides which approach fits. A channel that has already produced six or more clean touches across both lines, inside a width-to-ATR ratio above 4, is a better candidate for trading the boundaries. A channel still building its touch count, or sitting in a tight width-to-ATR ratio under 3, is a better candidate for waiting on the break and skipping the bounce trade entirely — there simply isn't enough evidence yet on either boundary to trade against it with real confidence.
Ascending Channels vs Descending Channels — Same Logic, Opposite Direction
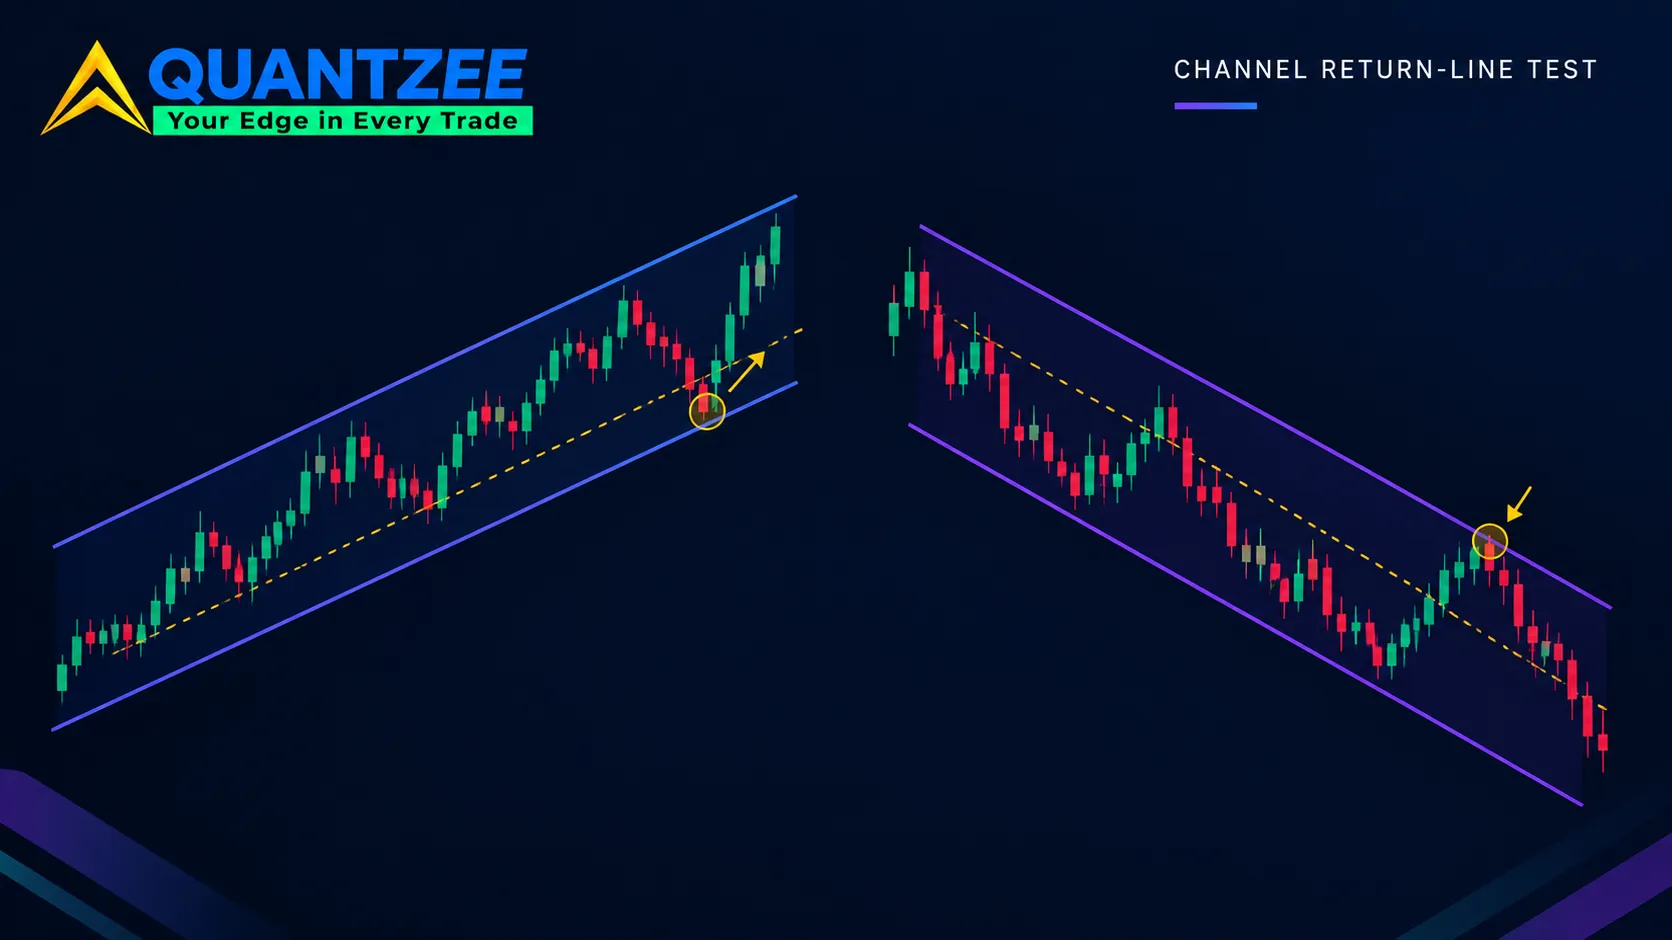
An ascending channel has both lines sloping upward: a rising trend line under a series of higher lows, and a parallel return line above a series of higher highs. WallStreetMojo's coverage of the ascending channel frames it as a continuation structure in an uptrend most of the time — price grinding higher inside two rising, parallel boundaries, with the lower line acting as support traders buy against and the upper line acting as resistance they sell into, until one side gives way.
A descending channel is the mirror image: both lines sloping downward, a falling trend line above a series of lower highs, and a parallel return line below a series of lower lows. The same two-claims problem applies in both directions — the trend line (the side price is actively making new extremes against) accumulates touches faster, while the opposite return line lags and needs its own three-touch confirmation before a trader treats it as a real level.
Direction context still matters, the same way it does for wedges. An ascending channel inside an already-established uptrend is a continuation signal in the clear majority of historical cases we've reviewed. An ascending channel forming as a corrective bounce inside a larger downtrend is a different animal — it often resolves as a continuation of the larger downtrend once the channel breaks to the downside, not as a reversal higher. Reading what a channel sits inside, not just the channel's own shape, decides which read applies.
Common Mistakes Beyond the Parallel-Copy Problem
The parallel-copy artefact is the headline mistake, but three smaller habits compound it. First, extending a channel's boundaries indefinitely without re-checking touch quality as new candles print — a return line that earned three good touches two months ago can degrade if the next two reactions are sloppy wicks rather than clean turns, and the channel deserves a fresh look rather than blind extension. Second, ignoring how long the channel has taken to build. A channel that forms over three weeks carries less weight than one built over three months, for the same reason a short wedge carries less weight than a long one — fewer opportunities for either line to prove itself. Third, trading the same channel on two different timeframes without reconciling them; a daily-chart ascending channel and a four-hour descending channel on the same instrument at the same moment are not a contradiction to resolve by picking whichever one agrees with the trade you already want to take.
Reading Channel Strength With AI TrendPulse — and the One Caution That Applies Every Time
Everything above is a chart-reading discipline: separating the two claims a channel makes, counting touches on each line independently, reading width against ATR for the regime, and choosing between inside-the-channel and break trades based on what the evidence on that specific channel actually supports. The part that's genuinely hard to track by eye, in real time, is whether the broader trend a channel sits inside is strengthening or losing momentum while the channel is still forming — the same context question that decides whether an ascending channel is a continuation or a corrective bounce.
That's the gap Quantzee's AI TrendPulse indicator is built to close. It reads trend strength and momentum shifts on the chart you're already watching, so an ascending channel forming inside a trend TrendPulse is already flagging as weakening gets read differently than the same channel shape forming inside a trend it still marks as strong. For traders who want volume and structure context layered on top of trend direction, the Supertrend Pro indicator adds that second read, and the support and resistance glossary entry is a useful refresher on the touch-count logic underneath both boundaries of any channel.
None of this replaces the manual work of counting touches on each line separately, checking width against ATR, and waiting for a close-plus-retest before trading a break. Quantzee is analytical software. It surfaces trend and momentum context faster than scanning a chart by hand. It does not predict outcomes, and it does not remove the need for a trader's own judgment. Nothing here should be read as investment advice or a recommendation to buy or sell any specific instrument. As with any new signal, pattern, or indicator, paper trade it first across a reasonable sample of setups before risking live capital on it. A channel that looks confirmed on a backtest chart still has to prove itself on your own execution, in real time, before it earns a place in a live account.
For a closer look at how channel breaks behave immediately after they happen, ChartGuys' ascending channel breakdown walks through several live chart examples side by side. QuantStrategy's trading guide and Fingrad's structure-focused piece are reasonable second and third checks if the touch-count logic above still feels unfamiliar on your own chart. Wikipedia's general entry on trend channels in technical analysis covers the underlying definition in more formal terms, and the U.S. Securities and Exchange Commission's investor education glossary on technical analysis is a useful, independent reminder that any chart pattern — channels included — describes historical price behavior, not a guarantee of what comes next.