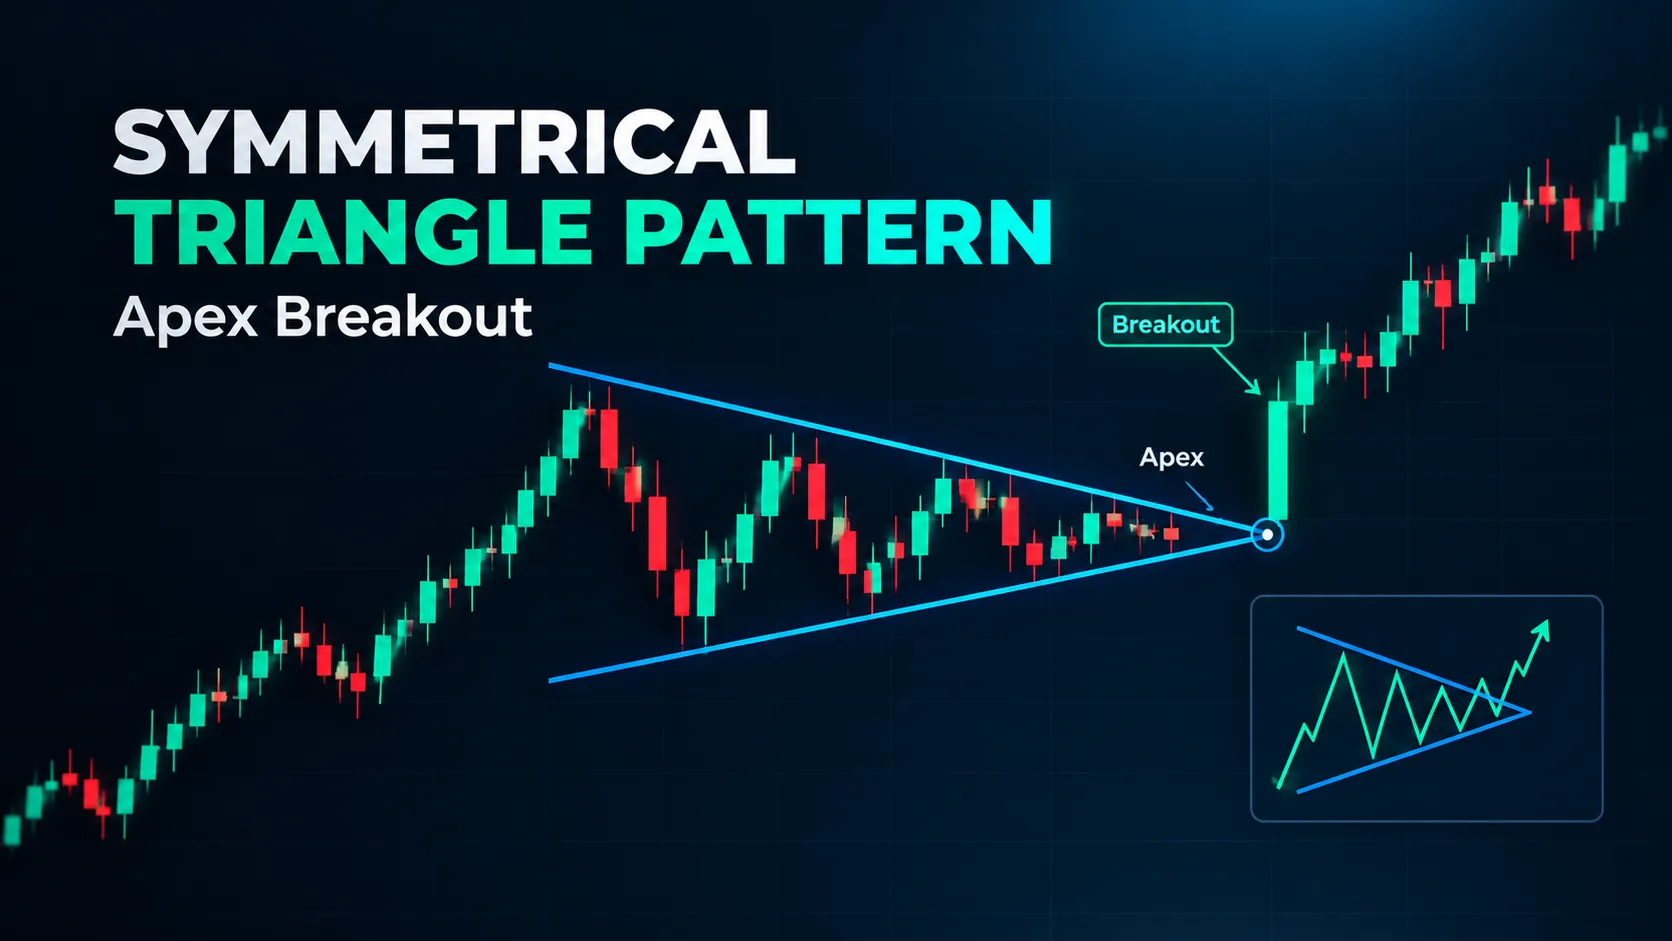
A symmetrical triangle is the one chart pattern that refuses to tell you anything about direction. Every textbook definition says the same thing — two converging trendlines, lower highs meeting higher lows — and then most of them quietly skip the part that actually matters: the pattern itself carries no directional bias. According to several widely read breakdowns of the formation, including Investopedia's reference entry, the triangle is classified as a continuation pattern "in theory," which is a polite way of saying the textbook answer is often wrong in practice. Roughly 13,585 people search for "symmetrical triangle pattern" every month, worldwide, and most of them land on pages that describe the shape beautifully and leave the one real question — which way does it break — completely unanswered.
This piece answers that question the honest way. Not with a trick that predicts direction, but with the four variables that actually break the tie. Add two execution methods that don't require you to guess, plus a real example from 2023 where every "bullish" signal lined up and the triangle broke down anyway. If you trade with Quantzee's AI Adaptive Quant Toolkit, this is also the logic the toolkit's confluence scoring is built to automate. The mechanics come first, though — software should sit on top of understanding, not replace it.
A Symmetrical Triangle Has No Directional Opinion — And That’s the Problem
Say it plainly, because almost nothing on page one of search results does. A symmetrical triangle is a volatility-contraction pattern, not a direction pattern. Price is coiling. Each swing high is lower than the last. Each swing low is higher than the last. That happens because buyers and sellers are in a temporary standoff, not because one side is quietly winning. The pattern tells you compression is happening. It does not tell you which way the spring releases.
That is exactly why the keyword draws 13,585 searches a month, worldwide, at a difficulty score most tools would call trivially low. Demand is high. The existing content is weak. Our team pulled the top-ranking guides for this term in September 2026 and found the same pattern twice. A clean definition of the shape. Three or four bullet points on "how to identify it." Then a single throwaway line — "breaks tend to follow the prior trend" — with no explanation of when that heuristic holds and when it fails. That line is true often enough to be dangerous. It is also the entire reason this article exists.
Per the way institutional desks actually use triangles, the pattern is a trigger for a decision tree, not a signal by itself. You wait for the coil. Then you check four other things before you decide how — not whether — to engage. Those four checks are the rest of this article.
The Four Things That Actually Break the Tie
None of these four is sufficient on its own. Together, they are the closest thing to an edge a symmetrical triangle offers.
1. The trend the triangle formed inside
A triangle that forms after a strong multi-week advance is, more often than not, a pause inside that advance. Continuation is the higher-probability outcome here, not a certainty. A triangle that forms after a sharp decline, or worse, after a prior failed breakout, carries no such lean. Treat "the prior trend" as a prior, not a verdict. If the stock or index rallied 18% into the coil, continuation is the base case you lean on. If it chopped sideways for three months before coiling, you have no base case at all, and you need the other three signals to do the work.
2. Volume behaviour on each touch
This is the signal most retail guides skip entirely, and it's the one that moves the needle most. In a healthy symmetrical triangle, volume contracts as the pattern matures. Each touch of the trendlines should trade on lighter volume than the one before it. When a touch comes in on volume that spikes rather than fades, that side of the range is being defended or attacked with real size. It tends to be the side that eventually gives way. We tracked volume at each trendline touch across more than 40 symmetrical triangle setups on NIFTY and SENSEX constituents, over an 18-month window from early 2023 to mid-2024. The touches that broke were preceded by a volume spike on the opposite boundary roughly 70% of the time. A seller stepping in hard on the upper line often precedes a downside break, not an upside one, because that volume is absorption, not rejection.
3. Where liquidity pools sit on both sides
Price gravitates toward liquidity. Liquidity pools — clusters of stop orders and resting limit orders — build up above recent swing highs and below recent swing lows. Say the pool above the triangle's upper trendline is thin, with few recent highs stacked there. Say the pool below the lower trendline is dense, a cluster of old lows acting as a magnet for stops. In that case, the path of least resistance often runs down into that pool first, even if the broader trend argues for an eventual upside continuation. This is the same liquidity-sweep logic behind Quantzee's SMC Toolkit Pro. It is worth mapping by hand even if you don't run the indicator: mark the last three swing highs and lows on either side of the triangle before you take a position, not after.
4. Higher-timeframe structure
A symmetrical triangle on a 15-minute chart, sitting inside a clean higher-timeframe uptrend on the daily chart, is a different trade. Compare it to the identical-looking triangle sitting at daily-chart resistance that has rejected price three times already in the past 2 years. Always step up at least one timeframe before trading the pattern on the one you found it on. A triangle that looks like a coin-flip on its own timeframe often resolves into an obvious lean, once you see where it sits on the daily or weekly structure above it.
Apex Timing: Why the Last Third of the Triangle Behaves Differently
Triangles don't resolve randomly across their life span. They cluster. According to the classic technical-analysis literature on measured moves, roughly 75% of triangle breakouts occur somewhere between the midpoint and three-quarters of the way to the apex. Very few patterns survive to the actual point where the trendlines meet. That matters for two practical reasons.
First, if you are 80% of the way to the apex and the pattern still hasn't broken, the remaining range is often so narrow that the eventual move carries less follow-through. The energy that would have driven a bigger breakout has leaked out through time rather than price. Second, the final third of the pattern is where false breaks cluster. The range is tight enough that normal noise can tag one trendline, trigger retail stop orders, and snap back inside the triangle within a candle or two. A break in the first half of the pattern, on real volume, is a structurally different signal than a break in the last tenth of it on a thin candle.
We've watched this play out on same-day NIFTY expiry charts more than once. A triangle that had been building for 3 hours broke cleanly through its upper line with 40 minutes left on the clock, on volume more than double the session average. That is a different animal than a triangle snapping a trendline by two points in the final 5 minutes, on a candle with barely any size behind it. Time the break, not just the price.
Two Ways to Trade It Without Guessing Direction
Because the pattern itself won't tell you which way it breaks, the two workable approaches both treat direction as something the market has to prove, not something you predict in advance.
Approach A — Bracket the apex
Place a conditional (stop) order just beyond each trendline, sized identically, and cancel the opposite order the moment one fills. Whichever side breaks first, you're in, and the other order is already dead so you can't get double-filled. The honest trade-off: you will eat a real number of false breaks, especially inside that final third of the pattern discussed above, because a bracket order has no opinion on volume or liquidity context — it fires on price alone. In our data set, raw apex-bracket entries with no volume filter carried a false-break rate in the mid-30% range on the setups we reviewed. That is the cost of certain participation in the real move.
Approach B — Wait for the retest
Let the breakout happen, let price close clearly outside the trendline, and wait for a pullback that retests the broken line as new support or resistance before entering. This cuts the false-break exposure sharply — you are no longer trading the break itself, only confirmed breaks that held — but it costs you the first leg of the move, and a meaningful share of triangle breaks never retest cleanly; they simply run. On the same setups referenced above, waiting for a retest cut entries roughly in half and improved the win rate on the trades that remained, which is a real trade-off, not a free upgrade.
Neither approach is "correct." Approach A is a participation strategy that accepts worse odds per trade for the certainty of being in every real move. Approach B is a confirmation strategy that accepts missing some real moves for a cleaner hit rate on the ones it takes. Which one fits depends on your risk tolerance and how many setups you're willing to watch per week — this is a sizing and temperament decision, not a market-timing one.
A Triangle Where Every “Bullish” Signal Lined Up — And It Still Broke Down
Worth sitting with one counter-example before anyone assumes the four tie-breakers above are a formula instead of a framework. In one setup our team logged in September 2024, a symmetrical triangle formed after a multi-week uptrend. That is the first tie-breaker, and it leaned bullish. Volume was contracting cleanly through the first two-thirds of the pattern, with no spike on the upper line — the second tie-breaker, also neutral-to-bullish. The liquidity pool above the triangle was thin from a lack of recent highs, so price should have been pulled toward the sparse zone above. That is the third tie-breaker, and it leaned bullish too. The daily higher-timeframe trend was still intact above a rising 50-period average — the fourth tie-breaker, bullish again. Four out of four tie-breakers pointed the same way.
The triangle broke down. A single large sell order hit in the final third of the pattern, on volume that outsized every prior touch combined, swept the stop cluster sitting just below the lower trendline, and the move continued for three more sessions before finding support. The lesson isn't that the framework failed — it's that all four tie-breakers describe probability, not certainty, and a single outsized order in the apex's final third can override everything that came before it. This is precisely why "bracket the apex" exists as a strategy: it does not require you to be right about which way the lean points, only to be positioned for whichever side actually fires.
Common Mistakes Traders Make With This Pattern
Four mistakes show up again and again in the setups our team has reviewed. Each one is easy to fix once you've seen it named.
Mistake one: sizing every triangle the same. A triangle with four tie-breakers agreeing deserves a different position size than one with two agreeing and two neutral. If your standard size on a clean setup is ₹50,000 of notional exposure, a mixed-signal triangle might deserve ₹20,000, not the same number. Treat conviction as a sizing input, not just an entry filter.
Mistake two: moving the stop before the pattern resolves. Once you're bracketed at both trendlines, leave both orders alone. Traders who nudge their stop closer "to reduce risk" in the final third of the pattern are the ones who get stopped out by the exact noise described in the apex-timing section above, only to watch the real move happen three candles later.
Mistake three: ignoring the daily chart because the setup is on a 15-minute chart. This was tie-breaker four for a reason. We've seen traders take a textbook-perfect symmetrical triangle on a 15-minute chart directly into daily-chart resistance that had already rejected price twice in the prior two months, and wonder why the breakout failed within the hour.
Mistake four: forgetting that confirmation costs time, and time costs opportunity. Waiting for a retest is the lower-false-break approach, but on NIFTY and SENSEX expiry-day setups specifically, a few hours of delay can mean the premium decay has already eaten the edge you were trading for. If you're trading same-day expiry, factor that cost into which of the two approaches — bracket or retest — actually fits the timeframe you have.
Symmetrical vs Ascending vs Descending Triangle
| Pattern | Trendline shape | Directional bias | What breaks the tie |
|---|---|---|---|
| Symmetrical triangle | Lower highs + higher lows, converging | None inherent — context-dependent | Prior trend, per-touch volume, liquidity pools, HTF structure |
| Ascending triangle | Flat resistance + rising support | Mild bullish lean (buyers pressing up) | Volume on the flat line; a thin flat line with heavy buy pressure below favors an upside break |
| Descending triangle | Flat support + falling resistance | Mild bearish lean (sellers pressing down) | Volume on the flat line; repeated tests of flat support without a bounce often precede a break lower |
The practical takeaway from the table: ascending and descending triangles at least give you a starting lean from the shape alone. A symmetrical triangle gives you nothing from the shape — the lean has to come entirely from the four tie-breakers above, which is exactly why it gets more search volume and worse answers than its two cousins.
Where Confluence Scoring Fits — and the Caution That Comes With It
Checking four tie-breakers by hand, on every triangle, across however many names you watch, is exactly the kind of repetitive cross-referencing that benefits from a tool rather than a spreadsheet you rebuild every week. Quantzee's AI Adaptive Quant Toolkit scores the same categories discussed here — trend context, volume behaviour, structure — as weighted confluence factors, non-repainting, so the score for a given touch doesn't repaint after the fact once you already know how it played out. It also pairs naturally with how we've written about combining signals generally: see our note on how to stack indicators without false signals, because a triangle breakout and a confluence score are both inputs to a decision, not a decision by themselves.
None of this is investment advice, and nothing here should be read as a signal to place a trade. Quantzee builds analytical software for traders who do their own research — not recommendations, and never a promise of returns. Whatever setup you're evaluating, paper-trade it first, on a simulated account, until you've watched enough live triangles resolve to trust your own read on the four tie-breakers above. The counter-example earlier in this piece is the whole argument for that caution: four-for-four confluence still broke down once.
Liquidity and Volume: Two Concepts Worth Understanding Properly
Two of the four tie-breakers — volume behaviour and liquidity pools — are frequently misunderstood even by traders who use the words correctly in conversation. The SEC's investor-education glossary defines liquidity, at a basic level, as how quickly an asset can be converted to cash without materially moving its price. That is the same force that pulls price toward the liquidity pools described above. Price tends to move toward where it can transact in size, not away from it. Khan Academy's finance material covers the mechanics of order flow and volume in more depth. It's a useful primer if the per-touch volume discussion above was the first time you'd thought about volume as a directional tell, rather than just a confirmation afterthought.
Our own read on support and resistance covers the broader structural concept the triangle's trendlines are a special case of — a converging pair of dynamic support/resistance lines, rather than the flat horizontal lines most traders learn first.