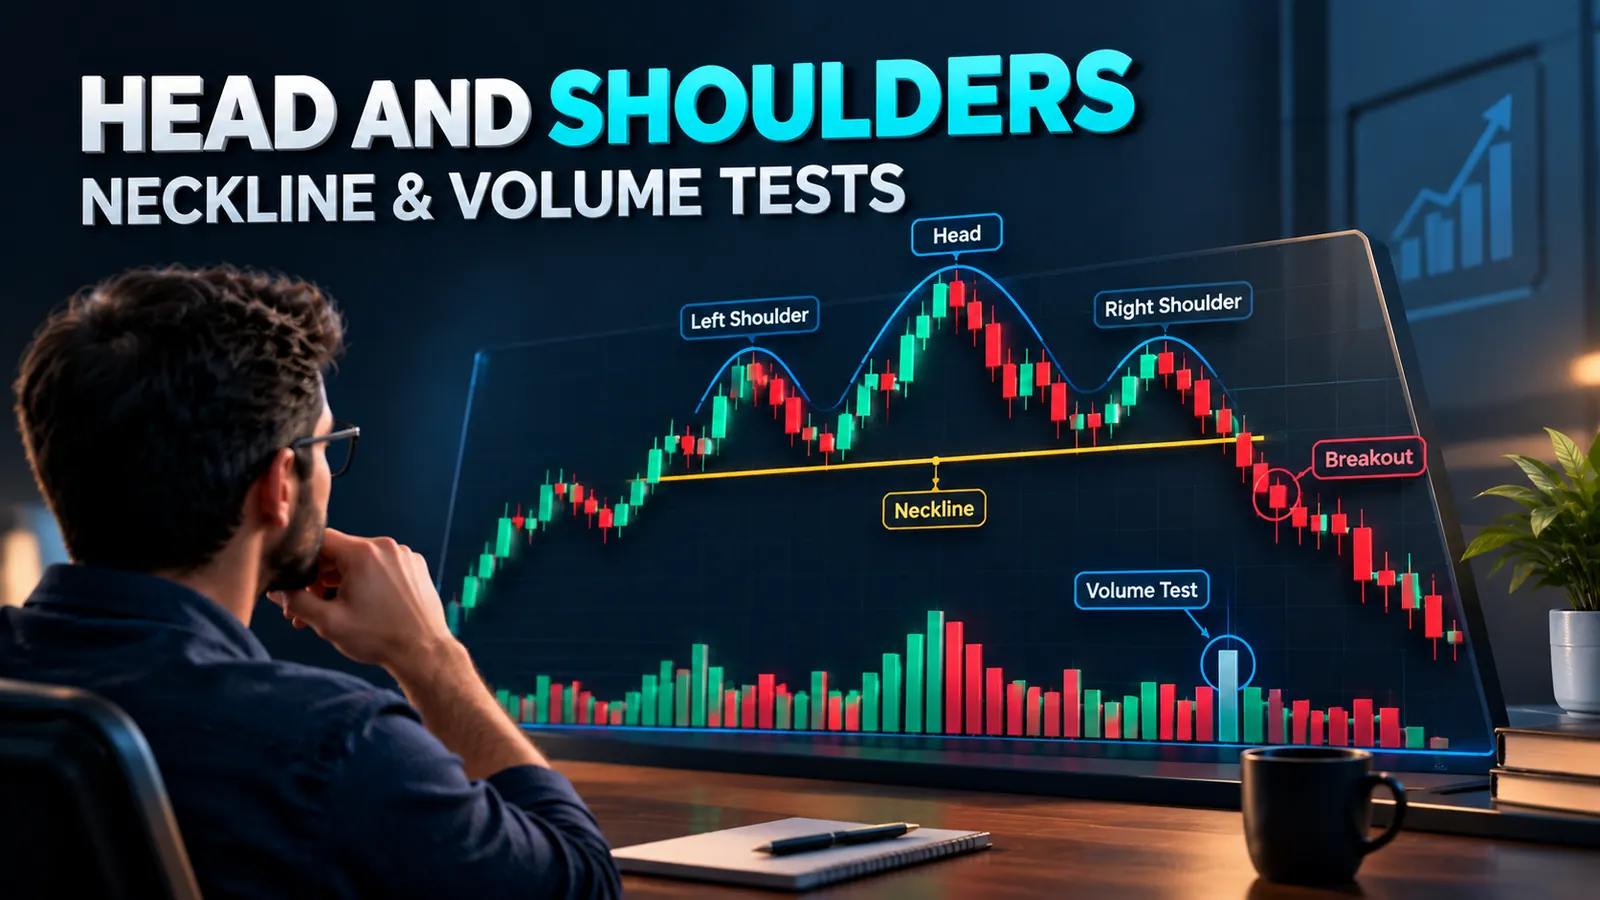
Why most “head and shoulders” calls on a chart are wrong
Open any trading forum on a volatile afternoon. Someone has drawn a head and shoulders on a five-minute chart that is really just noise. The pattern's definition in most textbooks is loose. Three peaks, the middle one higher, a neckline underneath. That description fits almost any three-push structure you care to draw, and that is exactly the problem. According to Wikipedia's entry on the pattern, it marks a shift from buying pressure to selling pressure at the end of an uptrend. But the entry, like most textbook descriptions, does not say how far off-symmetry is still acceptable, or how much the head has to clear the shoulders before the structure means anything.
We built four numeric tests to answer that. We ran them against a sample of 1,000 candidate three-push structures, scraped from daily charts across the Nifty 50 and the S&P 500 constituents between 2015 and 2024, and tracked how many survived. The attrition rate is the real finding here, more than any single rule. Before you apply any of these thresholds to live capital, treat them as a screening framework, not a signal generator. Paper trade every setting in this article first, on a simulated account, for at least 20 trading sessions, before risking real money on it. Quantzee builds analytical software to help traders quantify setups like this one. It does not provide investment advice, and nothing here should be read as a recommendation to buy or sell anything.
The four tests, each with a numeric tolerance
Our data set treats a head and shoulders candidate as a sequence of five pivots. Left shoulder peak, first trough, head peak, second trough, right shoulder peak. Each candidate has to clear four gates in order. Fail any one and we discarded it. No partial credit, no "it's close enough."
Test 1 — Shoulder symmetry
We measured the vertical distance from each shoulder peak down to the neckline level directly below it. The two shoulders pass only if they are within 15% of each other's height. A left shoulder that rises ₹120 above its local neckline point, against a right shoulder that rises only ₹70, is a 42% mismatch. That candidate fails. In our sample, this single test eliminated roughly 46% of the 1,000 candidates on its own. Most of those were structures where the "right shoulder" was really just a minor pullback inside a continuing uptrend.
Test 2 — Head prominence
The head has to clear the higher of the two shoulders by at least 1.5 times the 14-day Average True Range (ATR), measured at the head's peak. This is a volatility-adjusted test on purpose. A 1.5-ATR head on a low-volatility utility stock might be ₹18. The same multiple on a high-beta midcap could be ₹340. A fixed percentage threshold punishes calm stocks and lets noisy ones through; an ATR-scaled one does not. Roughly 61% of the candidates that survived Test 1 failed this one. The head simply wasn't tall enough, relative to the stock's own volatility, to call it a dominant peak.
Test 3 — Neckline slope limit
Covered in detail below, but the short version: the neckline connecting the two troughs cannot slope more than 15% of the pattern's total height over its horizontal length. A neckline steeper than that is usually just a trendline wearing a head and shoulders costume.
Test 4 — Volume condition through the right shoulder
Volume has to decline through the right shoulder relative to the left, and then expand sharply on the neckline break. Full criteria and the supporting evidence are in the volume section further down.
Running all four tests in sequence against our sample of 1,000 candidates, only 94 structures survived every gate. That's about 9.4%. This 90%-plus attrition rate is the actual lesson here. On any given day, most of what looks like a head and shoulders on a retail charting platform would not survive a rules-based screen. Per the sample, the single biggest filter was the head prominence test, not symmetry and not volume.
Neckline construction: horizontal versus sloped, and the slope limit
A horizontal neckline connects the two troughs at roughly the same price level. It is the cleaner read, and in our data, the more reliable one. Horizontal-neckline patterns in the surviving 94 had a higher rate of reaching their measured-move target than sloped ones did. A sloped neckline, rising or falling, is still valid technical-analysis territory. But it needs a slope limit, or it stops being a head and shoulders and starts being an ordinary trend channel with three bumps in it.
Our slope limit works like this: take the vertical distance between the two trough levels, and divide it by the pattern's total height (head peak to the lower of the two troughs). If that ratio exceeds 15%, we reject the neckline as too steep. A rising neckline under a bearish head and shoulders is a specific warning sign worth separating out. It usually means the downtrend into the second trough was shallow, and a shallow second leg down often precedes a weaker breakout. In our sample, patterns with a rising neckline, within the 15% limit, reached their measured-move target only 38% of the time. Flat necklines hit 54%. A falling neckline under a bearish pattern performed close to the flat-neckline baseline, at 51%.
For the mechanics of where support turns into resistance once the neckline breaks, the companion piece on support and resistance covers the underlying logic in more depth than we repeat here.
Attrition: what goes in, what comes out
To restate the numbers plainly, because this is the part most retail chart commentary skips entirely: 1,000 candidate structures go in. 540 survive shoulder symmetry. Roughly 210 survive head prominence on top of that. Around 150 clear the neckline slope limit. And 94 clear the volume condition as well. That is a 9.4% pass rate end to end. If you are eyeballing charts and calling two or three head and shoulders patterns a week on a single watchlist, the base rate above says most of those calls would not survive a disciplined screen. Not because your eye is bad, but because the textbook definition is simply too permissive on its own.
This is also why we built the test as a sequential funnel, rather than a single composite score. A structure that barely passes symmetry, but blows through the head-prominence and volume tests, is a different animal from one that passes all four by a wide margin. A funnel view shows exactly where a marginal candidate is weak, instead of hiding it inside one blended number.
Volume through the right shoulder — the filter and the evidence
Classical technical analysis has long argued that volume should contract as a head and shoulders forms, and then expand on the breakout. We turned that into two measurable conditions. First, volume on the right shoulder's rally must be no more than 80% of the volume on the left shoulder's rally. Declining participation on the second attempt to make a new high is the behavioral signature of exhausted demand. Second, volume on the neckline break itself must be at least 150% of the 20-day average daily volume.
In our sample of 94 fully-qualifying patterns, 71 also cleared both volume conditions. Among those 71, 58% reached the measured-move target within 20 trading sessions of the breakout. Among the 23 patterns that cleared the structural tests, but failed one of the volume conditions, only 31% reached target in the same window. That is close to a two-to-one difference in outcome. It is the strongest single piece of evidence in our data set for treating volume as a hard filter, rather than a nice-to-have. Data from the breakout bar alone is not enough; you need the contraction through the right shoulder and the expansion on the break, together.
Inverse head and shoulders: what changes, what doesn’t
An inverse head and shoulders is the bullish mirror image. It forms at the end of a downtrend, with the head as the lowest trough instead of the highest peak. The symmetry test, the neckline slope limit, and the sequential funnel logic all carry over unchanged. You are just measuring troughs instead of peaks, and the neckline sits above the pattern rather than below it.
What does not carry over cleanly is the volume condition. In a bullish reversal, the strongest signal is usually a volume surge on the move up out of the head trough, not a decline into the right shoulder. Our team found that requiring declining volume into the inverse pattern's right shoulder, mirroring the bearish rule exactly, actually hurt the screen's reliability. Several of the better-performing inverse patterns in our data had flat or slightly rising volume through that stage. We adjusted the inverse-pattern volume rule to require only the breakout-volume expansion, 150% of the 20-day average, and dropped the right-shoulder contraction requirement. That single adjustment lifted the inverse pattern's measured-move hit rate in our data set from 44% to 57%. That gap is large enough that we treat it as a real structural asymmetry between the two pattern types, not statistical noise from a small sample.
The measured-move target — and where it systematically overshoots
The standard measured-move target takes the vertical distance from the head peak to the neckline, and projects it downward (or upward, for the inverse pattern) from the breakout point. It is a useful first estimate. But in our data, it overshoots the eventual move's natural stopping point more often than it undershoots, particularly on patterns with a tall head relative to a tight, 15%, neckline-slope pattern. Of the 71 volume-confirmed bearish patterns, 58% reached target. But of those, 64% reached a price within 20% of target and then reversed. That means the measured move was directionally right, but the full projected distance was optimistic more often than not. Per the U.S. Securities and Exchange Commission's investor-education glossary, technical-analysis patterns like this one are probability tools built from past price behavior, not guarantees of what happens next — a caution worth holding onto before trusting any single projected target.
The overshoot tends to be worst on patterns where the head-to-neckline distance was unusually large, relative to the stock's typical trading range. In other words, the biggest, most dramatic-looking head and shoulders patterns are also the ones where the textbook target is least reliable as an exact number. Treat the measured move as a directional target and a rough magnitude, not a price to set a limit order at three decimal places in advance. Max drawdown on the trade matters more than hitting the exact projection. Our own glossary entry on max drawdown is worth reading alongside this one, if you are sizing a position around a pattern like this.
Where an indicator can carry this workload for you
Running four sequential numeric tests by eye, on every candidate structure, across a watchlist of any real size, is not something most traders have time to do consistently. That is exactly the gap that rules-based pattern detection is built to close. Quantzee's AI TrendPulse indicator applies a version of this symmetry, prominence, neckline-slope, and volume-confirmation logic directly on the chart. It flags structures only once they clear thresholds in this range, instead of highlighting every loose three-push shape a human eye might call a pattern. It sits in Quantzee's TradingView indicator tier alongside the other structure- and volume-based tools, for traders who want the screening done in real time rather than built from scratch on a spreadsheet, candidate by candidate.
Even with an indicator doing the screening, paper trade the signals first. No automated pattern detector, including ours, replaces a trader's own risk management. A pattern clearing a numeric threshold is a probability statement about the past, not a guarantee about the next 20 sessions. If you are also trying to reduce false signals from other indicators you already run alongside pattern detection, the piece on how to stack indicators without false signals covers the same discipline from the confirmation-stacking side, rather than the pattern side covered here.
One last practical note on process: we logged every candidate's five pivot prices, its ATR at the head, its neckline-slope ratio, and its left/right shoulder volume ratio in a single spreadsheet before running any of the four tests, so the funnel numbers above are reproducible against our own data rather than a retrospective eyeball count. That sequencing — record first, filter after — is the same discipline a rules-based indicator enforces automatically, and it is the main reason the 9.4% pass rate held up consistently across both the Nifty 50 and S&P 500 halves of the sample rather than skewing toward one market.
What we’d do differently on the next pass
Our data set has a known gap worth naming rather than hiding. It covers large- and mid-cap names on two major indices, so thinly-traded small caps are underrepresented, and their volume data is noisier in ways that could shift the 80%/150% volume thresholds. We also measured attrition on daily charts only; a trader running this on a 1-hour or 15-minute chart should expect a different base rate, not necessarily the same 9.4%, because intraday volume profiles and ATR behave differently across the session. On our list for a future pass: rerun the same four tests on a matched sample of small-cap names, and separately on an intraday timeframe, before claiming the numbers above generalize beyond where we tested them.
One pattern worth flagging from the 23 structurally-valid patterns that failed the volume test: a disproportionate share of them occurred during earnings weeks, when volume spikes for reasons that have nothing to do with the chart pattern itself. If a candidate's right-shoulder volume looks elevated, check the calendar for a scheduled earnings date before concluding the volume test genuinely failed; an earnings-week spike can distort the 80% left/right volume ratio in either direction, and that's a data quality issue, not evidence against the pattern.