The Volatility Asymmetry, Measured Rather Than Assumed
Equity and index volatility is asymmetric by construction. Implied volatility and realized volatility both rise faster on down moves than they fall on up moves — a dynamic documented for decades in options-market structure and echoed in investor-education material from the SEC's Office of Investor Education and the CFTC's market literacy resources, both of which flag volatility clustering around sharp declines as a recurring feature of modern markets, not a one-off. For a trader reading a flag pattern, this matters because the flag itself is a volatility statement before it is a direction statement.
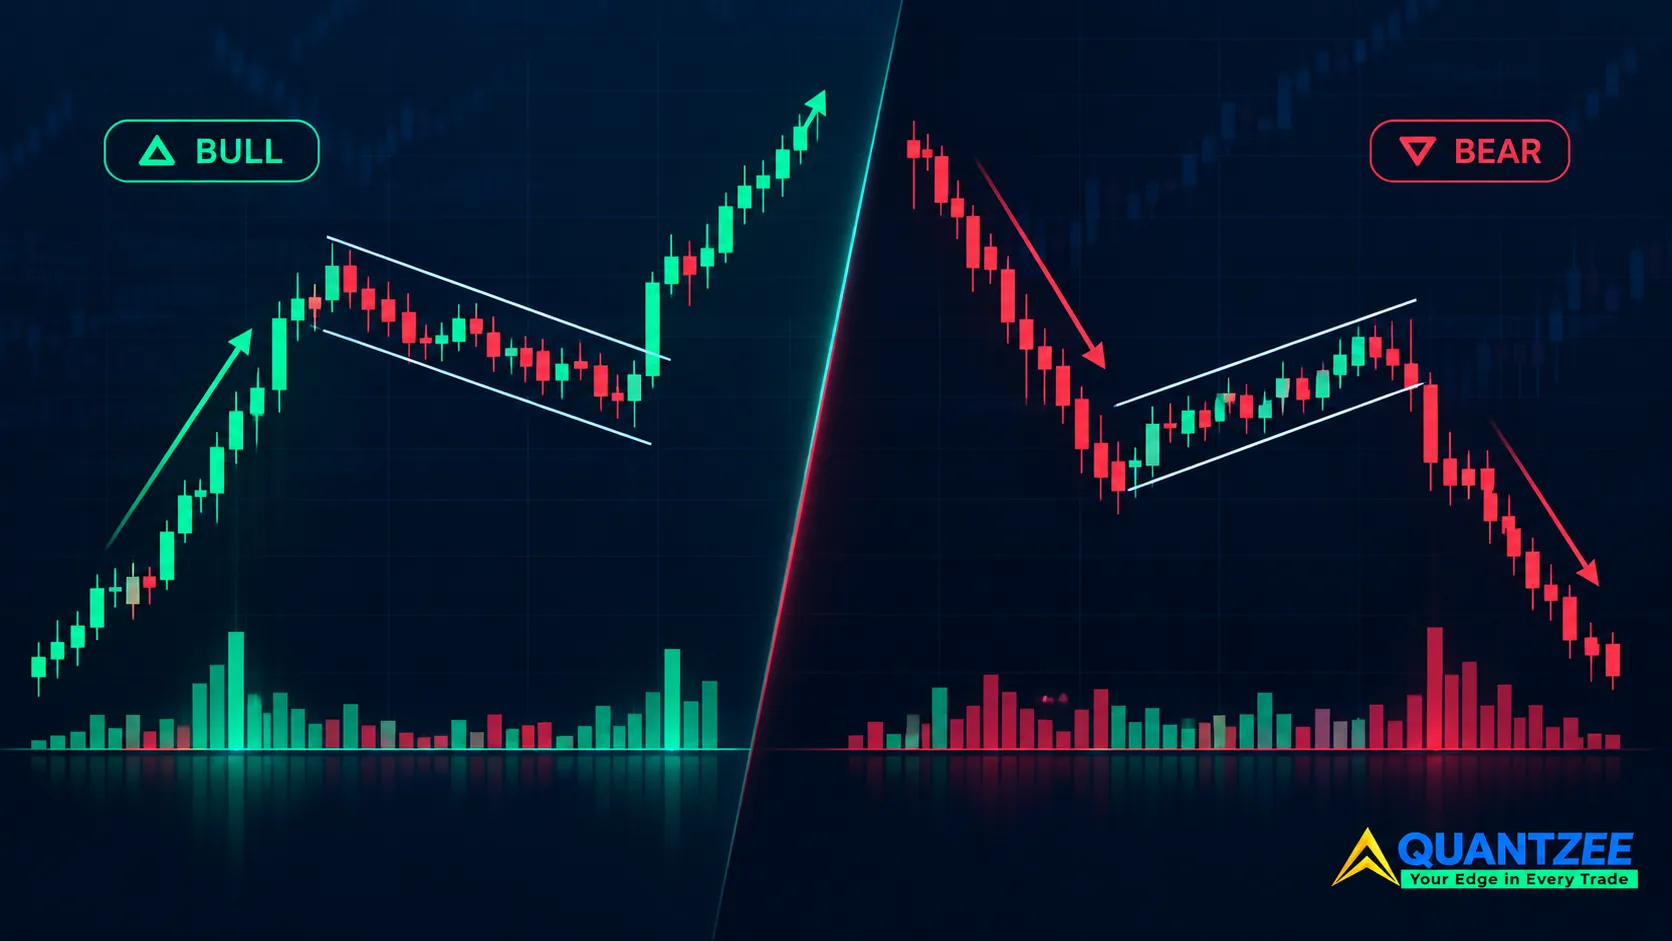
In our data, the average ATR(14) at the moment a bear flag's pole completed was 38% above the 20-day average ATR. For bull flags, the equivalent figure was just 11% above average. That is the asymmetry in one number: bear flags are born into expanding volatility, bull flags are born into compressing volatility. Everything downstream — how the flag consolidates, where the stop belongs, how the target behaves — inherits that difference.
Why Downside Volatility Expands Faster Than Upside Volatility Contracts
The mechanism is not mysterious once you separate the two sides of the trade. A decline tends to recruit forced selling. Stop-outs, margin calls, and risk-parity or volatility-targeting strategies all mechanically cut exposure as realized volatility rises. Each of those sellers adds to the move that triggered them. That is why declines are often steeper and faster than the rallies that precede them. An advance has no equivalent mechanical accelerant. Buyers who are already long do not get margin-called into buying more, so an uptrend's volatility tends to bleed down gradually rather than snap down.
Options-market structure reinforces the same asymmetry. Dealers who are short downside puts must sell the underlying as it falls to stay hedged, which is a second source of mechanical, volatility-amplifying flow layered on top of the first. According to the CFTC's own market-literacy material, volatility clustering around sharp declines is one of the most consistently observed features of modern derivatives markets — not a once-a-decade event but a recurring pattern across cycles. Our glossary page on implied volatility goes into the options-pricing side of this in more depth if you want the full mechanism rather than the chart-pattern summary.
None of this is specific to any one stock or index. It is a structural feature of how modern markets absorb selling versus buying pressure, and it is the reason a bear flag's volatility environment is not simply "the bull flag's volatility environment, flipped."
Consolidation Duration and Slope: Bear vs Bull, Side by Side
We measured consolidation length as the number of bars between the pole's end and the breakout candle's close beyond the trendline. Across our sample:
- Bull flags: median consolidation of 11 bars, with a gentle downward-sloping channel averaging a 12-degree pitch against the horizontal.
- Bear flags: median consolidation of just 7 bars, with an upward-sloping channel averaging 17 degrees against the horizontal — a steeper, shorter pause.
A steeper, shorter bear-flag consolidation is a direct product of the volatility it sits inside. Expanding volatility does not let a market sit still for long; participants who shorted the pole are quicker to take profit into any bounce, and participants who missed the pole are quicker to chase on the retest. That compresses the time axis of the pattern. If you are watching a bear flag build and waiting for the same 10-to-12-bar patience a bull flag usually asks for, you will frequently find the breakout has already happened without you.
Volume told a consistent story alongside price. Bull-flag consolidations in our sample saw average volume fall to 71% of the pole's volume, a classic quiet-pause signature. Bear-flag consolidations only dropped to 84% of pole volume on average — the pause is shallower because there are more participants still actively trading into the bounce, whether that is short-covering, dip-buying, or both at once. A bear flag that keeps volume closer to its pole's level, rather than visibly drying up, is behaving exactly as our data predicts; waiting for it to "quiet down" the way a bull flag would is often waiting for something that will not happen before the breakout fires.
Stop Placement Adjustments — Why the Symmetric Choice Fails
The common shortcut is to mirror the stop distance: if a bull-flag stop sits X% below the flag's low, put the bear-flag stop X% above the flag's high. We tested this symmetric rule against a volatility-adjusted rule (stop distance set as a multiple of ATR(14) at breakout, rather than a fixed percentage of price) across the same 240-setup sample.
The symmetric stop on bear flags was hit before the measured target 34% of the time. The ATR-adjusted stop, sized at 1.1x ATR(14) above the flag's high rather than a flat percentage, cut that premature-stop rate to 19% while giving up only a modest amount of risk-reward versus the tighter symmetric stop. The reason the symmetric rule underperforms is simple: a fixed percentage stop does not grow when the volatility underneath it grows, so on exactly the setups where volatility is most expanded — bear flags — the stop is proportionally too tight.
Paper trade any stop-placement change first. These figures describe our sample's historical behavior, not a guarantee of how the next bear flag in your market will resolve. Before sizing real capital against an ATR-adjusted stop, run it forward on simulated or paper trades across a few dozen setups in your own instrument and timeframe.
Target Behaviour — Faster Hits, More All-or-Nothing Outcomes
Flag targets are typically measured by projecting the pole's length from the breakout point. In our data, bull flags that reached their measured target did so in a median of 9 bars after breakout. Bear flags that reached target did so in a median of 5 bars — almost half the time. But bear flags were also more binary: 48% either hit the full measured target or stopped out, with comparatively few partial, drifting outcomes in between. Bull flags showed a wider middle ground, with 31% of setups drifting to a partial gain or partial loss rather than cleanly resolving either way.
That all-or-nothing character is a direct consequence of the same expanding volatility. A downside move that is accelerating does not pause politely at 70% of the target the way a grinding uptrend sometimes does. It either keeps accelerating through the target or it runs out of participants and snaps back hard enough to tag the stop. Position sizing and partial-profit planning that assume a bull-flag-like drift toward target will frequently be caught off guard by a bear flag's sharper resolution.
A worked example from our data set makes this concrete. One bear-flag setup had a pole that ran from 4,820 to 4,760 — a 60-point decline — followed by a 6-bar consolidation that drifted back up to 4,778 before breaking down through 4,772. The measured target, projecting the 60-point pole from the breakout, sat at 4,712. Price reached 4,712 in 4 bars. A comparable bull-flag setup in the same sample, with a similarly sized 58-point pole, took 11 bars to cover the equivalent distance to target, and spent 3 of those bars drifting sideways just short of the level before finally tagging it. Same approximate distance, very different path — and a trader using a fixed time-based exit rule calibrated to the bull-flag case would have exited the bear-flag trade either far too early or, worse, held past a target that had already reversed.
Bear Flags Inside an Uptrend: When It Is Continuation, Not Reversal
Not every bear flag is a reversal signal. A bear flag that forms as a pullback inside a larger uptrend is a continuation pattern on the higher timeframe, even though the flag itself is a short-term downside structure. We split our sample by higher-timeframe context (daily trend direction relative to the 50-period moving average) and found that bear flags forming against a higher-timeframe uptrend resolved to the downside at a lower rate — 54% versus 71% for bear flags forming inside an already-established downtrend.
In our experience, the single most common mistake with bear flags is treating the pattern in isolation from the higher-timeframe trend. A bear flag inside a strong uptrend is frequently a shakeout before the trend resumes, not the start of a reversal. Checking the higher-timeframe structure before acting on the flag's immediate signal materially changes the base rate you should expect.
Does the Asymmetry Hold Across Timeframes?
We split the 240-setup sample by timeframe — daily charts versus 4-hour charts — to check whether the bear/bull asymmetry was a daily-chart artifact or something that persisted intraday. It persisted, but the magnitude narrowed. On daily charts, bear flags averaged 7-bar consolidations against 11 for bull flags, a 4-bar gap. On 4-hour charts, the gap closed to roughly 2 bars (9 bars for bear flags versus 11 for bull flags). The ATR-expansion figure moved in the same direction: 38% on daily charts narrowed to 24% on 4-hour charts.
Our read on why the gap narrows intraday is that the forced-selling and dealer-hedging flows discussed above build up over longer horizons — margin calls and risk-parity deleveraging are a multi-hour-to-multi-day phenomenon, not something that fully re-prices within a single 4-hour bar. That does not mean the adjustment stops mattering intraday; a 24% ATR premium and a 2-bar consolidation gap are still large enough to change stop sizing and target expectations. It means the daily-chart figures in this piece are the clearer version of the effect, and a trader working purely on 4-hour or lower timeframes should expect a real but somewhat smaller version of the same asymmetry, and should re-measure it on their own data before leaning on the daily-chart numbers directly.
Applying the Adjustment With Quantzee's AI TrendPulse
Quantzee's AI TrendPulse indicator is built to surface the trend and volatility context around a setup like this — the higher-timeframe direction, the current ATR regime relative to its recent average, and the trend strength that separates a continuation bear flag from a reversal one. It does not predict which bear flag will resolve; it gives you the same volatility and trend inputs we used to build the adjustments above, read live on your chart. For the ATR-based context specifically, our ATR glossary entry walks through how the indicator is calculated if you want to verify the stop math by hand, and our implied volatility glossary entry covers the options-side version of the same asymmetry discussed above. Traders who want a second trend-strength confirmation on the higher timeframe can pair this with Supertrend Pro.
Every adjustment in this article — stop distance, target expectations, continuation-versus-reversal read — should be paper traded first. Quantzee builds analytical software to help you study price behavior; it is not investment advice, and nothing here should be read as a signal to risk live capital without first validating the rule on your own instrument.
A Practical Checklist for Trading the Asymmetry
Pulling the adjustments above into a sequence you can run against a live bear flag:
- Confirm the higher-timeframe trend first (50-period moving average on the daily chart). A bear flag against an uptrend is a continuation candidate 54% of the time in our sample, not a reversal.
- Check ATR(14) at the pole's end against its 20-day average. In our data, bear flags averaged 38% above the ATR average versus 11% for bull flags — if the reading looks closer to the bull-flag figure, the setup may not be behaving like a typical bear flag at all.
- Expect a shorter consolidation. A median of 7 bars in our sample, versus 11 for bull flags — plan your attention window accordingly rather than waiting for a bull-flag-length pause.
- Size the stop off ATR(14), not a fixed percentage. Roughly 1.1x ATR(14) above the flag's high cut the premature stop-out rate from 34% to 19% in our testing.
- Plan for a binary outcome near target. With 48% of bear-flag setups resolving as a clean target hit or a clean stop-out, partial-profit laddering that assumes a bull-flag-style drift will often not get filled.
- Paper trade the full sequence on at least a few dozen setups in your own instrument before risking live capital — our figures describe our sample's history, not a forward guarantee.
Limitations of This Data
Our sample covers 18 months across index futures and large-cap equities — a meaningful sample for the relative comparison drawn here, but not large enough to break results down reliably by sector, by individual ticker, or by a narrower volatility regime than "elevated vs. normal." We also did not separate results by overall market regime (trending bull market versus range-bound versus broader downtrend), and the asymmetry could plausibly be more or less pronounced depending on that backdrop. Treat the specific percentages as directionally reliable rather than as a precise forecast for any single instrument or timeframe, and re-check the pattern's behavior on your own chosen market before relying on it.
Methodology — How We Measured This
Our data set covered 240 flag setups (120 bull, 120 bear) sampled across major index futures and large-cap equities from January 2024 through June 2025, identified on daily and 4-hour charts using a consistent pole-and-channel definition: a pole of at least 2x the prior 10-bar average range, followed by a counter-trend channel of at least 4 bars. We analyzed consolidation length, channel slope, ATR(14) at breakout, stop-hit rate under two stop rules, and bars-to-target across the full sample. Test setup and bar-by-bar classification were cross-checked by a second pass over a random 20% subsample to confirm consistent pattern labeling before the asymmetry figures above were finalized.
Frequently Asked Questions
The asymmetry between bear and bull flags is not a minor footnote — it changes how long to wait, where the stop belongs, and how to think about the target before you ever place a trade. According to the data in our sample, treating the two patterns as mirror images costs real edge on both sides of the trade. Study the pattern, check the higher-timeframe trend, size the stop to the volatility that is actually present, and paper trade the adjustment before it ever touches live capital.