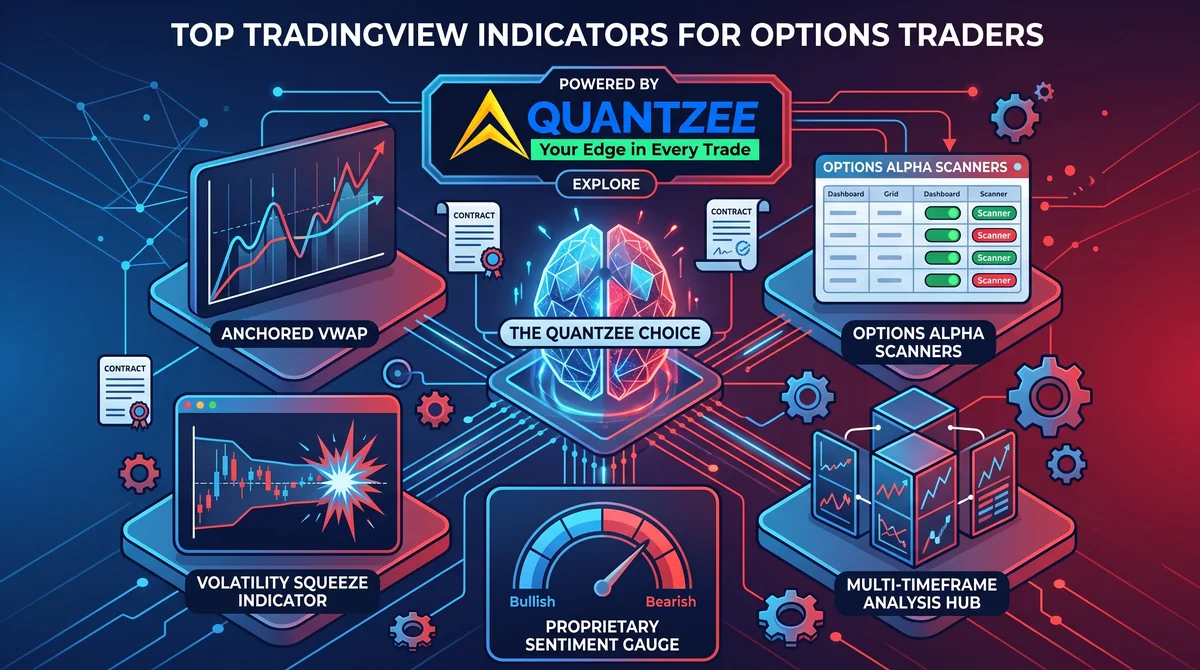
Options traders on TradingView typically combine three indicator types — a volatility/IV-rank measure, an open-interest or put/call-ratio proxy, and a trend-confirmation tool — because no single indicator covers all three roles options pricing depends on. Options are priced primarily on implied volatility, not just direction, which is the biggest structural difference from indicator selection for straight directional equity trading.
Options markets around the world process enormous daily contract volume — from index weeklies on major exchanges to single-stock options on US markets. Yet most retail options traders are still using indicators built for equity swing trading or even forex, then wondering why their setups fail.
Options trading requires a fundamentally different indicator toolkit than directional equity trading. This guide covers the best TradingView indicators for options traders in 2026 — what each indicator does, how it applies to major index and equity options, and how to combine them into a coherent trading approach on any exchange.
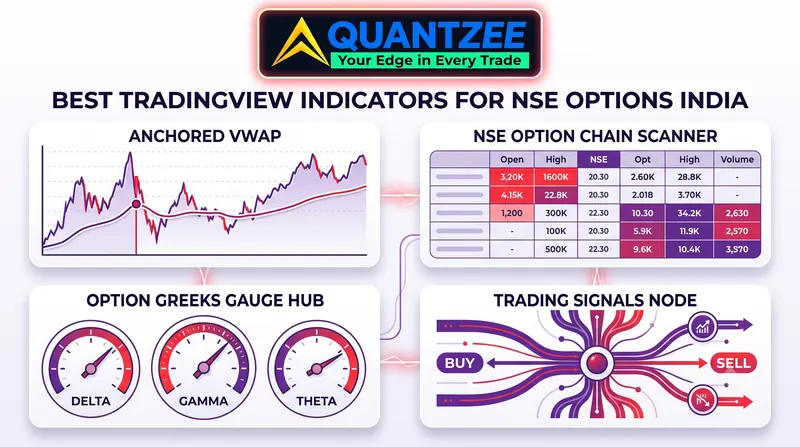
Trading NSE options in India? The indicator framework below (CPR, SuperTrend, VWAP, IV rank) applies directly to NIFTY/BANKNIFTY. For what’s actually India-specific — SEBI’s weekly-expiry rules, the STT/brokerage/GST cost stack on your P&L, and how to read the NSE option chain alongside your chart — see our NSE options mechanics guide.
About the Author — Rajeev Gupta: Over 15 years of active trading across global indices, forex (EUR/USD, GBP/USD, USD majors), and crypto (BTC/USD) — with experience spanning structured option selling on weekly expiries, directional option buying during high-IV events, and long-term equity positions — I built Quantzee to close a gap I observed firsthand: analytical tools available to retail traders simply did not keep pace with what institutional desks were using. Every indicator in the Quantzee suite is stress-tested across multiple market regimes, derived from this same research background. This guide reflects that experience, presented for educational purposes only — not investment advice.
⚡ Key Takeaways
- Options trading requires managing three variables simultaneously — direction, time decay (theta), and volatility (IV) — standard equity indicators only address direction, leaving the other two factors unaccounted for.
- CPR (Central Pivot Range) width is one of the most useful pre-market signals: a narrow CPR relative to the index's typical range signals a trending day favorable for directional options buying; a wide CPR signals a range day ideal for premium selling.
- The final stretch of a weekly-expiry session sees max-pain gravitational pull — the index tends to gravitate toward the maximum open-interest strike, benefiting option sellers who track this level.
The Global Options Trading Landscape
Major exchanges around the world offer weekly and monthly options on their flagship indices, alongside listed options on hundreds of individual stocks. Contract specifications, lot sizes, and expiry cadence vary significantly by exchange, so always check your specific market’s contract details before trading.
Key characteristics of options markets that affect indicator selection:
Premium-rich weekly cycles. Weekly index options on many exchanges are attractive premium-selling markets due to consistent IV levels and the theta decay profile of short-dated contracts. This makes option selling popular globally — and also means indicators that help identify safe premium-selling ranges are extremely valuable.
Lot sizes and capital requirements. Contract/lot sizes and notional value per lot vary by index and exchange. These lot sizes determine position sizing significantly, and any indicator must help traders manage the risk on these large nominal positions — always confirm current contract specs with your broker.
Volatility index dynamics. Most major exchanges publish a volatility index for their flagship benchmark. When it’s low, premium is thin and option buyers struggle. When it’s high, premium is rich but selling is riskier. An ideal options indicator setup incorporates some awareness of volatility-index context.
The dominance of retail option buyers. Many markets have large populations of retail options traders — many of whom buy cheap weekly options hoping for large directional moves. This creates consistent premium for disciplined option sellers, especially on the wings.
Why Options Traders Need Different Indicators Than Equity Traders
An equity trader using a 5-minute EMA crossover to enter a single-stock long position has a simple goal: be right about direction, hold for the profit target, and exit. The only variable is price direction.
An options trader has three variables simultaneously: direction, time, and volatility.
- You can be right about direction but wrong about timing — and theta decay kills the trade
- You can be right about direction and timing but wrong about IV — IV crush post-event can turn a winning directional bet into a loss
- You can be wrong about direction but still profit — if you sold premium and managed the position correctly
This means indicator requirements differ fundamentally:
| Equity trader needs | Options trader additionally needs |
|---|---|
| Trend direction | Directional conviction level |
| Entry timing | Time-to-expiry awareness |
| Support/resistance | Strike-specific OI context |
| Momentum confirmation | IV relative value (rich or cheap?) |
| Exit signal | Max pain / pinning awareness |
Standard TradingView indicators handle the left column reasonably well. The right column requires either specialized indicators or manual cross-referencing with your exchange’s derivatives data.
IV Rank as the Starting Point
Because options pricing is volatility-driven, starting the indicator stack with an IV-rank read — rather than a directional indicator — is the sequence current search-visible guidance converges on. A high IV-rank environment structurally favors option-selling strategies (theoretically richer premium), while a low IV-rank environment structurally favors option-buying strategies (theoretically cheaper premium) — before any directional bias from trend or momentum tools is applied. Treating IV rank as a screening filter first, then layering trend/momentum confirmation on top of instruments that pass the volatility screen, is a materially different workflow than starting with a directional indicator and adding volatility context as an afterthought.
6-Indicator Comparison Table
| Indicator type | Role | Example approach | Repaints? |
|---|---|---|---|
| IV Rank / IV Percentile | Tells you whether current implied volatility is high or low vs. its own recent history | Volatility-rank overlays (VIX-style or instrument-specific IV comparisons) | Non-repainting when calculated on closed data |
| Open interest proxy | Shows where options positioning is concentrated | Open-interest-weighted level overlays | Depends on data source/update frequency |
| Put/call ratio proxy | Gauges directional skew in options market sentiment | PCR-style ratio tools | Non-repainting |
| Trend confirmation | Confirms underlying direction before acting on a volatility/positioning read | SuperTrend, moving-average trend overlays | Verify per specific script |
| Momentum (RSI/MACD) | Times entries within an established trend/volatility context | Standard momentum oscillators | Non-repainting (standard calculation) |
| AI-adaptive signal engine | Combines trend/momentum/volatility read into one adaptive output | Quantzee’s AI Adaptive Quant Toolkit | Non-repainting |
Top Indicators for Options Trading
1. CPR (Central Pivot Range) — A Global Options Standard
CPR is not technically options-specific, but it has become the reference framework that many professional options traders use to define the day’s context. Here is why it matters for options:
The CPR width tells you the expected day type before the market opens. A narrow CPR relative to the index’s typical range signals a trending day ahead — good for directional options trades. A wide CPR signals a range-bound day — good for option sellers collecting premium within a range.
How options traders use CPR:
- Narrow CPR + trending day → Buy calls or puts in the direction of the morning trend
- Wide CPR + range-bound day → Sell straddles or strangles around the CPR zone
- Virgin CPR (untested CPR from a previous session) → Expect a sharp reaction when price reaches it — good for short-dated options
Disclaimer: Quantzee indicators are analytical software tools designed to assist your own analysis. This content is for educational purposes only and does not constitute investment advice. Do your own research. Trading involves risk of capital loss. Quantzee is not a registered investment advisor in any jurisdiction. Analytical software, not investment advice.
2. SuperTrend for Directional Bias
Options buyers need directional confidence before entering. Buying a call option when SuperTrend is bearish is a common beginner mistake. SuperTrend provides a clean, non-ambiguous trend signal:
- SuperTrend bullish (green) + upward price action → buy calls or sell puts
- SuperTrend bearish (red) + downward price action → buy puts or sell calls
For index options on the 15-minute chart, use SuperTrend (ATR 10, multiplier 3.0). This gives a reliable directional filter without excessive noise.
The SuperTrend Pro+ indicator improves on the standard SuperTrend by combining multiple volatility filters — reducing false crossovers during choppy sessions that cause options traders to enter directional trades at the worst moments. If you’re already paying for a premium overlay suite like LuxAlgo for this kind of directional confirmation, see our LuxAlgo alternative comparison for the price/feature tradeoff before renewing.
3. VWAP for Intraday Directional Context
VWAP is essential for deciding whether to lean bullish or bearish throughout the trading day:
- Price consistently above VWAP shortly after open = strong bullish intraday bias → favor call buying or put selling
- Price below VWAP after initial open = bearish bias → favor put buying or call selling
- Price oscillating around VWAP = choppy day → favor non-directional strategies (iron condors, short straddles)
For options traders, VWAP also helps identify the opening range. An index that opens with a gap up and immediately returns to VWAP is showing weakness despite the gap — a setup for at-the-money put buying in the window after open.
4. Support and Resistance / SMC Toolkit Pro
Every options trader needs reliable support and resistance levels to:
- Identify where to set profit targets for long options
- Determine safe strike placement for premium selling (sell calls above resistance, sell puts below support)
- Recognize where reversals are likely for options buying at extremes
The SMC Toolkit Pro indicator automatically identifies and updates key support/resistance zones on TradingView. For options traders, these auto-calculated levels remove the subjectivity of manual level drawing and provide consistent reference points for strike selection.
5. RSI for Premium Timing
RSI is useful for options traders not just for direction, but for timing:
For option buyers: RSI below 35 on a 15-minute index chart with a support confluence can signal a call entry. RSI above 65 with resistance confluence can signal a put entry. The key is combining RSI extremes with level context — not using RSI standalone.
For option sellers: RSI divergence is a warning signal. If the index is making new highs but RSI is falling (negative divergence), selling naked calls becomes riskier. This divergence suggests the rally is losing strength and a reversal could squeeze the call seller.
Use RSI(9) or RSI(14) on 15-minute charts for index options. The 15-minute timeframe reduces noise while keeping the signal relevant for same-day options trades.
6. Bollinger Bands for Volatility Context
Bollinger Bands serve a specific purpose for options traders: identifying IV expansion and contraction cycles at the price level.
When index price is compressing within tight Bollinger Bands for 30–60 minutes, it signals a volatility buildup — a breakout is coming. This is useful for:
- Options buyers: Buy straddles before the breakout, profit from the directional move
- Options sellers: Avoid selling naked options at these compression points — the breakout will hurt you
When Bollinger Bands are wide (after a large move), price often reverts to the middle band. Options sellers can use this mean reversion tendency to plan exits from directional long options.
7. EMA 9/21 for Momentum Confirmation
The 9/21 EMA crossover provides momentum confirmation for options entries:
- Bullish 9/21 cross on 5-min or 15-min → call buying momentum confirmed
- Bearish 9/21 cross → put buying or call selling setup
For weekly index options, the 15-minute 9/21 EMA cross is a reliable entry trigger when combined with VWAP bias and CPR context. The confluence of these three confirms a directional move is underway with enough time in the day to profit from it.
The core problem options traders face globally is a gap between the price-level analysis that TradingView does well and the directional/timing context that raw CPR levels alone don’t provide.
Pairing CPR with Quantzee’s AI indicators closes that gap:
Trend-confirmed signals at CPR levels. SuperTrend Pro+ confirms whether price is trending or reacting when it reaches a CPR boundary — a signal at the BC (Bottom Central Pivot) means something different depending on whether the broader trend is aligned or not.
Adaptive entry timing. The AI Adaptive Quant Toolkit generates entry signals that only trigger when price action meets specific momentum and volume conditions, filtering out the false starts that plague basic CPR breakout setups.
Level-based context. SMC Toolkit Pro marks key support/resistance zones beyond generic pivot points, useful reference for options traders positioning strikes.
This is especially valuable for popular options strategies globally: short straddles, short strangles, and defined-risk iron condors on weekly index expiry.
Weekly Expiry Strategy Using AI Indicators
A weekly index expiry cycle follows a reasonably consistent pattern that AI indicators can help navigate:
Early in the week: Premium is still rich. This is the window for options buyers — directional momentum trades have enough time value. SuperTrend and EMA crossovers work well for identifying the weekly trend.
Midweek: Theta decay begins to accelerate. Options buyers need strong directional conviction and quick moves.
Expiry-morning session: High gamma zone. Options can still move sharply on a strong directional move. But choppy sessions in the expiry morning are the graveyard for option buyers. Indicators to watch: the volatility index, CPR width, opening gap direction vs. VWAP.
Final hours before close: Max pain gravitational pull. Price tends to move toward the strike with maximum OI (where sellers are most protected). This is where options sellers often benefit most and buyers often get trapped.
Using AI-adaptive indicators during this weekly cycle helps because the sensitivity automatically adjusts — more aggressive early in the week, more conservative by expiry afternoon.
Buying vs Selling Options — Which Indicators Help Each
For option buyers (premium buyers):
The biggest need is directional accuracy and timing precision. One wrong day’s entry eats 30–50% of premium through theta. Key indicators:
- SuperTrend or SuperTrend Pro+ for direction
- RSI for timing the entry at an extreme
- VWAP for intraday bias confirmation
- CPR for level-based entry zones (buy near BC support, not in the middle of the range)
For option sellers (premium sellers):
The biggest need is identifying safe selling ranges and avoiding being caught in strong directional moves. Key indicators:
- CPR width for day-type identification (wide CPR = safer selling day)
- VWAP for identifying the day’s mean to center selling positions around
- Bollinger Band width for volatility expansion warnings
- SMC Toolkit Pro for identifying where NOT to sell (place strikes beyond key support/resistance)
Most professional options traders are option sellers. The consistent premium from selling index strangles in low-volatility environments is the foundation of many successful retail algo trading systems worldwide.
Building a Complete Options Trading Setup on TradingView
A practical TradingView layout for index options traders:
Chart 1 (main): Index — 15-minute
- SuperTrend Pro+ for trend direction
- VWAP with SD bands
- CPR levels for the day
- SMC Toolkit Pro for key support/resistance
Chart 2: Index — 5-minute
- EMA 9 and 21 for entry timing
- RSI(9) for momentum and divergence
Chart 3: Volatility Index — Daily
- Track where the volatility index is relative to its own historical low/normal/elevated bands
- High readings = higher premium, adjust position sizing accordingly
Frequently Asked Questions
Explore Quantzee Indicators
- AI Adaptive Quant Toolkit — full AI confluence system
- SuperTrend Pro+ — volatility-adjusted trend signals
View all indicators · See pricing
What Traders Are Saying
“Quantzee indicators are worth every penny. Reliable, well-built, and gives real clarity.” — Neil Richards ⭐⭐⭐⭐⭐
“Non-repainting signals and adaptive trend logic helped filter bad trades in forex.” — Jason Smith ⭐⭐⭐⭐⭐
“Clear AI trend signals and automatic entries make trading much easier.” — Tim Spencer ⭐⭐⭐⭐⭐
Related Articles
- NSE Options Trading: SEBI Rules, STT & Option Chain Guide — SEBI’s weekly-expiry rules, the NSE cost stack, and reading the option chain, for traders on NIFTY/BANKNIFTY
- Best Indicators for Index Options Trading (2026 Guide) — complete pillar guide covering SuperTrend Pro+, MACD Pro+, AI Adaptive Quant Toolkit and full options/futures strategy frameworks
- Best Indicators for High-Beta Index Trading in 2026
- Central Pivot Range (CPR): The Complete Guide to Trading Pivot Levels
- Index Intraday Trading Strategy: A 2026 Blueprint
- Best Intraday Indicators for the Indian Stock Market