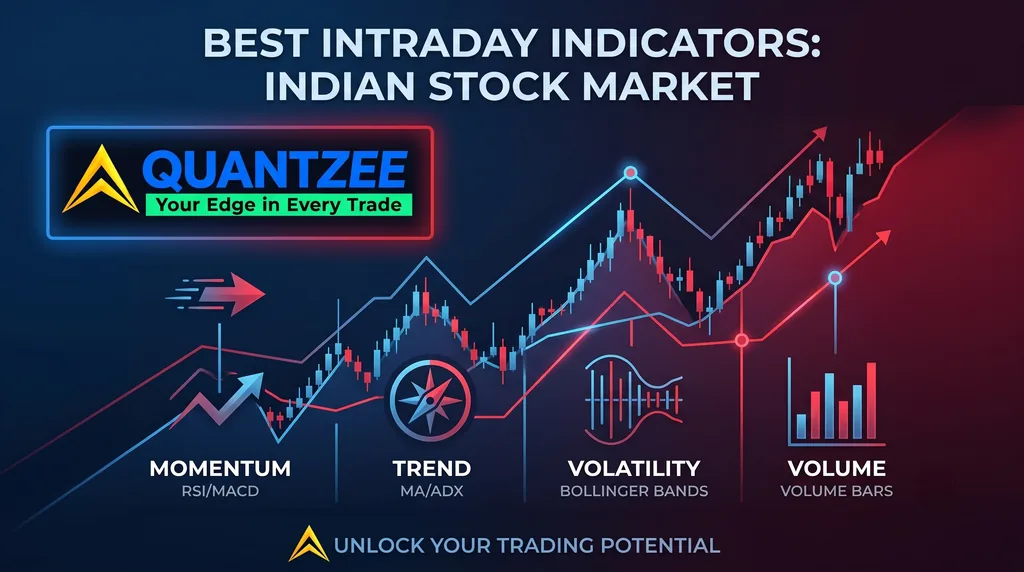
Intraday trading on NSE/BSE stocks, Nifty 50, and Bank Nifty benefits most from indicators tuned for Indian market session timing (9:15 AM-3:30 PM IST) and the liquidity profile of the specific instrument — a volatility-adaptive trend tool, a volume-confirmation indicator, and a session-anchored VWAP cover the three roles intraday Indian-market trading typically needs. Indian market hours are shorter and more compressed than 24-hour markets like crypto or forex, which changes how session-anchored tools like VWAP should be configured — the anchor point matters more when the session itself is only 6.25 hours long.
Intraday trading has a rhythm that is entirely its own, and that rhythm differs by exchange. Every major session opens with a burst of volatility that can shake out inexperienced traders in the first 15–30 minutes. It closes with institutional rebalancing flows that can reverse the day’s trend in the final minutes. In between, you have gap events, central-bank news, fund-flow data, global cues, and the relentless tick of derivatives-expiry theta eating at every option position.
If you are using indicators designed for a single market’s hours, or generic daily chart analysis, you are missing context that matters. This guide covers the best intraday indicators for the Indian stock and index markets in 2026 — what they are, how to configure them for NSE and BSE sessions, and how to build them into a coherent intraday trading system.
About the Author — Rajeev Gupta: Over 15 years of active trading across global indices, forex (EUR/USD, GBP/USD, USD majors), and crypto (BTC/USD) — with experience spanning structured option selling on weekly expiries, directional option buying during high-IV events, and long-term equity positions — I built Quantzee to close a gap I observed firsthand: analytical tools available to retail traders simply did not keep pace with what institutional desks were using. Every indicator in the Quantzee suite is stress-tested across multiple market regimes, derived from this same research background. This guide reflects that experience, presented for educational purposes only — not investment advice.
⚡ Key Takeaways
- VWAP (Volume Weighted Average Price) is the single most important intraday level on NSE and BSE — institutional desks execute relative to VWAP, making the first VWAP retest after a gap open one of the highest-probability setups of the day.
- CPR (Central Pivot Range) width is the key pre-market day-type signal: narrow CPR signals a trending day for directional trades; wide CPR signals a range day where mean-reversion and premium-selling strategies outperform.
- The opening window of any session has wide spreads and frequent false breakouts — most experienced intraday traders wait until the first 15–30 minutes settle before entering any position.
- On derivatives-expiry sessions, standard trend indicators (SuperTrend, EMA crossovers) are less reliable near the close — gamma and delta-hedging mechanics drive sharp moves that are not driven by technical price action.
The Indian Intraday Trading Landscape
Before going into indicators, a few important facts about the intraday environment that apply broadly across exchanges:
Index derivatives dominate volume. On most major exchanges, index futures and options are the primary instruments for intraday index trading. Most serious intraday traders focus here rather than on individual stocks, because liquidity and spreads are typically better.
Cash equity markets carry the delivery flow. Alongside derivatives, the underlying cash market handles delivery volume in individual names. For intraday cash-market trading on mid-caps and small-caps, the most actively traded listed names are typically the best fit.
Session hours and structure vary by exchange. Every exchange has its own opening bell, pre-market window, and closing session — check your exchange’s published hours before applying any of the timing rules below, and adapt the specific clock times to your own market.
Margin and leverage rules are regulator- and broker-specific. Intraday leverage on equities and derivatives margin requirements differ by jurisdiction and broker. Confirm your own broker’s margin policy before sizing a position.
Peak volumes at open and close. Volume spikes sharply in the opening 15–30 minutes (institutional opening orders) and the closing 15–30 minutes (closing institutional flows). The middle of the session typically has lower volume and smoother price action.
Why Intraday Behavior Differs by Market
Understanding these general market-structure characteristics helps you choose and configure indicators correctly on whichever exchange you trade:
The Opening Volatility Zone
Every market reacts to overnight global cues — related futures markets closing, other regions opening, and after-hours trade in correlated instruments running through the night. By the time your local session opens, a significant gap up or down from the previous close is common.
This opening volatility zone creates several challenges:
- Wide bid-ask spreads in the first 5–10 minutes
- Large block orders executing at market open create artificial price moves
- Options premiums are inflated immediately after open due to volatility demand
- Many breakout signals in the first 15 minutes are false — the “fakeout” after gap opens is one of the most common retail trader losses
Recommendation: Most experienced intraday traders avoid entering positions in the opening 15–30 minutes of any session. Wait for the opening volatility to settle, observe VWAP establishment, and then look for your first setup.
Disclaimer: Quantzee indicators are analytical software tools designed to assist your own analysis. This content is for educational purposes only and does not constitute investment advice. Do your own research. Trading involves risk of capital loss. Quantzee is not a registered investment advisor in any jurisdiction. Analytical software, not investment advice.
The Closing Institutional Zone
The last 15–30 minutes of most exchanges’ trading sessions see fund NAV-based rebalancing, closing institutional flows, and index futures settlement pressure. This can create sharp moves — either with or against the day’s trend — that have nothing to do with technical signals.
Intraday traders should be cautious about entering new positions late in the session and should have their existing positions managed with trailing stops to capture any late-day trend continuation or protect against sudden reversal.
Derivatives Expiry Days
Weekly and monthly options/futures expiry creates dramatically different price behavior on the underlying index. High gamma, collapsing theta, and max-pain gravitational pulls combine to create sharp, unpredictable moves. Standard trend-following indicators are less reliable on expiry days.
Top 8 Intraday Indicators for the Indian Stock Market
1. EMA Crossover (9 and 21 EMA)
The 9-period and 21-period Exponential Moving Average crossover is one of the most widely used intraday indicators across markets. Its popularity is itself a reason it works — large numbers of market participants acting on the same signal creates self-fulfilling momentum.
Configuration for intraday trading:
- Use 9 EMA and 21 EMA on 5-minute or 15-minute charts
- Add a 50 EMA as the trend anchor on 15-minute charts
- Only take bullish EMA crossovers when price is above the 50 EMA
- Only take bearish EMA crossovers when price is below the 50 EMA
Why it works: EMA crossovers capture momentum shifts. When the fast EMA (9) crosses above the slow EMA (21), it signals that recent prices are accelerating higher relative to the medium-term average — a momentum confirmation rather than a lagging signal.
Weakness: In choppy, range-bound markets (wide CPR days), EMA crossovers whipsaw repeatedly. Use CPR width as a pre-filter — avoid EMA crossover trades on wide CPR days.
2. VWAP (Volume Weighted Average Price)
VWAP is the anchor of institutional intraday trading on nearly every exchange. Funds and large proprietary desks execute relative to VWAP — which means price regularly tests, bounces from, and gravitates toward VWAP throughout the session.
Configuration for intraday trading:
- VWAP resets daily (starts fresh at the market open each day)
- Add 1 SD and 2 SD bands for range context
- VWAP carries extra significance on derivatives-expiry days as the reference point for institutional unwinding
How to use VWAP for intraday:
- Establish intraday bias: above VWAP = bullish, below VWAP = bearish
- First VWAP retest after a gap open is often the best risk/reward trade of the day
- Price reaching 2 SD band above VWAP after a rally = likely overextended, reversal risk
- Price at 2 SD below VWAP after a sell-off = likely oversold for intraday bounce
Best for: Major indices, index futures, and large-cap stocks with high daily volumes.
Expiry-day VWAP insight: On the NSE, VWAP carries extra significance on weekly and monthly derivatives-expiry days. Market makers and institutions actively manage their delta exposures relative to VWAP as expiry approaches. This creates a “VWAP magnet” effect in the final hours of trading — the index tends to gravitate toward VWAP as market-maker positions unwind near settlement. Options traders who are short straddles or short strangles benefit from tracking VWAP alignment throughout expiry day, as settlement near VWAP often maximizes option seller profit.
The VWAP Gap-Fade setup: When an index opens with a significant gap and immediately fails to build on that gap in the first two 5-minute candles, the “VWAP gap-fade” setup occurs. Price returns toward VWAP with high probability in the window following the open. This is one of the most consistent short-term patterns on major exchanges — the opening institutional orders that created the gap have executed, and the directional supply/demand shifts toward fair value (VWAP). Traders who recognize this pattern use a limit order near the VWAP level for their entry, with a stop above/below the gap open price.
3. SuperTrend
SuperTrend is one of the most reliable trend-following indicators for intraday trading. It uses ATR (Average True Range) to create an adaptive stop-and-reverse signal that changes direction only when volatility-adjusted price movement confirms a trend change.
Configuration for intraday trading:
- 5-minute major index: ATR 7, Multiplier 2.0–2.5
- 15-minute major index: ATR 10, Multiplier 3.0
- 5-minute mid-cap stocks: ATR 10, Multiplier 3.0 (stocks are more volatile per ATR unit)
How to use SuperTrend:
- Green SuperTrend (price above the line) = bullish — only take long setups
- Red SuperTrend (price below the line) = bearish — only take short setups
- SuperTrend flip (green to red or vice versa) = primary trade entry signal
- Use SuperTrend as a trailing stop — exit longs if price closes below the SuperTrend line
The SuperTrend Pro+ indicator enhances this by combining multiple volatility layers to filter false signals during the choppy midsession period when the standard SuperTrend whipsaws repeatedly.
4. CPR (Central Pivot Range)
CPR is a widely used pre-market planning tool among Indian intraday traders. Before the market opens, CPR tells you the expected structure of the day.
Configuration for intraday trading:
- Use daily CPR (calculated from previous day’s H/L/C)
- Plot TC (Top Central Pivot) and BC (Bottom Central Pivot) on your intraday chart
- Narrow CPR = trending day, wide CPR = range day
How to use CPR:
- Narrow CPR: wait for breakout above TC or below BC with volume confirmation, trade in breakout direction
- Wide CPR: treat TC and BC as range boundaries, look for reversals at the boundaries
- Virgin CPR (untested level from previous sessions) = high-probability reaction zone
CPR is most powerful for major indices, but works equally well for large-cap stocks.
5. RSI (Relative Strength Index)
RSI is a go-to momentum oscillator for intraday traders. On intraday charts, RSI(9) is recommended over the standard RSI(14) for faster response.
Configuration for intraday trading:
- RSI(9) on 5-minute charts for entry timing
- RSI(14) on 15-minute charts for trend momentum context
- Key levels: 30 (oversold), 50 (neutral/momentum), 70 (overbought)
How to use RSI for intraday trading:
- RSI below 30 near support (CPR BC or VWAP) = potential long setup
- RSI above 70 near resistance (CPR TC or VWAP + 2SD) = potential short setup
- RSI divergence (price makes new high, RSI does not) = trend exhaustion signal
- RSI staying above 55–60 during a trend = trend is healthy, stay in the trade
Important note for Bank Nifty: Nifty 50 and Bank Nifty can both stay above RSI 70 for extended periods during strong trends. Do not use RSI overbought/oversold readings in isolation — always combine with a level context (CPR, VWAP, key previous highs/lows).
6. MACD (Moving Average Convergence Divergence)
MACD works well as a secondary confirmation indicator for intraday trading, particularly for identifying momentum shifts that EMA crossovers may be slow to catch.
Configuration for intraday trading:
- Standard MACD (12, 26, 9) on 15-minute charts
- Faster MACD (5, 13, 5) on 5-minute charts for more responsive signals
- Focus on MACD histogram direction change rather than line crossovers (histogram flips are faster signals)
How to use MACD:
- MACD line crossing above signal line = bullish momentum confirmation
- MACD histogram turning from negative to positive = early momentum shift signal
- MACD divergence (price makes higher high, MACD makes lower high) = trend weakness warning
- Use MACD on 15-minute to confirm the trend, then drop to 5-minute for entry
7. Bollinger Bands
Bollinger Bands serve two distinct purposes for intraday traders: volatility measurement and mean reversion identification.
Configuration for intraday trading:
- Standard settings (20, 2) work well on 15-minute charts
- Tighter settings (10, 1.5) on 5-minute charts for faster signals
How to use Bollinger Bands:
- Band squeeze (bands contracting) = volatility compression, breakout imminent — prepare for CPR breakout setup
- Band expansion after squeeze = trade in the direction of expansion
- Price at upper band after extended rally = potential mean reversion toward midline
- Price at lower band after extended decline = potential mean reversion toward midline
Market-agnostic tip: Bollinger Band squeezes that happen mid-session, once opening volatility has settled, often produce the cleanest breakout setups of the day.
8. AI-Adaptive Signals
This category represents the new generation of intraday indicators — systems that dynamically adjust their parameters based on current market conditions rather than using fixed settings.
The fundamental problem with static indicators (fixed RSI period, fixed EMA, fixed SuperTrend ATR) is that markets cycle through distinct regimes: trending days, range days, expiry days, event days, low-volatility grinding days. Each regime favors different indicator settings.
Manually switching indicator settings based on market regime is impractical for most traders. AI-adaptive indicators handle this automatically — tightening sensitivity during trending markets, widening during choppy conditions, and adjusting entry thresholds based on current ATR context.
The AI Adaptive Quant Toolkit is Quantzee’s comprehensive solution for this — part of a broader AI trading indicator suite. It combines adaptive trend detection, entry confirmation, and dynamic risk management in one system. For intraday traders, the toolkit includes a scalper preset specifically calibrated for a fast-moving 5-minute major-index environment.
The Adaptive AI Oscillation Engine complements this by providing momentum and reversal signals that adjust to the current volatility regime — useful for identifying when the intraday trend is exhausted and a mean-reversion trade is the higher-probability play.
Why AI-adaptive matters for any market: Markets cycle through trending days, range days, high-volatility event days (central bank policy announcements, budget/fiscal events, global risk-off sessions), and derivatives-expiry days — all within the same trading month. A static indicator calibrated for last month’s conditions is frequently mis-calibrated for this week’s regime. Adaptive indicators self-recalibrate as the volatility environment shifts, which is the core reason they are better suited to active intraday trading than purely static tools.
6-Indicator Comparison Table
| Indicator type | Role | Best for | Repaints? |
|---|---|---|---|
| Session VWAP (IST-anchored) | Intraday fair-value benchmark | Nifty 50, Bank Nifty, liquid NSE large-caps | Non-repainting |
| Adaptive SuperTrend | Trend-following with volatility-adjusted bands | Nifty 50, Bank Nifty futures | Non-repainting variants exist — verify before use |
| Volume confirmation (OBV-style) | Confirms a move has real participation | Liquid NSE large-caps, Nifty/Bank Nifty | Non-repainting |
| Momentum (RSI/MACD) | Overbought/oversold and momentum shift timing | Any liquid NSE instrument | Non-repainting (standard calculation) |
| Opening-range indicator | Filters/weights the volatile opening 15-30 min differently | Nifty 50, Bank Nifty, high-liquidity stocks | Non-repainting |
| AI-adaptive signal engine | Combines trend/momentum/volatility into one adaptive output | Nifty 50, Bank Nifty, liquid NSE stocks | Non-repainting |
Common Mistakes in Indian Intraday Indicator Setup
- Using a UTC-default or exchange-generic VWAP anchor instead of NSE’s 9:15 AM IST open — this silently produces a wrong fair-value read for the entire session.
- Applying Nifty-tuned settings directly to a thinly-traded stock without adjusting for the liquidity difference, producing excessive false signals.
- Treating opening-15-minute signals the same as mid-session signals — the open’s disproportionate volatility can trigger indicators that would otherwise require more confirmation later in the session.
- Ignoring the pre-close volatility pattern — the last 15-30 minutes before 3:30 PM close often sees renewed volume and volatility (position-squaring, MIS-to-CNC conversions) that can distort signals generated right before close.
Session-Timing Awareness: Configuring Around Your Market’s Open and Close
The most overlooked aspect of indicator configuration for intraday traders is adapting settings to the specific timing structure of your exchange’s session. Nearly every session has three distinct behavioral phases, and indicator settings that work in one phase may be suboptimal in another.
The Opening Gap Analysis Window
Before your market opens, related overnight futures and other regional exchanges trade continuously and reflect overnight global cues. The gap between the previous close and today’s open is one of the most information-rich signals of the trading day.
How to read gap context for indicators:
-
Gap up in the direction of a prior trend: High probability of gap continuation. Wait for the first 15-minute candle to close above the gap zone. EMA 9/21 bullish crossover on the 5-minute chart in the window after open confirms entry direction.
-
Gap up against the prior trend (fakeout pattern): High probability of gap fill. VWAP test is critical — if the index cannot sustain above VWAP shortly after open, the gap-fill trade sets up. Avoid new long positions initiated right at the open.
-
Small gap: Treat as a normal open. Follow the CPR direction and wait for the opening volatility to settle before entering any position.
Indicator behavior at the open: All daily-resetting indicators (VWAP, CPR) start fresh at market open. VWAP starts calculating from the opening bell, making the first 15 minutes of VWAP data unreliable for mean-reversion trades — the sample size is too small. Most professional traders wait a while after open before using VWAP as a trade anchor.
The High-Volatility Window After Open
This is typically the highest-volume period of any session for a major index. Opening institutional orders, gap-trade setups, and the establishment of the day’s intraday trend all happen here. Indicator calibration for this window:
EMA settings: The 9/21 EMA crossover on the 5-minute chart works well in this window for momentum confirmation. Key requirement: only take crossovers after a 15-minute candle has confirmed the opening direction. An EMA crossover in the first two 5-minute candles is frequently a false signal.
SuperTrend: The tighter ATR settings (ATR 7, Multiplier 2.0) are appropriate for this window. A higher-beta index’s higher ATR makes a wider multiplier safer to avoid getting stopped out by the opening volatility spike.
CPR: The morning CPR test typically happens in this window. An index that opens above the CPR Top (TC) and holds it through the early test is exhibiting strong bullish day structure. An index that opens below CPR Bottom (BC) and fails to reclaim it is exhibiting bearish day structure.
The Pre-Close Expiry Window
On weekly and monthly expiry sessions, the final 15–30 minutes of trading sees extreme gamma-driven price action. Options with near-zero time value but still in-the-money can cause sharp index moves as market makers delta-hedge expiring positions.
Indicator behaviour in the pre-close window: Standard trend indicators are unreliable in this window. SuperTrend, EMA crossovers, and MACD can generate false signals as the sharp moves are driven by derivatives mechanics rather than genuine directional price discovery. Most experienced expiry-day traders:
- Close or hedge directional futures positions well before the close
- Let expiring options positions run to settlement or close at market
- Avoid entering new positions late on expiry days
- Use VWAP as the only reference level if they must trade this window
Volatility index as an indicator pre-filter: Before using any indicator for intraday entry, check your market’s volatility index. An elevated reading means widen SuperTrend multiplier, increase ATR period, and require stronger indicator confluence before entering. A low reading means low-volatility conditions — reduce SuperTrend multiplier, consider narrower EMA periods for faster response, and be prepared for range-bound conditions where CPR selling setups are more reliable than directional trend trades.
Weekly CPR Expiry Settings for Index Options
CPR is calculated from previous day’s High, Low, and Close. For options traders, the weekly CPR (calculated across the trading week to the previous close) provides additional context for where option max-pain zones are likely to cluster.
Major index 5-minute specific settings:
- EMA: 9 EMA and 21 EMA for entry confirmation; add 50 EMA on 15-minute as the trend anchor
- SuperTrend: ATR 7, Multiplier 2.0 for 5-minute; ATR 10, Multiplier 3.0 for 15-minute
- RSI: RSI(9) on 5-minute; RSI(14) on 15-minute for trend context
- VWAP: Session-anchored VWAP + 1SD and 2SD bands; pay particular attention to 2SD for options sellers
- CPR: Daily CPR from previous day H/L/C; weekly CPR for context on options structure days
Bank Nifty 5-minute specific settings:
Bank Nifty has approximately 1.5–2x the per-candle range of Nifty 50. This requires wider ATR-based settings to avoid getting stopped out by intrabar volatility:
- EMA: 9 EMA and 21 EMA on 5-minute; 50 EMA on 15-minute
- SuperTrend: ATR 7–10, Multiplier 2.5–3.0 on 5-minute (wider than a broad benchmark)
- RSI: RSI(9) on 5-minute; divergence signals are highly reliable on Bank Nifty due to frequent momentum exhaustion patterns near CPR levels
- CPR: CPR width on Bank Nifty is typically wider than on Nifty 50 on trending days, and much wider still on range days — this is the single most important pre-market filter
Best Timeframes for Indian Intraday Trading
5-minute chart — Primary execution timeframe
- Best for: Nifty futures, Bank Nifty futures, large-cap NSE stocks
- Use: Entry and exit timing, EMA crossovers, SuperTrend signals
- Indicators: EMA 9/21, SuperTrend (ATR 7, 2.0), RSI(9), CPR levels, VWAP
15-minute chart — Trend context and confirmation
- Best for: All instruments
- Use: Establish intraday trend direction, confirm 5-minute signals
- Indicators: EMA 9/21/50, SuperTrend (ATR 10, 3.0), MACD(12,26,9), VWAP
1-hour chart — Higher timeframe structure
- Best for: Positional intraday or overnight traders
- Use: Identify key support/resistance levels that matter all day
- Indicators: EMA 21/50/200, Bollinger Bands, VWAP (weekly)
The multi-timeframe approach:
- Check 1-hour chart for key levels and overall trend
- Use 15-minute for trade direction confirmation
- Execute on 5-minute with tight entry timing
This top-down approach filters out a large percentage of losing trades by ensuring all three timeframes agree before entry.
How to Build a Complete Intraday System for Nifty 50 / Bank Nifty / Mid-caps
A complete intraday system needs four components: trend identification, entry trigger, stop-loss placement, and target setting.
For Nifty 50 and Bank Nifty (Index F&O)
Trend identification:
- 15-minute SuperTrend direction (green = bull, red = bear)
- VWAP position (above = bullish bias, below = bearish bias)
- CPR analysis (narrow or wide, and which side of CPR price is on)
Entry trigger:
- 5-minute EMA 9/21 crossover in the direction of the 15-minute trend
- AI Adaptive Quant Toolkit confirmation signal
- Entry only when all three (SuperTrend, VWAP bias, EMA crossover) align
Stop-loss:
- Below/above the 5-minute EMA 21 at time of entry (tight stop)
- Or below/above the nearest CPR level (wider stop, more room)
- Risk no more than 0.5% of trading capital per trade
Target:
- First target: 1.5x the risk (1:1.5 RR minimum)
- Second target (if trend is strong): next CPR level or VWAP ±2SD
For Mid-Cap and Small-Cap Stocks
Mid-caps and small-caps require slightly different calibration:
Key differences from indices:
- Higher percentage moves per ATR unit
- More susceptible to news and sector-specific events
- Less liquid — wider spreads, more slippage on exits
- Options not available for most — pure cash market trading
Adjusted setup:
- Use 15-minute primary chart (5-minute is too noisy for many mid-caps)
- SuperTrend (ATR 10, Multiplier 3.0) to accommodate higher per-stock volatility
- VWAP is still the most important level
- Focus on stocks in trending sectors — check sector rotation in the morning
- Avoid stocks below a reasonable daily-turnover threshold in your local currency — liquidity risk
Quantzee Indicator Stack for Indian Intraday Trading
The recommended Quantzee combination for intraday traders on any market:
Primary system:
- AI Adaptive Quant Toolkit — trend identification + entry signals + dynamic risk management in one indicator
- SuperTrend Pro+ — volatility-adjusted trend confirmation to filter false crossovers
Supporting tools:
- Adaptive AI Oscillation Engine — momentum and reversal detection for identifying trend exhaustion
The entire suite is one payment of $59.99 — less than a single losing trade for most intraday traders, and with no renewal behind it. Test the full indicator stack on paper trades or small positions before committing more capital.
Risk Management for Intraday Traders
No indicator system works without proper risk management. Here are the non-negotiables for intraday trading on any market:
Per-trade risk limit: 0.5% of capital. If you have a certain amount of capital in your trading account, risk no more than 0.5% of it per trade. This is your stop-loss size. Calculate position size accordingly.
Daily loss limit: 2% of capital. If you hit a 2% daily loss, stop trading for the day. Most intraday losses happen because traders chase losses after an early bad trade. The daily loss limit prevents a bad morning from becoming a catastrophic day.
Position sizing calculation:
Position size = (Account Capital × Risk % per trade) / Stop-loss in points
Example: Applying a 0.5% risk rule with a 50-point stop on an index future, calculate the appropriate quantity based on that instrument’s tick/point value and check the current contract specification for your chosen index.
No averaging down on losing intraday trades. Averaging down on a losing derivatives position is one of the most dangerous things an intraday trader can do. If the trade is wrong, exit. Never add to a losing position.
Use bracket orders or cover orders. Most brokers offer bracket orders that automatically set stop-loss and target when you enter. Use them. Taking a trade without a pre-placed stop-loss is not intraday trading — it is gambling.
Track your trades. Keep a simple trading journal: entry price, stop-loss, target, indicator setup used, market regime (trending/range/expiry), and outcome. Reviewing this weekly helps you identify which setups are working, which are underperforming, and whether your results vary by market regime.
Intraday Indicator Summary — Indian Stock and Index Markets
| Indicator | Best Timeframe | Key Use | Major Indices | Free on TradingView |
|---|---|---|---|---|
| EMA 9/21 Crossover | 5 min, 15 min | Trend direction + entry | ✅ Highly effective | ✅ Yes |
| VWAP | 5 min | Mean reversion, institutional bias | ✅ Benchmark | ✅ Yes |
| CPR (Central Pivot Range) | Daily + 15 min | Key intraday levels | ✅ Widely used | ✅ Yes |
| SuperTrend (ATR 7, 2.0) | 5 min, 15 min | Trend filter + stop | ✅ Strong on Bank Nifty | ✅ Yes |
| RSI (14) | 5 min, 15 min | Overbought/oversold | ✅ Expiry day traps | ✅ Yes |
| MACD (12,26,9) | 15 min, 1H | Trend + momentum | ⚠️ Lags volatile opens | ✅ Yes |
| Bollinger Bands (20, 2) | 15 min | Volatility squeeze + breakout | ⚠️ Best low-vol days | ✅ Yes |
| Quantzee AI Adaptive Quant | Any | AI confluence + alerts | ✅ Adaptive across NSE/BSE instruments | Paid ($59.99 once) |
Frequently Asked Questions
Explore Quantzee Indicators
- AI Adaptive Quant Toolkit — full AI confluence system
- SuperTrend Pro+ — volatility-adjusted trend signals
View all indicators · See pricing
What Traders Are Saying
“Quantzee indicators are worth every penny. Reliable, well-built, and gives real clarity.” — Neil Richards ⭐⭐⭐⭐⭐
“Non-repainting signals and adaptive trend logic helped filter bad trades in forex.” — Jason Smith ⭐⭐⭐⭐⭐
“Clear AI trend signals and automatic entries make trading much easier.” — Tim Spencer ⭐⭐⭐⭐⭐
Related Articles
- Best Indicators for Index Options Trading (2026 Guide) — complete pillar guide covering SuperTrend Pro+, MACD Pro+, AI Adaptive Quant Toolkit and full options/futures strategy frameworks
- Best Indicators for Bank Nifty Trading in 2026
- Best TradingView Indicators for Options Traders (2026)
- Central Pivot Range (CPR): The Complete Guide to Trading Pivot Levels
- Index Intraday Trading Strategy: A 2026 Blueprint
- Day Trading Indicators: Complete 2026 Guide (All Markets)