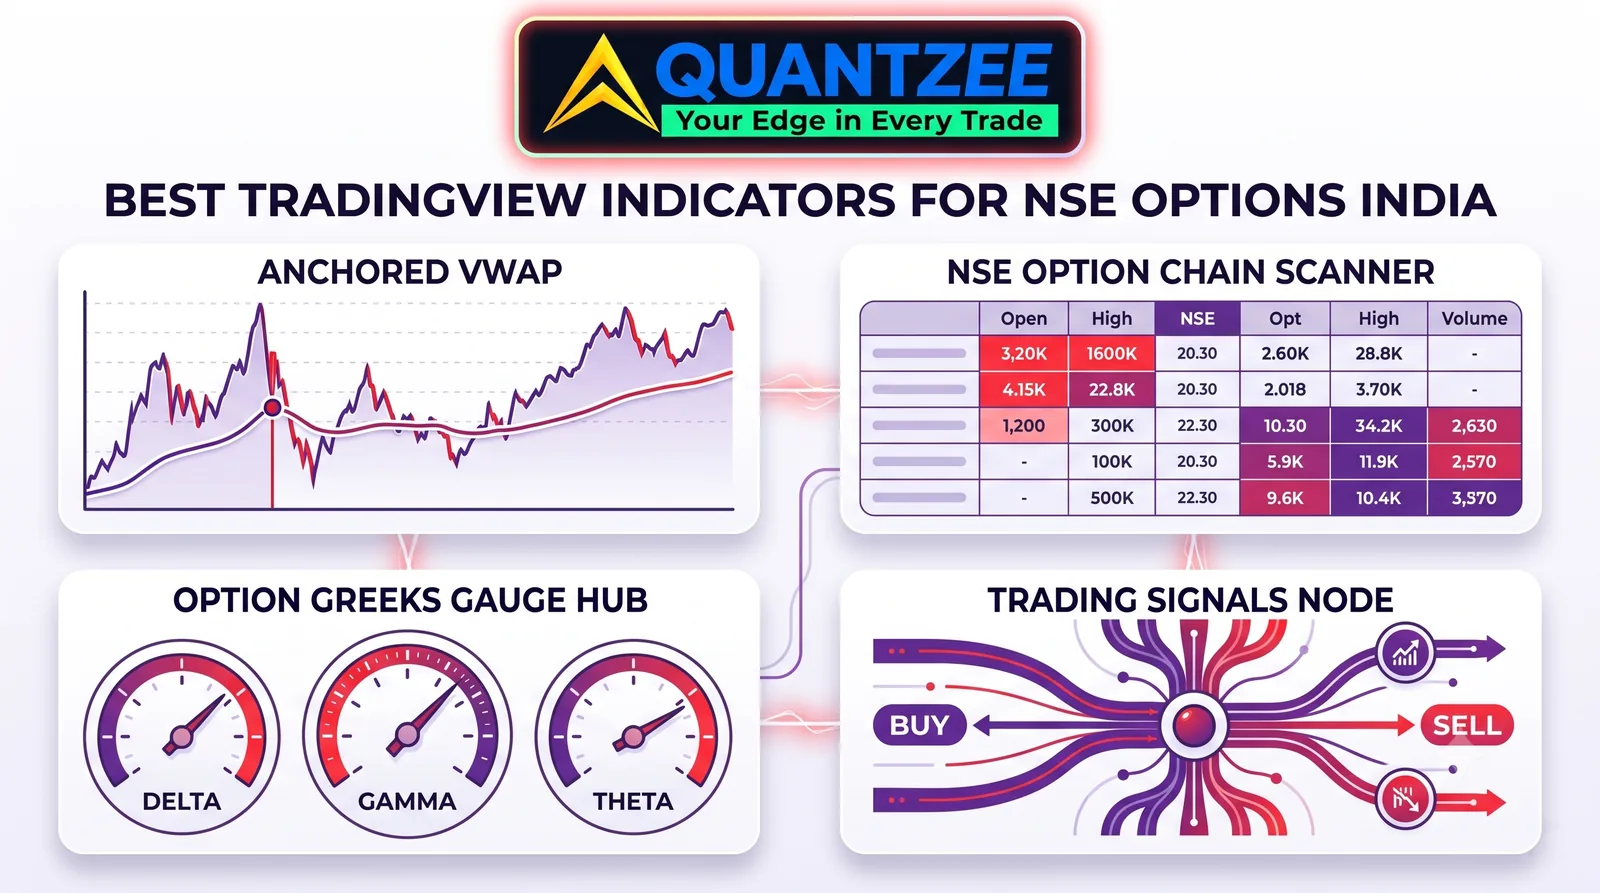
The indicator stack for NIFTY/BANKNIFTY options — CPR, SuperTrend, VWAP, RSI — is the same stack any options trader uses globally; what’s actually India-specific is everything TradingView doesn’t show you: SEBI’s exchange-level weekly expiry rule, the STT/cost drag on your P&L, and how to read NSE’s own option-chain data alongside your chart. This guide skips re-explaining the indicators (see our global options trading indicators guide for that) and focuses entirely on the NSE-specific mechanics a chart alone won’t tell you.
NSE options — NIFTY, BANKNIFTY, and the broader F&O universe — see some of the highest weekly derivatives volume of any exchange in the world. That volume comes almost entirely from retail traders, and a large share of them are trading with an incomplete picture: they know their indicator setup, but not the regulatory rule that determines which index even has weekly options this month, the tax drag that quietly eats into “wins,” or how to actually read the NSE option chain rather than eyeballing it.
This guide covers what’s unique to trading NIFTY/BANKNIFTY options on NSE specifically: the SEBI weekly-expiry framework, the real cost stack (STT + brokerage + GST + stamp duty) on every trade, and a step-by-step walkthrough of the NSE option-chain page — the pieces that sit alongside your TradingView indicator setup, not inside it.
Looking for the indicator walkthrough itself? CPR, SuperTrend, VWAP, RSI, Bollinger Bands, SMC Toolkit Pro, and EMA 9/21 — with full setup details for each — are covered in our global options trading indicators guide. Every one of those indicators works identically on a NIFTY/BANKNIFTY chart; this page picks up from there with what’s India/NSE-specific.
About the Author — Rajeev Gupta: Over 15 years of active trading across Indian index derivatives (NIFTY, BANKNIFTY), global indices, forex, and crypto — with experience spanning structured option selling on NSE weekly expiries, directional option buying around high-IV events, and long-term equity positions — I built Quantzee to close a gap I saw firsthand trading the Indian market: analytical tools available to retail traders here simply didn’t keep pace with what institutional desks were using. Every indicator in the Quantzee suite is stress-tested across multiple NIFTY/BANKNIFTY regimes. This guide reflects that experience, presented for educational purposes only — not investment advice.
⚡ Key Takeaways
- SEBI's exchange-level weekly-expiry framework determines which index actually has weekly options on NSE in a given period — verify the current status for NIFTY and BANKNIFTY from the live NSE circular rather than an older article, since this has been revised more than once.
- STT (Securities Transaction Tax) on options is charged on the sell/exercise side and, combined with brokerage, GST, and stamp duty, is a real drag on frequent intraday option-selling P&L — most retail traders under-account for it.
- TradingView doesn't show the NSE option chain. Reading it correctly — OI, OI change, and PCR columns on nseindia.com — alongside your chart is a separate skill from running indicators.
- Always confirm the current lot size and weekly expiry day for NIFTY/BANKNIFTY directly from the NSE circular before trading — both have changed periodically over the years and older articles/forums often carry stale numbers.
SEBI’s Single Weekly Expiry Rule — What It Means for NIFTY and BANKNIFTY
For years, NSE ran weekly expiries on multiple benchmark indices (NIFTY, BANKNIFTY, FINNIFTY at various points), which is what let traders spread expiry-day activity across several instruments through the week. SEBI has since moved to tighten expiry structure at the exchange level — restricting each exchange to a smaller number of weekly index derivative contracts to reduce excess speculative volume concentrated around expiry days.
The practical impact: an index that had a weekly expiry last year may not have one today, or may have moved to a different weekly expiry day, and NSE has changed the specific weekly expiry weekday for its benchmark index more than once. This is not a detail you can safely carry over from an older blog post or forum thread — check the current NSE circular (or your broker’s contract-specification page) before assuming NIFTY or BANKNIFTY has a weekly expiry on a given day. Feeding a stale expiry-day assumption into your indicator timeframe (e.g. treating a Thursday as expiry day when it no longer is) throws off every day-type and theta-decay read in this guide.
The Real Cost Stack: STT, Brokerage, GST & Stamp Duty on NSE Options
An indicator can be right about direction and still hand you a loss once NSE’s transaction costs are netted against the premium captured — something a TradingView chart never shows you.
Securities Transaction Tax (STT). On NSE options, STT is levied on the sell side of every trade, and separately (at a much higher effective rate on the notional) if the option is exercised/expires in-the-money rather than being squared off before expiry. This asymmetry matters specifically for option buyers who let an ITM position run into expiry instead of exiting — the STT bill on physical/cash exercise can be disproportionate to the premium involved. Always square off ITM long options before expiry unless you’ve specifically checked the current STT treatment with your broker.
Brokerage, GST, and stamp duty. Layer on brokerage per lot (flat-fee discount brokers vs percentage-based), 18% GST on brokerage + exchange transaction charges, and stamp duty on the buy side — small individually, but on a high-frequency weekly-expiry selling strategy across NIFTY/BANKNIFTY, this stack compounds into a real percentage of gross premium collected.
Why this belongs next to your indicator setup, not instead of it. A CPR/VWAP/SuperTrend-confirmed setup that nets, say, 8-10 points on NIFTY after a correct read can be reduced meaningfully once STT + brokerage + GST + stamp duty are subtracted — which is exactly why position sizing and trade frequency (not just signal accuracy) determine whether an indicator-driven strategy is actually profitable on NSE. Run your own numbers against your broker’s current cost schedule rather than assuming a rough industry estimate holds for your account.
Reading the NSE Option Chain Alongside TradingView — Step by Step
TradingView does not display the NSE option chain natively, so every NIFTY/BANKNIFTY options trader ends up cross-referencing nseindia.com’s own option-chain page (or a dedicated options-analytics platform) in a separate tab. Here’s how to actually read it, not just glance at it:
- Filter to the correct expiry first. The option-chain page defaults to the nearest expiry — confirm it matches the expiry you’re actually trading, especially now that weekly-expiry availability varies by index (see the SEBI section above).
- Read OI, not just price. The strike with the highest combined call+put open interest is commonly used as a rough “max pain” reference — the level the index may gravitate toward into the closing hour of expiry day.
- Track OI change through the session, not just the static total. Rising OI on a specific strike during the day shows where fresh positions are actively being built right now — a more current signal than the OI carried over from the previous session’s close.
- Check PCR (Put/Call Ratio) for sentiment skew. PCR meaningfully above 1 is generally read as more put writing than call writing (bullish skew); PCR meaningfully below 1 alongside rising India VIX can flag downside concern. Use PCR as context alongside your TradingView indicator signal, never as a standalone entry trigger.
- Cross-check India VIX in a third tab. Low India VIX means option premium is structurally thin (harder for buyers, safer for sellers); elevated India VIX means premium is rich but directional risk is higher for sellers.
Doing this every session — option chain in one tab, India VIX in another, your CPR/VWAP/SuperTrend chart in TradingView — is what turns a generic technical setup into one actually built around how NIFTY/BANKNIFTY options trade into expiry on NSE specifically.
If you day-trade NSE/BSE stocks and indices generally rather than only options, see our Indian intraday indicators guide. For the indicator walkthrough itself — CPR, SuperTrend, VWAP, RSI, Bollinger Bands, SMC Toolkit Pro, EMA 9/21 — see the global options trading indicators guide; every one of those indicators applies identically to a NIFTY/BANKNIFTY chart.
Frequently Asked Questions
Explore Quantzee Indicators
- AI Adaptive Quant Toolkit — full AI confluence system
- SuperTrend Pro+ — volatility-adjusted trend signals
View all indicators · See pricing
What Traders Are Saying
“Quantzee indicators are worth every penny. Reliable, well-built, and gives real clarity.” — Neil Richards ⭐⭐⭐⭐⭐
“Non-repainting signals and adaptive trend logic helped filter bad trades in forex.” — Jason Smith ⭐⭐⭐⭐⭐
“Clear AI trend signals and automatic entries make trading much easier.” — Tim Spencer ⭐⭐⭐⭐⭐
Related Articles
- Best TradingView Indicators for Options Traders (Global Guide) — the full CPR/SuperTrend/VWAP/RSI indicator walkthrough this page builds on top of
- Best Indicators for Index Options Trading (2026 Guide) — complete pillar guide covering SuperTrend Pro+, MACD Pro+, AI Adaptive Quant Toolkit and full options/futures strategy frameworks
- Best Indicators for High-Beta Index Trading in 2026
- Central Pivot Range (CPR): The Complete Guide to Trading Pivot Levels
- Index Intraday Trading Strategy: A 2026 Blueprint