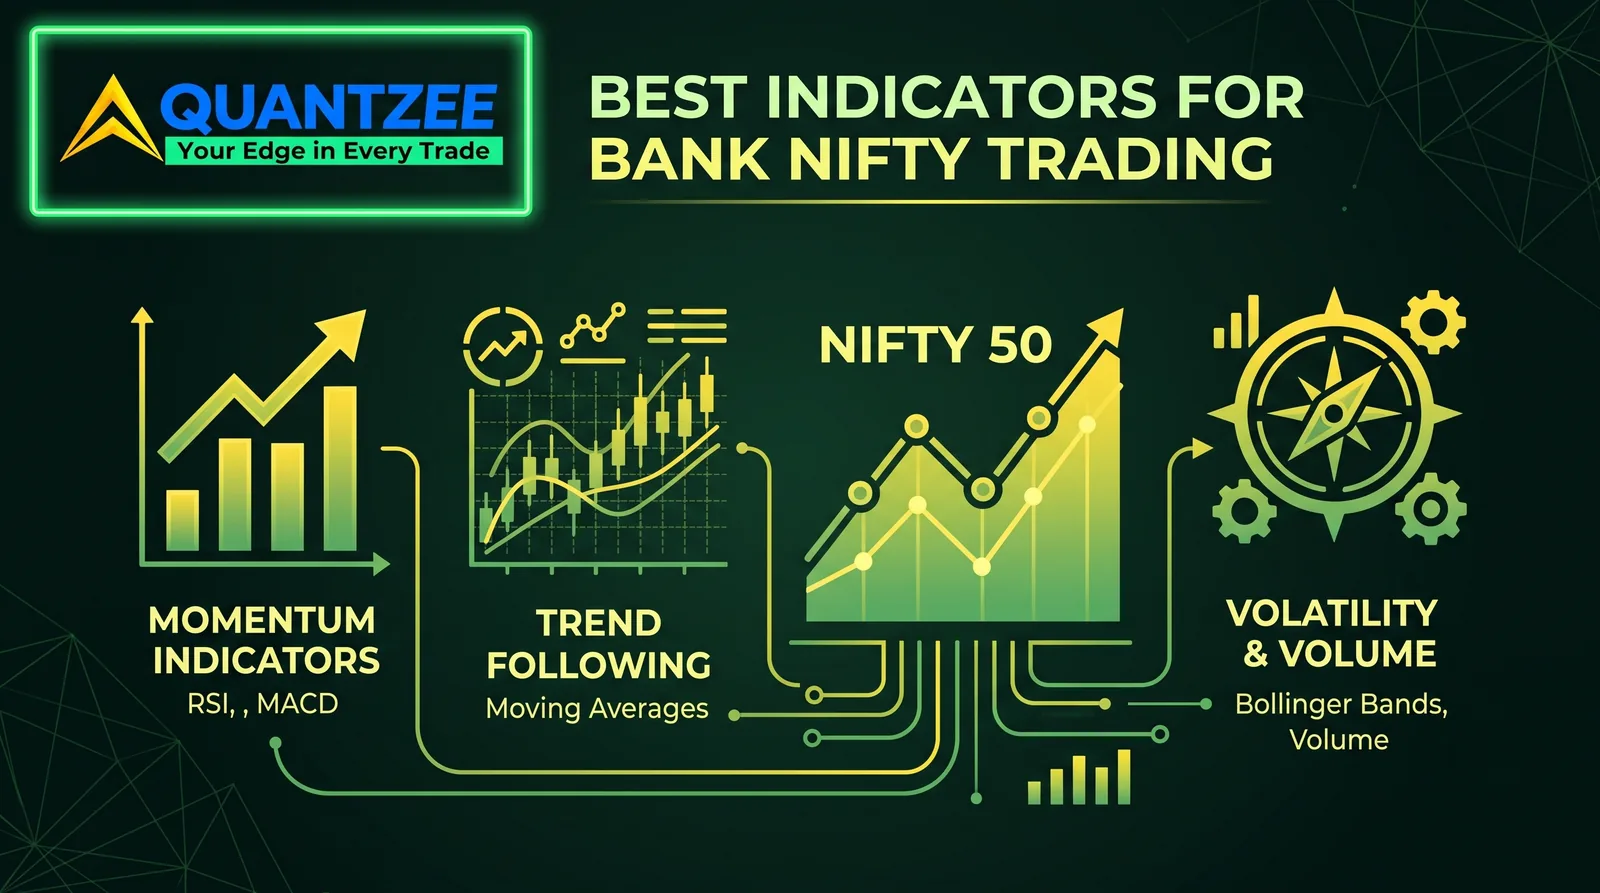
Bank Nifty’s higher intraday volatility compared to Nifty means indicators need faster, more responsive settings to avoid whipsaws on the 5-minute chart. The indicators that hold up best for Bank Nifty specifically: UT Bot Alerts (ATR-based trailing stops), SuperTrend (shorter ATR length than you’d use on slower indices), VWAP with standard deviation bands, CPR/Virgin CPR for session structure, EMA 9/21 for momentum confirmation, and short-period RSI(7) or RSI(9) rather than the standard RSI(14).
High-beta indices — instruments like Bank Nifty, the Nasdaq 100, the DAX, or the Hang Seng — are some of the most unforgiving instruments for intraday traders anywhere in the world. A single session can swing several percentage points. Options and futures premiums collapse or explode within minutes. Expiry and rollover behavior defies most textbook strategies.
If you are trading Bank Nifty using indicators designed for slower-moving equities or forex majors, you are already at a disadvantage. This guide covers the best indicators for high-volatility index trading in 2026 — what they are, how to configure them, and which combinations actually hold up under real market conditions, whatever exchange you trade on.
About the Author — Rajeev Gupta: Over 15 years of active trading across global indices, forex (EUR/USD, GBP/USD, USD majors), and crypto (BTC/USD) — with experience spanning structured option selling on weekly expiries, directional option buying during high-IV events, and long-term equity positions — I built Quantzee to close a gap I observed firsthand: analytical tools available to retail traders simply did not keep pace with what institutional desks were using. Every indicator in the Quantzee suite is stress-tested across multiple market regimes, derived from this same research background. This guide reflects that experience, presented for educational purposes only — not investment advice.
⚡ Key Takeaways
- High-beta indices require recalibrated indicator settings: shorter-period RSI on lower timeframes rather than the standard RSI(14), and SuperTrend with a tighter ATR period and multiplier than settings designed for daily equity charts
- VWAP and CPR are two of the most valuable tools for high-volatility index trading — VWAP defines intraday bias; a narrow CPR (relative to the instrument's typical range) predicts a trending day; an untested "Virgin CPR" level is one of the highest-probability intraday setups available
- Expiry/rollover sessions are structurally different: reduce position size 30–50%, skip the opening minutes of the session, focus entries in the middle of the session, and expect mean reversion toward the max-pain zone into the close
- AI-adaptive signals handle Bank Nifty's rapid intraday regime transitions — gap-trend open to range-bound to directional — better than fixed-parameter indicators that apply the same logic to all three phases
UT Bot best settings for Bank Nifty 5-minute
UT Bot Alerts on Bank Nifty’s 5-minute chart generally needs a shorter ATR period and lower key-value multiplier than the defaults most traders copy from Nifty or equity setups — Bank Nifty’s larger average candle range means standard settings tuned for calmer instruments trail too loosely and give back more of a move before exiting, or too tightly and get stopped out on ordinary noise.
Always paper trade any new setting combination for at least several sessions before using it with real capital — this applies whether you’re testing UT Bot, SuperTrend, or any other indicator on Bank Nifty.
Traders commonly start around ATR period 1–2 with a key value in the 2–3 range for Bank Nifty’s 5-minute timeframe specifically, then adjust based on the current volatility regime — a higher-VIX week calls for a wider multiplier than a quiet, range-bound week. There’s no single “correct” setting that works across every session; Bank Nifty’s expiry-week behavior in particular tends to need a different calibration than a normal trading day.
SuperTrend + VWAP + CPR for Bank Nifty expiry sessions
Bank Nifty’s expiry-day behavior differs meaningfully from a normal session — realized volatility tends to concentrate more heavily into the final hour than it does on Nifty expiry, driven by the index’s concentrated banking-sector composition and heavier options open interest around key strikes.
As always, treat these as decision-support signals, not automated trade triggers — paper trade the combination first.
SuperTrend on a shorter ATR length (7–10) with a 2.0–2.5 multiplier gives a faster trend-flip signal appropriate for Bank Nifty’s pace; combine it with VWAP and its standard deviation bands to gauge whether price is extended relative to the session’s volume-weighted average before acting on a SuperTrend flip. Central Pivot Range (CPR), particularly a “Virgin CPR” day (where the current session’s CPR hasn’t yet been touched), gives useful context on whether Bank Nifty is likely to trend or stay range-bound for the session — a narrow CPR historically correlates with a stronger trending move.
Reading OI and Max Pain for Bank Nifty
Bank Nifty’s options-chain open interest and Max Pain level add context indicators alone can’t provide — a SuperTrend or UT Bot signal against a strong OI wall at a nearby strike carries different risk than the same signal with a clear OI path. Check OI build-up (in lots, not raw contract units) at strikes near the current price, and note the Max Pain strike as a loose gravitational reference for expiry-day price behavior, not a hard prediction. Quantzee’s AI Adaptive Quant Toolkit factors volatility and structural context into its signal layer, which can complement manual OI reading rather than replace it — the software remains analytical, not investment advice, and every signal should be paper traded first before being used with real capital.
Why Bank Nifty Is Unique
Before looking at indicators, it is worth understanding what makes an instrument like Bank Nifty, the Nasdaq 100, or the DAX different from a broad, lower-beta benchmark.
Composition and sensitivity. High-beta indices are typically concentrated in a specific sector or a smaller basket of large, sensitive constituents — banking stocks for Bank Nifty, mega-cap tech for the Nasdaq 100. This concentration makes them highly sensitive to sector-specific catalysts: central bank policy decisions, credit data, and headline news specific to the dominant sector.
Higher beta than the broad index. High-beta indices historically move 1.5x to 2x the percentage move of their broader benchmark on any given day. This amplified beta creates bigger opportunities but also means stops need to be wider — which changes how you size positions and use indicators.
Frequent expiry/rollover cycles. Weekly or monthly options and futures on these indices create intense theta decay pressure heading into expiry, making the last one or two sessions of every cycle dramatically different from the start of the cycle. Indicators that work well early in the cycle can generate false signals near expiry as time value collapses.
Opening volatility zone. The first 15–30 minutes of any exchange’s session are chaotic for Bank Nifty. Large institutional orders execute at open, gaps are common, and liquidity is thinner than the rest of the session. Most experienced traders avoid entering new positions during this window.
Derivatives-dominated price action. Unlike cash-market stocks where delivery buying matters, high-beta index price action is almost entirely driven by derivatives activity — futures positioning and options hedging flow. This creates unique dynamics like gamma squeezes near key strikes close to expiry.
Why Standard Indicators Fail on Bank Nifty
Most retail traders come to Bank Nifty with indicators calibrated for lower-volatility instruments. Here is where standard setups break down:
Fixed period RSI gives too many false signals. RSI(14) works reasonably well on daily charts of mid-cap stocks. On a 5-minute high-beta index chart, a fixed 14-period RSI will show overbought/oversold readings that persist for 20–30 candles during trending moves — generating false reversal signals at the worst possible moments.
Standard SuperTrend settings are too slow. The default SuperTrend settings (ATR 10, Multiplier 3) were designed for daily charts. On 5-minute intraday charts of Bank Nifty, this combination lags by 8–12 candles and will keep you in a losing trade while a reversal has already started.
Basic MACD misses expiry-session moves. The standard MACD (12, 26, 9) on 5-minute timeframes has so much lag on Bank Nifty that by the time a crossover confirms, 60–80% of the move is already done. Near expiry, the index can reverse sharply before MACD even hints at the turn.
Moving averages alone cannot handle gap opens. High-beta indices gap up or down multiple times per month due to overnight cues. Simple EMA crossover systems have no way to handle these gaps — they either generate false signals immediately after open or miss the entire post-gap trend.
The solution is not to abandon these indicators but to use them with proper calibration, combine them with context-specific tools like CPR, and layer in AI-adaptive signals that adjust to changing volatility regimes.
Top 7 Indicators for Bank Nifty Trading
1. SuperTrend (Recalibrated for Bank Nifty)
SuperTrend is one of the most reliable trend-following indicators for Bank Nifty — but only when the settings are right. For 5-minute intraday trading, use ATR period 7 to 10 with a multiplier of 2.0 to 2.5. This tighter configuration responds faster to the instrument’s higher average true range.
The core rule is simple: trade long when price is above the SuperTrend line, short when below. Use it as a trend filter first — only take buy signals from other indicators when SuperTrend is bullish, and only short signals when SuperTrend is bearish.
For 15-minute charts, ATR 10 with multiplier 3.0 works better, giving you a smoother trend signal for positional intraday trades.
Disclaimer: Quantzee indicators are analytical software tools designed to assist your own analysis. This content is for educational purposes only and does not constitute investment advice. Do your own research. Trading involves risk of capital loss. Quantzee is not a registered investment advisor in any jurisdiction. Analytical software, not investment advice.
2. VWAP (Volume Weighted Average Price)
VWAP is arguably the single most important intraday indicator for Bank Nifty. Institutional traders — funds, market makers, and proprietary desks — execute massive orders relative to VWAP, which means price naturally gravitates back to VWAP throughout the day.
Key VWAP rules for high-beta indices:
- Price above VWAP = bullish intraday bias, prefer buy setups
- Price below VWAP = bearish intraday bias, prefer short setups
- First retest of VWAP after an opening gap often gives the cleanest entry of the day
- Near expiry, VWAP becomes magnetic — price tends to close near VWAP as market-maker hedges unwind
Add standard deviation bands (1 SD and 2 SD) to your VWAP. Price reaching the 2 SD band on a 5-minute high-beta index chart often signals an overextended move ripe for mean reversion.
3. CPR (Central Pivot Range)
CPR is deeply ingrained in how professional high-beta index traders structure their day. The formula:
- Pivot (P) = (Previous High + Previous Low + Previous Close) / 3
- Top Central Pivot (TC) = (Previous High + Previous Low) / 2
- Bottom Central Pivot (BC) = (2 × Pivot) − TC
The range between TC and BC is the Central Pivot Range. A narrow CPR relative to the instrument’s typical daily range signals a trending day ahead. A wide CPR suggests a range-bound or volatile session.
Virgin CPR is one of the most powerful setups on any high-beta index. When price has not touched a previous session’s CPR — that level acts as a magnet. When price finally reaches it, reactions are often sharp and reliable.
4. EMA 9 and EMA 21
The 9/21 EMA crossover is a bread-and-butter setup for high-beta index intraday traders. On the 5-minute chart:
- 9 EMA crossing above 21 EMA = bullish momentum confirmation
- 9 EMA crossing below 21 EMA = bearish momentum confirmation
Use this as a momentum filter rather than a standalone entry. The most reliable setups combine an EMA crossover with VWAP direction alignment — meaning take the 9/21 bullish cross only when price is also above VWAP.
On 15-minute charts, add a 50 EMA as the trend anchor. Only take trades in the direction of the 50 EMA.
5. RSI (Adaptive Settings)
For 5-minute charts on Bank Nifty, use RSI(7) or RSI(9) instead of the standard RSI(14). The shorter period responds faster to the instrument’s volatility. Key levels:
- RSI below 30 on 5-min after a sharp drop = potential bounce zone
- RSI above 70 on 5-min after a sharp rally = potential resistance zone
- RSI divergence (price makes new high, RSI does not) = strongest reversal signal
Avoid acting on RSI signals in isolation. Bank Nifty can stay above 70 RSI for 40+ candles during strong trends. Always confirm with price action near a key level — CPR, VWAP, or a significant previous high/low.
6. Open Interest-Based Analysis Tools
Open interest data is crucial for high-beta index options trading. While TradingView does not have live derivatives-exchange OI data built in for every market, several paid data feeds integrate OI analysis. What to look for:
- Max Pain — the strike price where maximum options expire worthless. High-beta indices tend to gravitate toward max pain as expiry approaches, especially in the final hours of the expiry session.
- PCR (Put-Call Ratio) — PCR above 1.2 indicates heavy put writing, suggesting bullish market sentiment. PCR below 0.8 with rising implied volatility can indicate fear and potential downside.
- Strike-wise OI — strikes with the highest OI act as resistance (calls) and support (puts) on any given expiry.
7. AI-Adaptive Signals
This is where modern high-beta index trading has evolved. AI-powered indicators dynamically adjust their sensitivity based on current volatility conditions — something static indicators simply cannot do. Instead of manually recalibrating RSI, SuperTrend, and EMA settings every time market conditions shift, an AI-adaptive system handles this automatically.
For high-beta indices specifically, adaptive AI signals shine on three types of days: gap-and-go trending days, mean-reverting choppy days, and expiry-day gamma squeezes. The same static indicator setup cannot handle all three efficiently.
8. UT Bot Alerts
UT Bot Alerts is a widely-used free community indicator on TradingView built around an ATR-based trailing stop rather than a fixed band — mechanically similar in spirit to SuperTrend, but calculated differently, which makes it a useful complementary tool rather than a duplicate.
How it works: UT Bot Alerts computes a trailing stop-loss line using a multiple of ATR applied to a smoothed price source (commonly an EMA). When price closes across that trailing line, the indicator flips direction and fires a buy or sell signal. Because the stop line only trails in the direction of the trade (it does not retreat), it behaves as both a trend signal and a mechanical exit level in one plot.
Concrete settings for high-beta index intraday use:
- Key Value (sensitivity multiplier): Standard default is 1; for high-beta index 5-minute charts, traders commonly tighten this to increase responsiveness on faster instruments — test in the 1–2 range and compare whipsaw frequency against the default before committing to a lower value.
- ATR Period: Default is 10. Shortening the ATR lookback (e.g., toward 7) makes the trailing stop react faster to the instrument’s actual recent volatility — the same adjustment principle used for SuperTrend recalibration on high-beta indices, covered above.
- Signal source: Commonly applied to the close price with an EMA smoothing pass; some traders swap in HA (Heikin Ashi) close for smoother signals at the cost of some lag.
Where it fits the stack: UT Bot Alerts occupies the same “Layer 1/2 — trend + primary signal” role as SuperTrend. Because both tools use ATR-based logic but compute it differently, some traders run both simultaneously and only act on signals where they agree — a simple, low-maintenance confluence filter that reduces false flips versus either tool alone, at the cost of fewer total signals.
Limitation: Like SuperTrend, UT Bot Alerts is a trend-following tool by construction — it will whipsaw in genuinely range-bound conditions regardless of ATR period tuning. Pair it with VWAP or CPR context (covered above) rather than relying on it in isolation during a session with a wide CPR (a signal that a range-bound day is more likely).
How Quantzee’s Indicators Are Calibrated for Bank Nifty
Quantzee’s AI trading indicator suite is built around the reality of high-volatility index trading — not hypothetical backtests on smooth daily charts.
The AI Adaptive Quant Toolkit combines trend identification, entry confirmation, and dynamic risk management in one system. For high-beta index intraday trading, the trend detection component uses an adaptive ATR model that tightens during low-volatility periods and widens during expansion phases — automatically. You do not need to change settings when the index shifts from a quiet range day to a wide trending day.
The SuperTrend Pro+ goes beyond standard SuperTrend by layering multiple volatility filters to eliminate the whipsaw trades that standard SuperTrend generates during Bank Nifty’s choppy midsession lull. The result is fewer, cleaner signals — which matters more than raw signal count when each trade involves a significant contract value.
For options sellers specifically, SMC Toolkit Pro auto-plots support/resistance zones that double as strike-selection reference points, and the Adaptive AI Oscillation Engine flags overbought/oversold conditions that matter for timing weekly-expiry entries.
For one payment of $59.99, the full Quantzee suite gives you tools purpose-built for high-beta index trading — with the Pine Script source emailed to you and nothing to renew.
Trading Setups and Best Timeframes
5-minute chart — Primary intraday execution
The 5-minute chart is the workhorse for high-beta index intraday trading. Setup:
- Mark CPR levels before the session opens
- Note VWAP from the moment the market opens
- Wait for the opening volatility zone to settle
- Look for first clean setup: price rejecting CPR BC or TC with SuperTrend aligned
- Use EMA 9/21 crossover as entry trigger confirmation
- Stop-loss: just below/above the CPR range or 1 ATR from entry
15-minute chart — Trade management and trend confirmation
Use the 15-minute chart to identify the larger intraday trend. The 15-minute setup:
- If 15-min is in a clear uptrend (price above 21 EMA, SuperTrend bullish), only look for longs on the 5-min
- If 15-min is in a downtrend, only look for shorts on the 5-min
- This top-down approach filters 30–40% of losing trades
Expiry Session — Specific adjustments
On Bank Nifty’s expiry session:
- Reduce position size by 30–50% — moves are sharp and reversals are sudden
- Avoid trading the opening minutes as options gamma creates erratic moves
- Focus on the middle of the session — most directional expiry moves happen here
- In the closing hour, expect mean reversion toward max pain — avoid chasing momentum
Common Bank Nifty Trading Mistakes
Trading the opening minutes aggressively. The opening window has high spread, thin liquidity, and institutional order flow that is impossible to read. Most retail traders who enter here get stopped out within minutes.
Ignoring the expiry-cycle context. A setup that works perfectly early in the cycle will behave differently near expiry. Expiry sessions require different position sizing and target expectations.
Using the same SuperTrend settings as slower equities. Bank Nifty moves 3–5x more intraday points than a typical large-cap stock. Standard settings are far too slow.
Trading against the VWAP trend. Counter-VWAP trades do work occasionally but require very tight stops and sharp execution. For most traders, going with the VWAP direction significantly improves win rate.
Holding options overnight into expiry. Weekly options on Bank Nifty lose significant time value overnight going into expiry. Unless you are delta hedging, overnight long options positions the night before expiry carry high theta risk.
Overtrading on choppy days. A wide CPR signals a range-bound day. On these days, most trend-following setups will generate false signals. Recognize choppy days early and either stay out or switch to a range-trading approach.
What the Best Bank Nifty Indicator Stack Looks Like
A practical, tested combination for Bank Nifty 5-minute intraday trading:
| Layer | Indicator | Purpose |
|---|---|---|
| Trend direction | SuperTrend (ATR 7, 2.0) | Is the market trending up or down? |
| Context | CPR levels | Where are the key reaction zones? |
| Bias filter | VWAP | Are we above or below the day’s value area? |
| Momentum | EMA 9 / 21 | Is momentum confirming the trend? |
| Exhaustion | RSI(7) | Is the move overextended? |
| AI confirmation | AI Adaptive Quant Toolkit | Confluence validation before entry |
You do not need all of these on every trade. The key is that trend, context, and momentum should align before you enter. If two of the three are contradicting each other, wait.
Explore Quantzee Indicators
- AI Adaptive Quant Toolkit — full AI confluence system
- SuperTrend Pro+ — volatility-adjusted trend signals
View all indicators · See pricing
What Traders Are Saying
“Quantzee indicators are worth every penny. Reliable, well-built, and gives real clarity.” — Neil Richards ⭐⭐⭐⭐⭐
“Non-repainting signals and adaptive trend logic helped filter bad trades in forex.” — Jason Smith ⭐⭐⭐⭐⭐
“Clear AI trend signals and automatic entries make trading much easier.” — Tim Spencer ⭐⭐⭐⭐⭐
Related Articles
- Best Indicators for Index Options Trading (2026 Guide) — complete pillar guide covering SuperTrend Pro+, MACD Pro+, AI Adaptive Quant Toolkit and full options/futures strategy frameworks
- Index Intraday Trading Strategy: A 2026 Blueprint
- Best TradingView Indicators for Options Traders (2026)
- Central Pivot Range (CPR): The Complete Guide to Trading Pivot Levels
- Best Intraday Indicators for Global Stock Markets in 2026