The evening star candlestick pattern is usually taught as a picture. A long bullish candle, a small indecisive body, then a long bearish candle that closes back down into the first. That picture is correct. It is also useless if you are trying to code the rule, or decide whether a real three-candle sequence on your chart actually qualifies. Four parameters do the real work: candle one's body size, the star's body cap, whether a gap is required, and how deep candle three has to close. Almost no page on the first page of results states numbers for any of them. This piece states the rules, audits where the commonly quoted reliability figures actually come from, and puts the evening star next to bearish engulfing and the shooting star, so you know which read to trust when the shapes overlap. It's one of several multi-candle reversal patterns mapped in our full chart and candlestick patterns guide.
The Three-Candle Sequence, Written as Rules Instead of Shown as a Picture
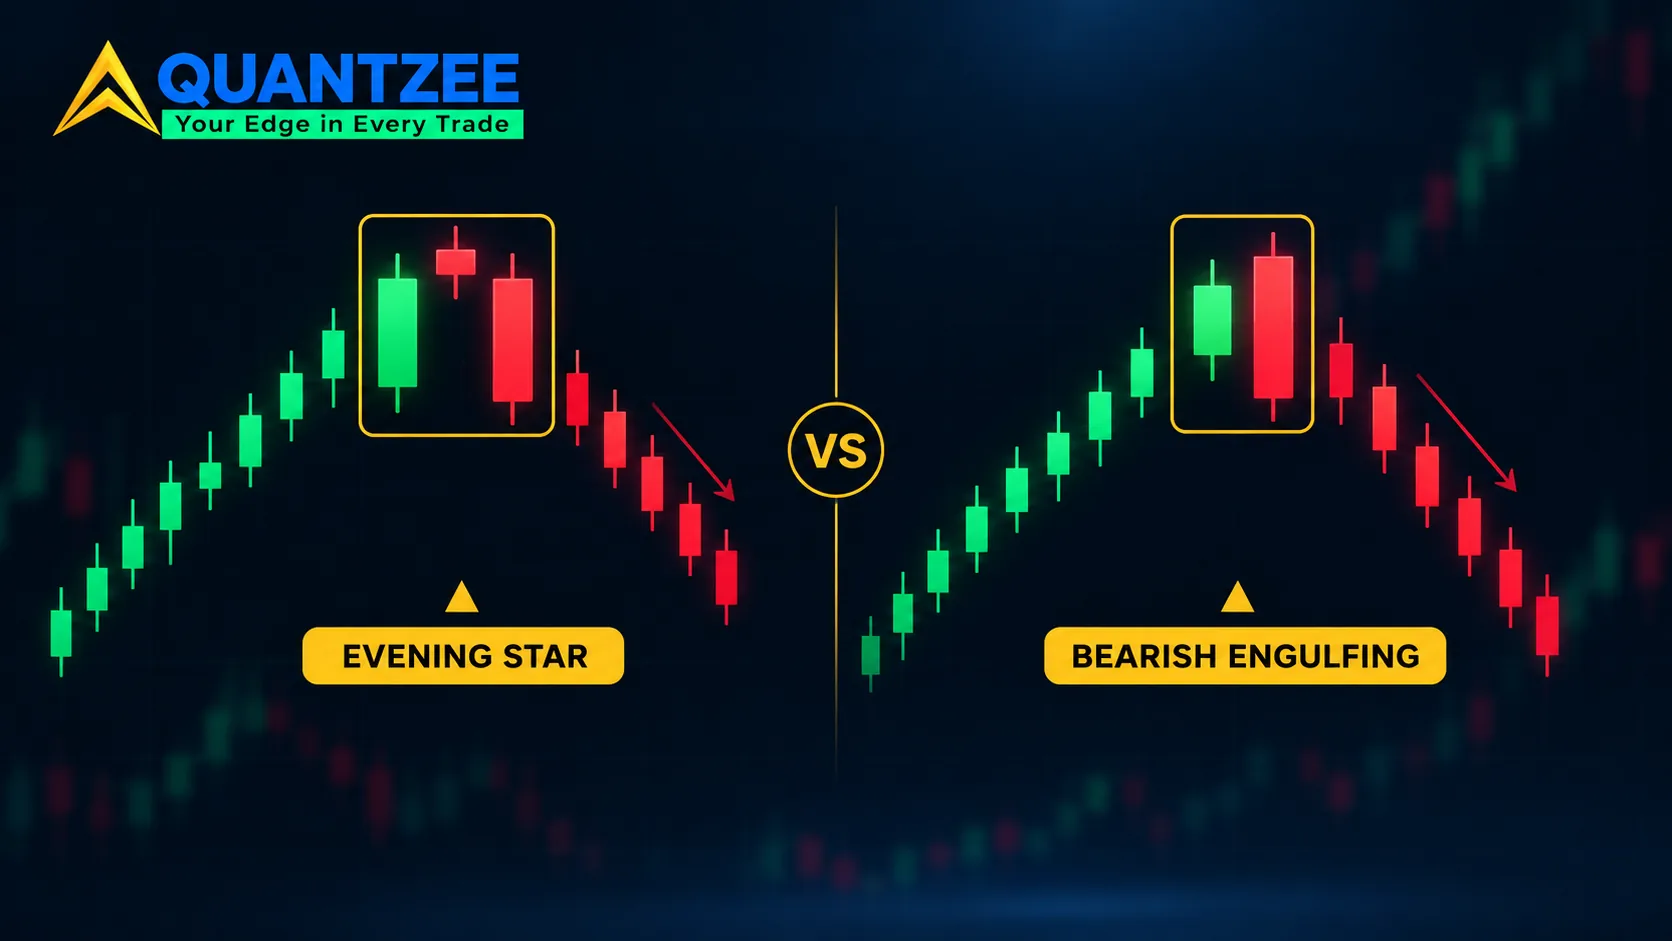
A diagram is a starting point, not a definition. Written as rules, an evening star formation needs three consecutive candles inside an established uptrend.
- Candle one is a long bullish candle. It closes near its high, continuing the prevailing trend.
- Candle two, the "star," is a small-bodied candle. It can be bullish, bearish, or a doji. It opens above candle one's close and trades in a narrow range relative to candle one.
- Candle three is a bearish candle. It opens inside or below the star's body and closes down into candle one's real body, erasing a meaningful share of the first candle's gain.
Every clause above hides a threshold. "Long," "small-bodied," "narrow range," and "meaningful share" are judgment calls until someone attaches a number to them. That is exactly where published sources diverge. Per the taxonomy below, the four parameters are candle one's body size, the star's body cap, the gap requirement, and candle three's close depth. The last of those does more work in separating a real reversal signal from noise than the other three combined.
Four Parameters Every Definition Leaves Vague
A detection rule that can be coded and back-tested needs explicit values for each of the four parameters. A rule described only in prose, which is what most educational pages publish, cannot be tested by the reader at all. It can only be eyeballed.
Candle One: How "Long" Is Long?
The first candle needs a reference, not an adjective. Three approaches are common. The simplest measures candle one's body as a percentage of its own high-low range. A body-to-range ratio above roughly 70% is a typical cut-off for calling a candle "long." A second approach compares the body size to the average true range over the preceding 10 to 20 bars. It flags candle one only when its body exceeds that average by some multiple, often 1.2 to 1.5 times. A third approach compares candle one to the recent distribution of body sizes on that instrument and timeframe. This adapts automatically to quiet and volatile stretches, but needs more price history to calibrate. None of these three is objectively correct. They are different lenses on the same word. A page that simply says "long bullish candle" has not actually defined the pattern.
The Star: How Small, and Does Color Matter?
The star's defining feature is a small real body relative to candle one. The common cap sits somewhere between 10% and 30% of candle one's body. Below that cap, color is mostly treated as irrelevant. A small bullish star and a small bearish star are usually read the same way, because the star's job is to show indecision, not direction. Some stricter variants require the star's body to gap above candle one's close on both the open and the close. This stricter version is a "true" evening star island. It fires far less often than the loose version, and on the figures that do exist, the rarer version tends to carry higher conviction.
The Gap: Required, Preferred, or Irrelevant?
Classical candlestick theory grew out of Japanese rice markets. It was adapted to US equities much later, and it treats the gap between candle one and the star, and again between the star and candle three, as part of the definition. On instruments that trade nearly around the clock, true gaps of that kind are rare. Major currency pairs, many CFDs, and index futures outside a single exchange's cash session all fall into this group. There is very little non-trading time left for a gap to form. A gap-mandatory rule applied to a 24-hour instrument will fire on only a small fraction of the sequences a gap-optional rule catches. This single difference is probably the biggest reason published evening star frequency and reliability figures diverge as widely as they do. One source's sample is built on a gap-strict rule. Another's is not. Neither page says so.
Close Depth Into Candle One: The Parameter That Does the Most Work
How far candle three has to close back into candle one's real body is the lever that separates a weak pullback from a confirmed reversal read. It is also the parameter almost no educational page states as a number. A loose rule only requires the close to re-enter candle one's body at all. Any penetration counts. A moderate rule requires the close to retrace at least half of candle one's body. A strict rule requires closing below candle one's own open. That means candle three has erased the entire first candle's gain and then some. Vendors who do publish a specific figure most often land in the 50% to 67% range for what counts as a qualifying close. The published figure almost never says what happens to signal count and follow-through as that threshold moves. Tightening the close-depth requirement produces fewer signals. On the general pattern-detection work our team has done across other reversal setups, those fewer signals tend to be the ones with better follow-through. We cannot publish that sensitivity curve for the evening star specifically in this piece, because the scan has not been run on US instruments yet. What follows instead is the parameter taxonomy and the source audit that most pages skip, so a reader can apply their own threshold with full knowledge of what each choice trades off.
A Source Audit: Where the Published Reliability Figures Actually Come From
Most pages that discuss the evening star candlestick pattern repeat a reliability figure without naming where it came from. They do not state the instrument it was measured on, or how many formations the sample contained. That is worth auditing directly, because the number gets repeated as if it were universal when it is specific to one researcher's rule set and one market.
ThePatternSite.com, maintained by a long-running independent pattern researcher, is the original source behind the reliability figures that much of the rest of the web quietly repeats. According to the methodology published on that site, the tracked results come from a sample of several hundred formations measured on US equities. The tracking window runs back to the late 1990s, using that researcher's own specific definition of each parameter, body size, gap, and close depth included. That is a real dataset with a stated sample and a stated instrument class. It already puts the page ahead of most of the pages citing it, because those pages drop the sample size and the instrument class when they repeat the number.
Tradeciety's guide to the evening star reads very differently. It is built around seven annotated currency-pair charts, and it does not publish a reliability figure or state validation tolerances anywhere in the piece. That is a legitimate teaching approach for showing what the shape looks like. But it means the figure a reader sees on some other page did not come from this one. The figure was imported from a different source, on a different instrument class, and pasted in without attribution.
A third common citation pattern shows up on broker and education sites covering the mirror-image bullish three-candle pattern. These pages reports that a round number near 70% applies, with no sample, no date range, and no instrument named. That is the clearest version of the problem this audit is trying to surface. A round number with nothing behind it reads as more precise than a number with a stated sample and real variance, which is backwards. The page with the honest caveats deserves more trust, not less.
The practical takeaway: a reliability figure for the evening star candlestick pattern only means something next to the instrument it was measured on, the sample size, and the exact parameter thresholds used. A figure measured on US equities with a gap-mandatory rule should not be assumed to transfer to a 24-hour index or currency instrument with a gap-optional rule. The earlier section on gaps shows why: those two rule sets catch different subsets of formations in the first place.
Evening Star vs. Bearish Engulfing vs. Shooting Star: Which Read Is Right?
These three bearish reversal patterns get confused because they share a family resemblance. Each one marks a failed attempt to extend an uptrend. But they are not interchangeable, and picking the wrong one changes what you are actually claiming about the chart.
Bearish engulfing is a two-candle pattern. A bullish candle is followed by a bearish candle whose real body fully engulfs the prior candle's body. It is a faster signal than the evening star, since it needs one fewer candle to confirm. It also carries less built-in confirmation, because there is no small-bodied indecision candle in between showing that momentum actually stalled before reversing. When a potential evening star's star candle turns out unusually large, closer to a normal body than a small one, the sequence often reads better as bearish engulfing on the first two candles. The "indecision" requirement for a true star was never met.
The shooting star is a single-candle pattern. It has a long upper wick, a small real body near the candle's low, and little to no lower wick, appearing after an uptrend. It is the fastest of the three signals and the least confirmed, because it is read off one candle. There is no requirement that the next candle actually close down. A shooting star followed by a bearish candle that closes deep into the shooting star's body is, functionally, very close to an evening star read, with the shooting star playing the role of the star candle. The two patterns overlap more than most comparison pages acknowledge.
In practice, the ranking by confirmation strength runs evening star first, bearish engulfing second, shooting star third. The ranking by speed runs in the reverse order. A trader who wants the earliest possible signal accepts the shooting star's weaker confirmation. A trader who wants a signal that has already shown two separate steps of exhaustion, momentum stalling, then reversing, waits for the full three-candle evening star to complete. That wait costs one extra candle of confirmation time versus bearish engulfing, and two extra candles versus the shooting star.
Combining the Four Parameters Into One Codeable Rule
Taxonomy is one thing. Turning it into a rule you can actually run against a chart is another. A codeable evening star rule needs a specific value for all four parameters at once, not just a description of each one in isolation.
Start with candle one. Pick one of the three body-size approaches above and commit to it. A common starting point is the body-to-range method, with a cut-off near 70%. That single choice already removes a large share of ambiguity, because every candle on the chart now has a yes-or-no answer instead of a judgment call.
Next, set the star's body cap. A cap of 25% of candle one's body is a reasonable middle ground between the loose end (closer to 30%) and the strict end (closer to 10%). Lower the cap and fewer sequences qualify, but the ones that do tend to show a cleaner indecision signature.
Then decide on the gap. If the instrument trades close to 24 hours a day, treat the gap as optional rather than mandatory, for the reason covered above. If the instrument has a defined close, such as a single-exchange equity session, a gap requirement is workable and matches the classical definition more closely.
Finally, set the close-depth threshold. This is the parameter to spend the most time on, since it does the most work. A 50% threshold is a reasonable starting point for most equity and index work; a 60% to 67% threshold produces a stricter, lower-frequency signal.
Once all four values are fixed, the rule is fully specified, and two different people running it on the same price history will get the same formations. That reproducibility is the entire point of writing the parameters down instead of leaving them as adjectives. Our team treats this as the baseline test for whether a pattern definition is actually usable: if two analysts can disagree about whether a given three-candle sequence qualifies, the rule is still incomplete, whatever the accompanying diagram looks like.
Entry, Invalidation, and Stop Placement
Once a three-candle sequence clears whatever body-size, gap, and close-depth thresholds a trader has chosen, three mechanical questions remain: where to enter, where the setup is invalidated, and where to place a stop.
A conservative entry waits for the close of candle three, then enters on the following candle's open. This accepts that some of the move is already behind the entry, in exchange for a fully confirmed signal. A more aggressive entry acts on candle three's close once it has cleared the chosen depth threshold intraday, without waiting for the next candle to open. This improves entry price, at the cost of occasionally acting on a formation that does not actually close as deep as it looked mid-candle.
Invalidation is most commonly placed at the star candle's high. A subsequent close back above that level means the attempted reversal has failed, and the prior uptrend has resumed. Three situations commonly invalidate a developing setup before it even completes. First, candle three fails to close back into candle one's body at all, so the pullback stays shallow and the sequence never qualifies. Second, candle three gaps or closes above the star's high rather than below it, so the reversal attempt reverses itself within one or two candles. Third, the star candle's body turns out too large relative to candle one to meet whatever cap was chosen. At that point the sequence reads better as a simple pullback within the trend than as a reversal pattern at all.
Stop placement typically sits just above the star candle's high. This gives the position room for the normal retest-and-fail behavior that follows a fresh reversal signal, without sitting so far away that the risk-reward on the trade stops making sense. None of this is a guarantee of outcome. A historical reliability figure measured on a fixed sample, however carefully sourced, describes what happened in that sample. It does not describe what will happen on the next formation, and it should be treated as one input among several, not a standalone signal. This is analytical software territory, not advisory territory. Quantzee's pattern tools surface where a formation sits against its own historical thresholds, so a trader can make that judgment with context. Paper trading any new rule set before committing size remains the sensible first step, whichever published figure a trader starts from.
Does Timeframe Change the Read?
The same four parameters apply on a 5-minute chart and on a weekly chart, but the practical weight of each one shifts. On a short intraday timeframe, candle bodies are smaller relative to the day's typical range, and random noise produces far more small-bodied candles that superficially look like a star. A close-depth threshold that works well on daily candles can let through far too many weak signals on a 5-minute chart, simply because retracements of 50% or more happen constantly inside normal intraday noise.
One practical adjustment is to require a longer lookback for the average-true-range comparison on faster timeframes, so candle one's "long" threshold reflects recent volatility rather than a single outlier bar. A second adjustment, common among traders who combine candlestick reads with other confirmation, is to require the daily or 4-hour chart to agree with the shorter timeframe's reversal signal before acting on it. That cross-timeframe check does not change the candlestick definition itself, but it filters out a meaningful share of the false positives that a loose intraday rule would otherwise pass.
Common Mistakes When Reading an Evening Star
A handful of mistakes show up again and again when traders apply the evening star candlestick pattern without first settling on thresholds.
- Treating a medium-sized second candle as a valid star, instead of checking it against a stated body-size cap.
- Counting any close lower than candle one's close as "confirmation," rather than checking the close depth against candle one's real body.
- Requiring a gap on a 24-hour instrument, which can suppress every valid signal for weeks at a time on some currency pairs.
- Reading reliability figures from a different instrument class as if they apply directly to the chart in front of you.
- Ignoring the broader trend context. A three-candle sequence that looks like an evening star inside a sideways range, rather than after a clear uptrend, is a different and weaker signal than the textbook version.
Our clients most often ask which single close-depth number to use, and the honest answer is that the number should match the instrument and timeframe being traded, not a figure imported from a different market. A 50% retracement threshold on a 4-hour chart and a 50% threshold on a 5-minute chart are not drawing from the same population of formations, since the average true range and the typical candle-to-candle noise differ sharply between those two timeframes.
Frequently Asked Questions
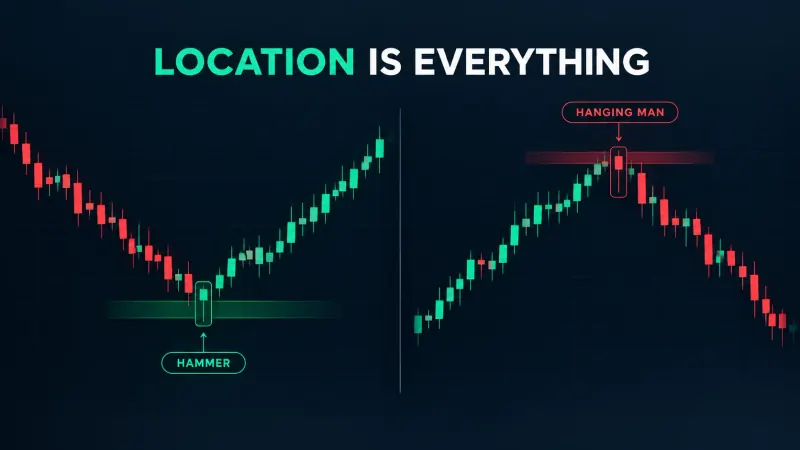
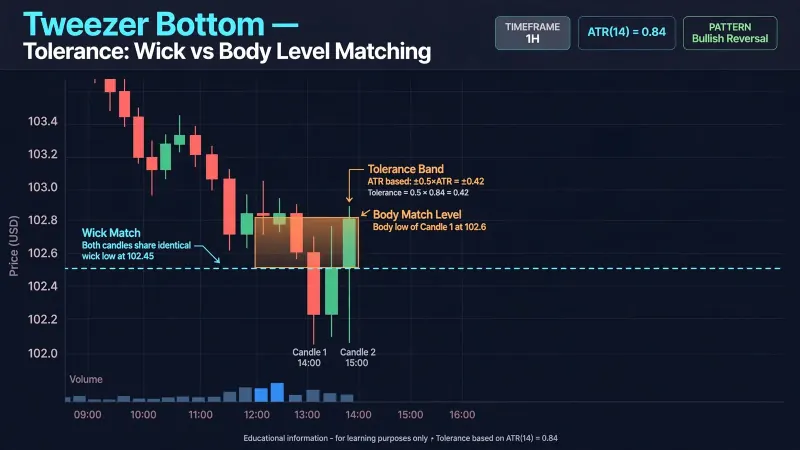
Candlestick definitions that leave their thresholds unstated are not wrong, exactly. They are incomplete, in a way that makes two different traders reading the "same" pattern actually look at different populations of formations. According to the audit above, the published figures that do exist trace back to a small number of original sources, each with its own instrument, sample, and parameter choices. Most of the pages repeating those figures have stripped out the context that made them meaningful in the first place. For a side-by-side reliability ranking across more reversal and continuation patterns, see Quantzee's candlestick patterns cheat sheet ranked by reliability. For two related patterns this piece references directly, see the breakdowns of engulfing candles and the tweezer bottom's wick-versus-body tolerance. Two more patterns worth the same treatment are the doji in its three situations and the hanging man, which is a hammer in the wrong place. On whether historical candlestick statistics are a reliable guide at all, the U.S. Securities and Exchange Commission's investor education resources are a useful general caution against treating any historical pattern as predictive. The CMT Association, the professional body for chartered market technicians, publishes broader context on how technical patterns are formally studied as a discipline, going back to work the organization has supported since 1989. As with any historical statistic measured on a fixed sample, past formations are not a forward guarantee, and paper trading a new rule set before committing size is the sensible way to find out how it behaves on the instrument you actually trade.