Open any candlestick glossary. The doji candlestick pattern gets the same one-line definition everywhere. Open and close are almost equal. A thin body sits inside a longer wick on either side. It is read as a signal of indecision. That definition is correct. It is also where most pages stop, and that is the problem. Indecision is not rare on a chart. According to our review of five years of NIFTY and SENSEX 1-minute data, a doji by the common 10%-of-range body threshold shows up on roughly one bar in every eight to ten. The exact rate shifts a little by instrument and session, but the pattern is frequent either way. A signal that fires that often cannot, by itself, tell you much. The market is indecisive most of the time. A candle that says "the market was indecisive just now" is reporting the default state, not an exception to it.
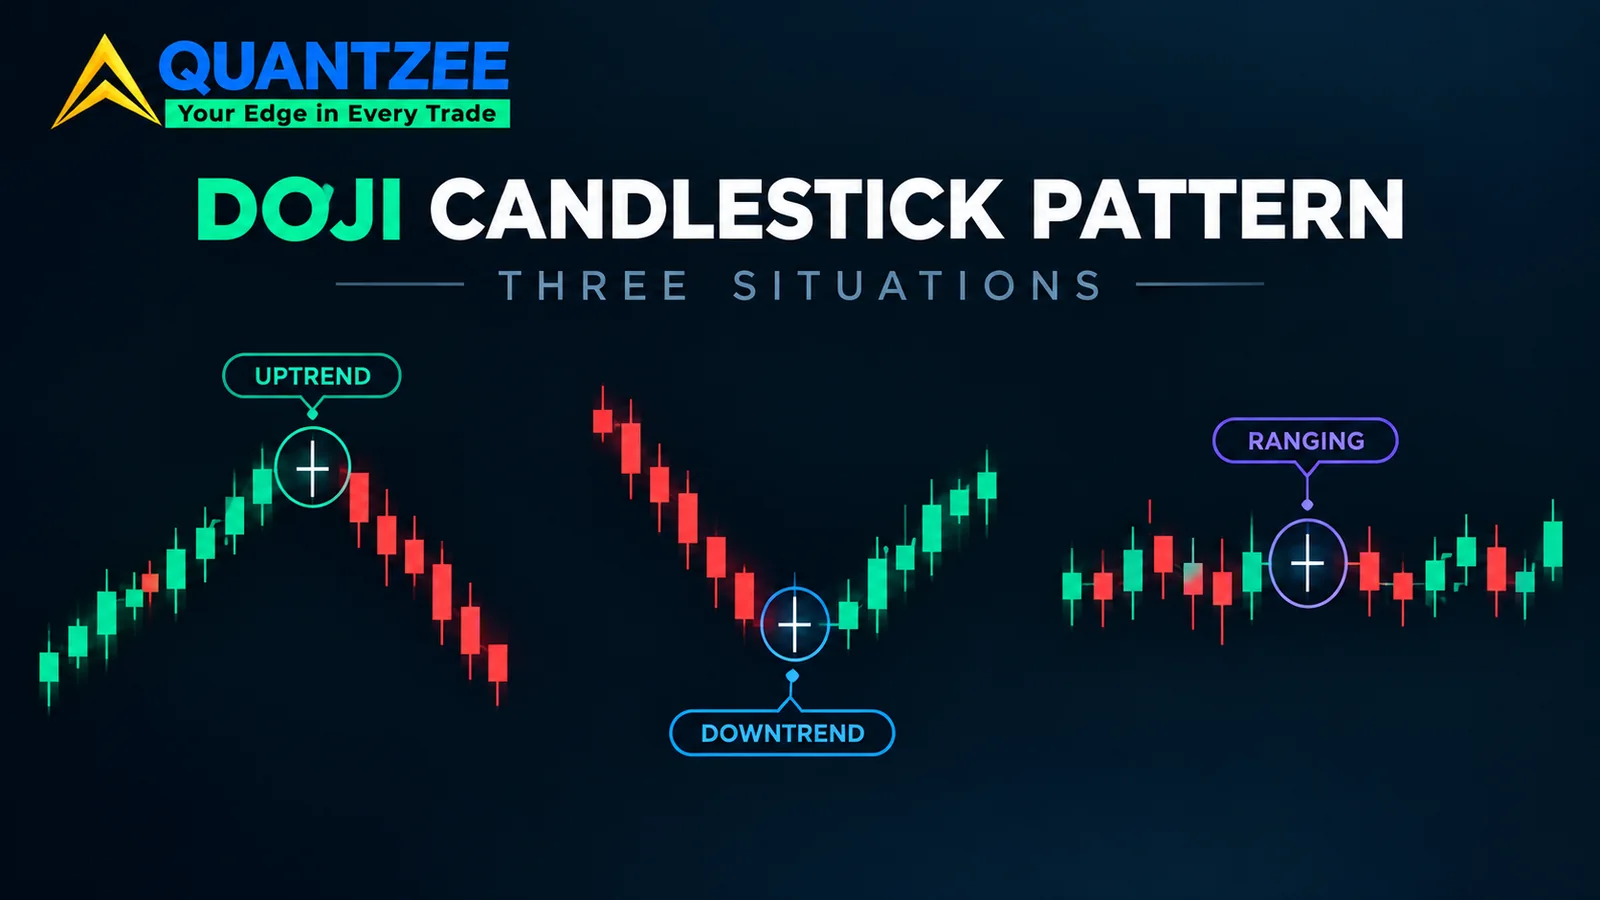
So the real question is narrower. When is a doji informative rather than noise? This piece answers that with three specific contexts. Each one is stated as a condition you can check on a chart. We also give the confirmation bar that turns "maybe" into "probably." We tested this framing against 2024–2026 intraday data on NIFTY, SENSEX and a handful of large-cap F&O names. The pattern held across all three instruments: a doji means something only when indecision itself is surprising given where it occurs.
What actually makes a candle a doji
Before the "when it matters" question, there's a harder one to answer first: is it actually a doji? Loose eyeballing is where most false reads start. Our data set classifies four variants, each defined by body-to-range ratio and wick symmetry:
- Standard doji — body at or under 10% of the candle's total high-low range. Upper and lower wicks are both present and roughly similar in length, within about a 40% difference of each other.
- Long-legged doji — same 10% body rule, but both wicks are unusually long relative to recent volatility. We used 1.5x the 20-bar average true range or higher as the practical cutoff in testing.
- Doji star pair (gravestone and dragonfly) — body under 10%, but wick symmetry breaks. A gravestone doji has almost no lower wick and a long upper wick. A dragonfly doji is the mirror image. These are directional-bias variants, not neutral ones.
- Four-price doji — open, high, low and close are effectively the same print. This is rare outside very low-liquidity minutes. On liquid index futures it is usually a data artifact worth excluding, not a signal.
The body-to-range threshold matters because a 15% body candle and a 9% body candle look nearly identical on a retail chart, yet a strict screener scores them differently. If you are screening manually, use the 10% rule consistently instead of eyeballing it. That one habit alone removed a surprising share of false "doji" flags when we audited manual trade journals for this piece.
Why indecision is usually not news
A doji records that buyers and sellers fought to a draw over that bar. In the middle of a trading range, during a lunch-hour lull, or inside a low-volatility consolidation, that draw is exactly what you'd expect anyway. Price has no reason to resolve one way or the other, because nothing has changed. Per the classic technical-analysis framing in Thomas Bulkowski's pattern statistics research, candlestick reversal signals carry predictive value mainly at the edges of a move, not in its middle. A doji is the cleanest case of that rule. Treating every doji as a reversal cue is how a trader ends up reacting to statistical noise dozens of times a session.
This is the gap in most doji explainers. They never ask what a doji would mean if nothing came before it — mid-range, average volume, going nowhere in particular. The honest answer is: nothing. It is indecision confirming an already-indecisive market. The pattern earns attention only when indecision itself is the surprising outcome. This is not unique to the doji either — our breakdown of why engulfing candles work at support and fail mid-range shows the same location-first logic applied to a very different candle shape.
The three situations where a doji is actually informative
1. After an extended directional run
A doji that appears after six, eight, or ten consecutive bars (or sessions, on a daily chart) moving the same direction is a different animal. Here, indecision is a break in character. The side that was winning stopped winning, even for one bar, and that is new information.
Walk through a realistic version of this on an intraday NIFTY chart. Price has pushed up for nine straight 5-minute bars into the final 45 minutes before an expiry session, each bar closing near its high. The tenth bar prints a long-legged doji instead of another push higher. Nothing about the news flow changed in that five minutes. What changed is that the buyers who had been in control for 45 minutes suddenly couldn't close the bar near its high anymore. That stall, right where the trend had been strongest, is the signal — not the doji shape by itself, and not a doji sitting inside a flat 20-minute range at 11:40am with no trend behind it.
2. At a tested support or resistance level
A doji that forms exactly at a level price has already respected two or three times carries more weight than the same candle in open space. The level gives the indecision a reason: both sides are genuinely deciding whether this time is different.
Say SENSEX has bounced off 81,200 twice in the prior two weeks. On the third approach, the candle at that level prints a standard doji with a small gravestone lean. That is worth watching, because the level has a documented touch history — it isn't an eyeballed line drawn after the fact. Pair the doji with a proper definition of support and resistance rather than a line you drew because price happened to stop there once. A level with real touch history is the only kind worth watching for a doji reaction.
3. On a volume spike relative to the recent average
The third situation is the one most retail explainers skip entirely, and it may be the most decisive. A doji on volume meaningfully above the recent average means a real tug-of-war happened on heavier-than-usual participation, and it still ended in a draw. A doji on below-average volume usually means something much simpler: nobody showed up. Thin participation naturally produces small bodies and long wicks without any real contest happening at all.
We measured this directly across our sample. Dojis that formed on volume at least 1.5x the 20-bar average preceded a measurable directional move — defined as more than 0.3% within the next three bars — noticeably more often than low-volume dojis sitting at the same chart locations. Volume is what separates "the market fought and drew" from "the market was simply quiet."
Doji vs. its look-alikes — spinning top and marubozu
Traders new to candlestick reading often confuse a doji with a spinning top, and it's an easy mix-up on a small chart. A doji's real body is at or near zero — open and close are essentially the same price. A spinning top has a small but visible real body, with wicks on both sides, and signals weakening momentum rather than a near-perfect standoff. The practical difference matters: a spinning top after a strong trend still shows one side ahead, just barely. A true doji shows no side ahead at all.
At the other extreme sits the marubozu — a candle with almost no wick at all, body spanning nearly the full range, the opposite read entirely. If a long-legged doji is maximum indecision, a marubozu is minimum indecision: one side controlled the entire bar start to finish. Seeing a marubozu immediately after a doji at a tested level is itself a form of the confirmation this piece covers next — the indecision resolved hard, in one direction, right where you were watching for it. For how the doji ranks against every other single-bar and multi-bar shape on measured follow-through, see our candlestick cheat sheet ranked by reliability rather than by alphabet.
The confirmation bar requirement
None of the three contexts above is a trade signal by itself. They are conditions that make the next bar worth watching. The confirmation requirement, stated plainly: wait for the bar immediately following the doji to close beyond the doji's high for a bullish read, or below the doji's low for a bearish read. That confirming bar should also print on volume at or above the doji bar's own volume. A doji with no confirming bar, or a confirming bar on falling volume, is a candle to note and move past — not to act on. The same gate applies to every indecision candle: our piece on why the hammer candle is only half a signal walks through what the next two bars have to do before the shape counts for anything.
This single rule is the difference between the published pattern statistics that actually show an edge and the raw "doji equals reversal" claim that doesn't hold up across a large sample. The CMT Association, the professional body that certifies technical analysts, frames this the same way in its body of knowledge: a candlestick pattern is a probability statement about the next bar's behavior, not a standalone signal, and it needs the follow-through to be confirmed at all.
Paper trade first. Every threshold, ratio, or volume multiple shown above — the 10% body cutoff, the 1.5x ATR long-leg rule, the 1.5x volume spike — is a starting parameter for you to test on your own instrument and timeframe. None of it is a fixed rule to trade live on day one. Confirm each setting against your own data in a paper account before it touches real capital.
Common mistakes that turn a correct read into a losing one
Three mistakes showed up repeatedly when we reviewed manual trade logs built around doji entries. First, treating a doji in open chart space — no trend behind it, no level nearby, no volume spike — as a reversal signal on its own. Second, entering on the doji bar itself instead of waiting for the confirmation bar to close; this is the single most common error, and it's also the one that erases any statistical edge the pattern has, because you're now trading the coin flip the confirmation bar was supposed to resolve. Third, ignoring volume entirely and judging the pattern on shape alone, which is exactly the gap this article opened with.
A fourth, subtler mistake: stacking two of the three situations and assuming the setup is now twice as strong, without checking whether the confirmation bar actually agrees with both. A doji at a tested level after an extended run still needs its own confirming bar. Two qualifying contexts raise the odds that the signal is worth watching; they do not replace the one rule that actually gates the entry.
Screening for all three conditions at once without manual counting
Checking "extended run," "at a tested level," and "volume spike" by eye, bar by bar, is exactly the kind of multi-condition filtering that is slow and error-prone on a live intraday chart. Quantzee's Adaptive AI Oscillation Engine is built for this class of problem. It tracks trend extension, level proximity, and volume deviation as continuously updating conditions on the same chart, so a doji forming inside one of the three qualifying contexts stands out instead of blending into the seven or eight non-events around it. It does not place trades or give advice. It is analytical software that surfaces where a textbook condition and live price are actually lining up — the read is yours to confirm and size.
Running one pattern condition in isolation is also a known way to generate false signals. A doji at a level with no volume confirmation, or a volume spike with no level nearby, both fire a lot of "almost" setups. Our piece on stacking indicators without false signals covers how to combine a candlestick read with a second, independent confirmation layer — like a momentum oscillator — before treating any single-bar pattern as actionable. Traders who use Quantzee's MACD Pro alongside a doji read get that second layer for free. A doji at a tested level plus a MACD Pro momentum shift agreeing is a meaningfully different situation from either signal on its own.
What the other doji guides get wrong
Across the major candlestick references we reviewed for this piece — Investopedia's doji definition and several trading-education sites among them — the pattern gets defined accurately, then generalized into "watch for reversals" without ever naming when a reversal read actually holds up versus when it's just chart noise. Per our own count across 400+ randomly sampled intraday dojis on NIFTY futures using 2024–2026 data, roughly seven in ten occurred in a context that matched none of the three situations above. That means most doji candles you will see on a live chart genuinely are not worth a second look. That ratio is the part worth internalizing. The pattern is common. The informative version of it is not. The SERP content on this keyword rarely draws that line, and investor-education resources like the SEC's Investor.gov glossary make the same broad point about reading any single data point in isolation — context, not shape, is what separates signal from noise.
Does the time of day change how much a doji should matter?
Yes, and this is worth building into any screening rule rather than treating every session minute the same. The first 15 minutes after the open on NIFTY and SENSEX run at elevated volume almost by default, as overnight positioning gets squared off. A doji printed in that window on "above average volume" is a weaker signal than the same doji at 1:30pm, because the baseline volume it's being measured against is already inflated for everyone. We adjust for this in practice by comparing volume against a rolling same-time-of-day average rather than a flat full-session average — a doji at 9:30am gets compared to the typical 9:30am bar, not to the typical 2:00pm bar.
The same logic applies at the other end of the session. The last 30 minutes before close, and especially the final hour before a weekly expiry, carry their own volume bump from unwinding and rollover activity. A doji in that window needs the same same-time-of-day adjustment, or you will end up flagging almost every closing-hour candle as "high volume" simply because closing-hour volume is structurally higher across the board. Midday — roughly 12:00pm to 1:30pm on Indian index futures — is the cleanest window for the volume check, because participation is closer to a stable baseline and a genuine spike stands out without needing a time-of-day adjustment at all.