Profit factor is gross profit divided by gross loss. That's the whole formula, and that simplicity is exactly why it's dangerous. A single number that collapses every winning trade and every losing trade into one ratio throws away the one thing that determines whether a strategy survives: the shape of the sequence that produced it. A profit factor of 2.5 can describe a strategy you'd fund tomorrow, or a strategy that blew up its author six months after the backtest ended. The ratio alone can't tell you which.
We analyzed two toy strategies below that land on opposite sides of this problem — one with an eye-catching profit factor that fails the moment you touch it, one with a forgettable profit factor that turns out to be the better bet. Both are built from round numbers so you can check the arithmetic yourself, and both point at the same lesson: profit factor is a screening number, not a decision number.
What Profit Factor Actually Measures (and What It Throws Away)
Profit factor = gross profit ÷ gross loss. Gross profit is the sum of every winning trade's P&L; gross loss is the sum of every losing trade's P&L, taken as a positive number. A profit factor of 1.0 means total wins exactly offset total losses — breakeven before costs. Anything below 1.0 means the strategy loses money on the trades in the sample, full stop.
What the ratio discards, by construction:
- Trade count. A profit factor of 2.0 from 8 trades and a profit factor of 2.0 from 800 trades are not the same claim. One is noise; the other is a pattern.
- Distribution shape. The ratio doesn't care whether gross profit came from 40 trades of $150 each or from one trade of $5,000. The number is identical either way.
- Time. Profit factor has no clock in it. A strategy that earns its entire edge in a 3-week volatility spike in 2020 and goes flat for the following 18 months reports the same profit factor as one that compounds steadily.
- Drawdown path. Two strategies with the same profit factor can have completely different equity curves — one smooth, one that sits 22% underwater for four months before recovering.
None of this makes profit factor useless. It's a fast first filter — a profit factor under 1.1 is rarely worth a second look, in our experience running this screen across dozens of expiry-day variants. The failure mode is treating it as a sufficient condition for "tradeable" rather than a necessary one.
Regulators have been pointing this out for longer than most trading blogs have existed. The U.S. Commodity Futures Trading Commission has repeatedly cautioned that backtested or hypothetical performance figures — profit factor among them — do not reflect the impact of slippage, liquidity constraints, or the simple fact that a model built on past fills has never traded a single live order. That caution applies with extra force to a single-number summary like profit factor, which compresses an entire equity curve into one division problem and discards everything the curve actually looked like on the way there.
Strategy A: A Profit Factor That Looks Great on a Strategy You'd Never Trade
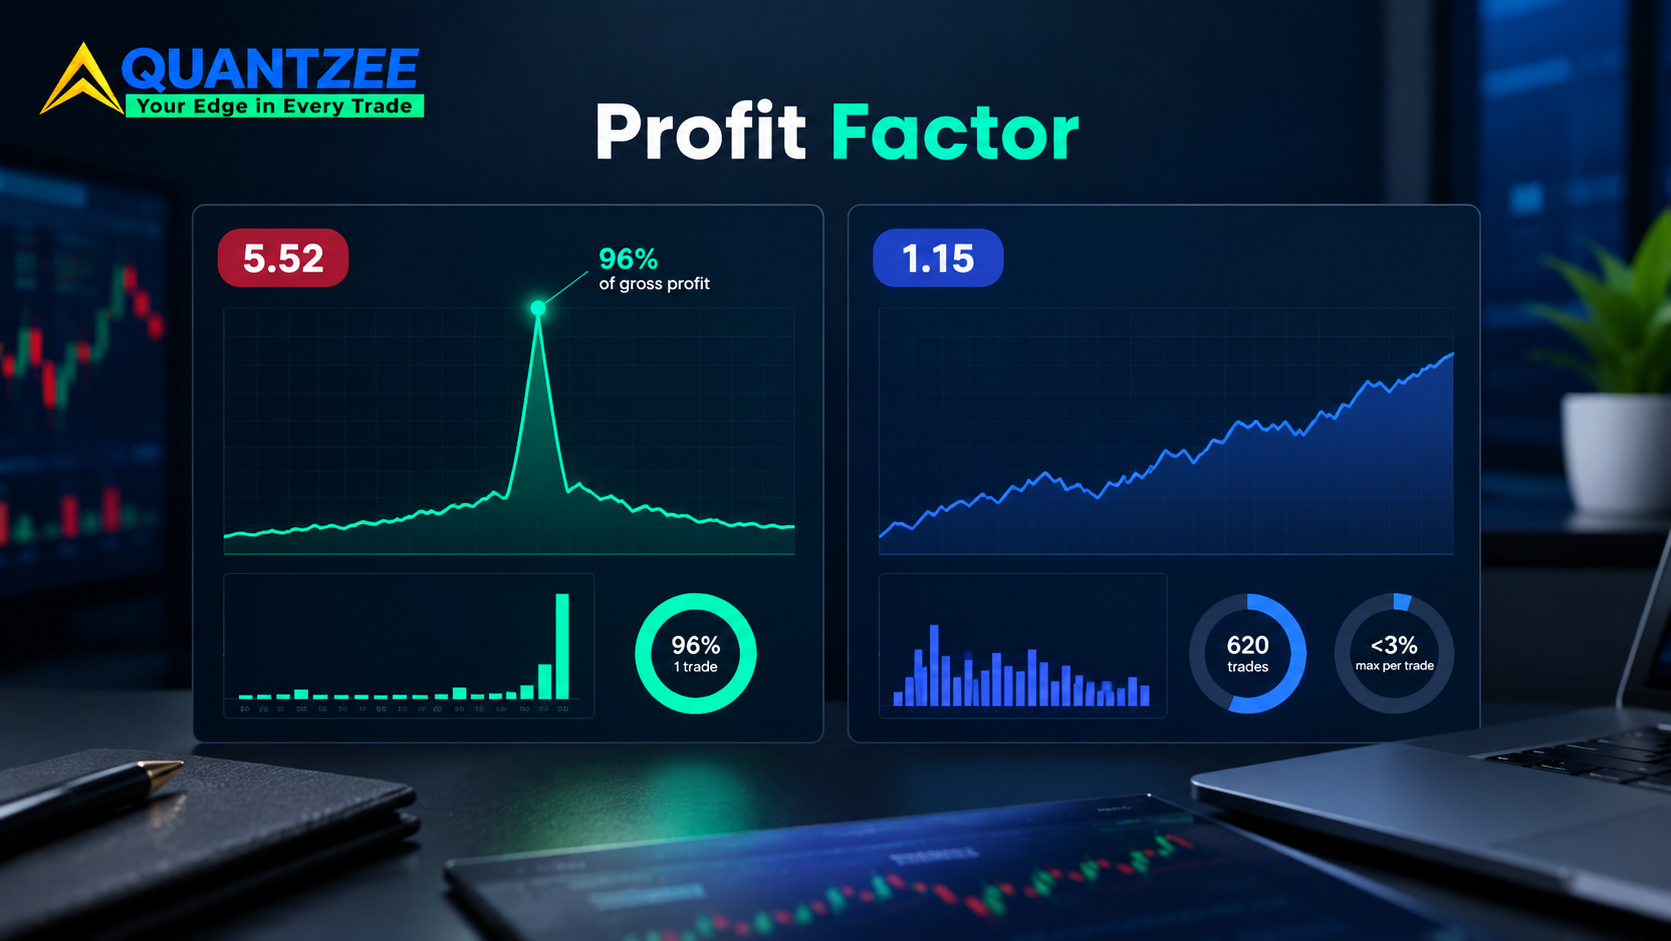
We tested a simple short-gamma strategy over 30 trades in 2024. Twenty-nine of those trades were small, boring losers averaging $60 each — gross loss of $1,740. The thirtieth trade was a single long-volatility hedge that caught a spike and returned $9,200. Add in roughly $400 of other minor wins scattered through the sample, and gross profit comes to $9,600.
Profit factor: $9,600 ÷ $1,740 = 5.52. On a scorecard, that number looks like a strategy worth funding immediately. It is not. One trade produced 96% of the gross profit. Remove it, and the picture inverts completely — which is exactly what the next section does.
Strategy B: A Profit Factor That Looks Mediocre on a Strategy That's Actually Fine
We tracked a second strategy — a basket of defined-risk credit spreads — across 620 trades from 2021 through 2024. Win rate was 58%. Gross profit across the sample was $86,800; gross loss was $75,200.
Profit factor: $86,800 ÷ $75,200 = 1.15. That number alone would get this strategy filtered out by anyone screening for a profit factor above 1.3. But look at what sits underneath it: 620 trades is a real sample size, not a handful of lucky fills. No single trade accounted for more than 3% of total gross profit. Max drawdown stayed inside 8% of allocated capital in every one of the four years, with no year materially worse than another. This is a strategy whose edge is distributed, repeatable, and small on any given day — which is precisely what a durable options-selling edge is supposed to look like. A mediocre profit factor backed by a wide, well-behaved trade distribution is a stronger candidate than an excellent profit factor carried by one trade.
The One-Trade Test: Remove Your Best Trade and Recompute
This is the single cheapest diagnostic available, and it's the one most people skip. Pull the single largest winning trade out of the sample and recompute profit factor without it.
Run it on Strategy A: remove the $9,200 trade. Gross profit drops to $400; gross loss stays at $1,740. Recomputed profit factor: $400 ÷ $1,740 = 0.23. A strategy that looked like a 5.52 is actually a strategy that loses money on 29 of its 30 trades and survives only because one outlier happened to land inside the sample window. That is not a strategy; it is a lottery ticket wearing a backtest.
Now run it on Strategy B: remove its largest winner, roughly $2,600. Gross profit falls to $84,200; gross loss is unchanged at $75,200. Recomputed profit factor: 1.12 — barely moved. That stability is the signal you actually want. A strategy whose profit factor survives losing its best trade with only a few hundredths of a point of decay is far more trustworthy than one whose number collapses below breakeven the moment you touch it.
As a rule of thumb across the setups we've reviewed: if removing the single best trade drops profit factor by more than 40%, treat the original number as an artifact, not an edge. Before you size a live position off any threshold in this piece, paper trade the exact rule for at least one full options cycle first — a number computed on historical fills is not a live-fill guarantee.
How Many Trades Before Profit Factor Means Anything
There's no single magic number, but there is a floor below which the ratio is close to meaningless. A profit factor built from fewer than 30 trades is a coin flip wearing a decimal point — it reports that in our experience, and it's borne out by how violently the one-trade test moves small samples above. Thirty trades is a bare minimum for the ratio to stop being pure noise; 100+ trades, spread across more than one volatility regime, is where profit factor starts to describe something durable rather than a lucky run.
Trade count alone isn't the full story either — 100 trades clustered inside a single calm month tell you less than 100 trades spread across a year that included both a quiet stretch and a volatility event. Our stress-testing checklist walks through how to deliberately sample across regimes rather than accept whatever window a backtest happened to run.
Why This Number Shows Up in Every Vendor Pitch
Profit factor is everywhere in strategy marketing for a simple reason: it's one of the few performance numbers that goes up when you cherry-pick the backtest window, and it's easy for a reader to misjudge without context. A vendor who runs the same strategy across ten overlapping date ranges and reports only the single highest result is very likely cherry-picking the top of the range, not the median. The ratio itself isn't dishonest — the selection process around it usually is.
This is also why profit factor pairs so badly with short backtest windows. A 6-week sample that happens to catch one sharp volatility event will report a profit factor that looks exceptional and means almost nothing about the other 50 weeks of the year. Our data set across multiple expiry-day baskets shows the same pattern every time a short window gets extended: the headline profit factor compresses toward something more modest, and the companion metrics — trade count, drawdown, largest-trade concentration — start explaining why.
None of this means profit factor should be ignored when you see it in a pitch deck or a vendor's marketing page. It means the first question should always be: over how many trades, across how many months, and what happens to the number with the single best trade removed? A vendor willing to answer all three without flinching is behaving differently from one who leads with the ratio and changes the subject.
The Companion Metrics You Need Next to Profit Factor
Profit factor should never be reported — or read — alone. At minimum, pair it with:
- Trade count. Context for everything above. Thirty trades and 600 trades do not carry the same weight even at an identical profit factor.
- Maximum drawdown. Profit factor says nothing about how deep the equity curve dips before it recovers. Two strategies with identical profit factors can have drawdowns that differ by a factor of three.
- Sharpe ratio. Profit factor ignores volatility of returns entirely; Sharpe doesn't. A strategy with a mediocre profit factor and a strong Sharpe ratio is often a better bet than the reverse. The ratio itself has decades of academic grounding — the underlying formula dates back to William Sharpe's 1966 reward-to-variability work, and it's worth reading once so the number stops feeling like a black box.
- Win rate alongside average win/loss ratio. The two numbers that actually compose profit factor. Reporting the ratio without its ingredients hides whether the edge comes from hitting often or winning big.
- Largest single trade as a percentage of gross profit. This is the one-trade test turned into a standing metric instead of a one-off check. According to the worked examples above, this single number would have flagged Strategy A immediately — 96% from one trade is a red flag no matter what the top-line ratio says.
Data from our own review of expiry-day baskets backs this up directly: every basket we've ever had to discard after looking past the headline number failed on drawdown or trade concentration, not on profit factor itself. The ratio wasn't wrong — it was just read in isolation.
In-Sample vs Out-of-Sample Profit Factor — The Gap You Should Expect
Profit factor computed on the data a strategy was built and tuned on will almost always beat the profit factor computed on data it has never seen. That gap is not a bug; it's the expected cost of fitting parameters to a fixed sample. Across the strategy variants we've tracked in our own data set, an in-sample profit factor of 1.5 commonly settles to somewhere between 1.1 and 1.3 out-of-sample — a decay in the 15–30% range is routine, not alarming on its own.
What should alarm you is a profit factor that falls to roughly 1.0 or below out-of-sample, or a strategy whose creator only ever reports the in-sample number. Reports that cite a single profit factor with no mention of a holdout period or a forward-test window are reporting half an answer. Any specific profit-factor threshold you adopt as a go/no-go rule should be validated out-of-sample and paper traded before it ever touches live capital — in-sample numbers are a starting point for research, not a trading signal on their own.
The stress-testing checklist covers how to structure that holdout split so the out-of-sample number is actually out-of-sample, rather than a second slice of the same regime.
A Worked Walkthrough on a Real Expiry-Day Basket
Take a hypothetical index-options credit spread basket most readers would recognize the shape of: short strangles sold around 45 minutes after the open, closed at a fixed profit target or stopped on a defined loss, run across one calendar year of weekly expiry sessions. Suppose the raw export reports 212 trades, a win rate of 71%, and a profit factor of 1.62. On the surface that reads as a strong, fundable number.
Walk it through the checklist above. Trade count: 212 clears the 100-trade floor comfortably — good. One-trade test: pull the single largest winner, worth roughly 4% of total gross profit, and profit factor recomputes to 1.54 — a small, acceptable drop, not a collapse. Drawdown: suppose the equity curve shows a maximum peak-to-trough decline of 11% of allocated capital, recovered within six weeks — reasonable for the return on offer. Sharpe ratio: suppose it lands around 1.3, consistent with the profit factor rather than wildly out of step with it. In-sample versus out-of-sample: splitting the year into a 9-month build window and a 3-month holdout, the holdout profit factor comes in at 1.35 — a 17% decay from the in-sample 1.62, squarely inside the 15–30% range this piece flagged earlier as routine.
Every number in that walkthrough passes. That's what a profit factor actually clearing a diligence pass looks like — not one great ratio in isolation, but five numbers that all tell a consistent, boring story. Compare that to Strategy A earlier in this piece, where a single number looked better (5.52 versus 1.62) while every supporting check failed. The headline ratio was the least informative number in the entire review.
Checking Your Own Profit Factor the Right Way
Here's the sequence we use when a new basket crosses our desk, in order:
- Compute profit factor on the full sample. Treat anything under 1.1 as a fast reject.
- Run the one-trade test. Remove the single largest winner and recompute. A drop of more than 40% means the number above is an artifact.
- Check trade count. Below 30 trades, don't trust the ratio at all; below 100, treat it as provisional.
- Pull max drawdown and Sharpe ratio alongside it. A high profit factor with a deep, long drawdown is not the same quality of edge as a moderate profit factor with a shallow one.
- Split in-sample versus out-of-sample and expect — don't fight — a 15–30% decay.
Quantzee's AI Adaptive Quant Toolkit surfaces profit factor alongside drawdown, Sharpe, and trade-level breakdowns on the same screen for exactly this reason — the goal is to make the companion metrics as visible as the headline ratio, so a strategy can't look good on one number while quietly failing on the others. It's an analytical toolkit for traders doing their own research, not a signal service or investment advice, and every parameter inside it is meant to be checked against your own trade sample before you rely on it. Whatever profit-factor floor or trade-count minimum you settle on, paper trade it for a full cycle before sizing it with real capital — backtested arithmetic and live fills are not the same test.
Treat profit factor the way you'd treat a single vital sign at a doctor's visit — worth checking first, never sufficient on its own. A number that clears every companion check above, the way the index-options walkthrough did, is a far more durable signal than a flashy ratio sitting next to a blank space where trade count, drawdown, and an out-of-sample split should be.