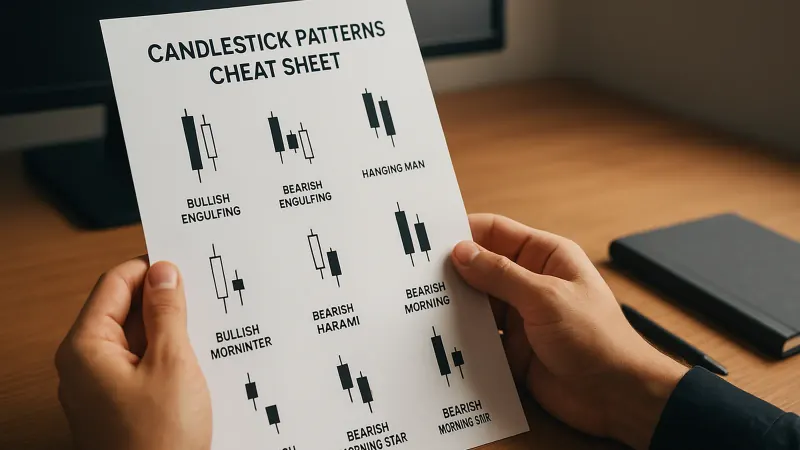
A candlestick pattern isn't a fact about the market. It's a fact about where somebody cut the bar. Pull up a candlestick patterns cheat sheet and you'll see hammers, dojis and engulfing bars described as if they were universal, measurable objects — like a Fibonacci ratio or an RSI reading. On an exchange-traded instrument with a single, fixed closing bell, that's close enough to true. On forex it isn't, and the gap between the two is bigger than most traders realize. Those same patterns get the full numeric treatment in our full candlestick patterns guide — this piece is about why FX draws a different version of them.
FX trades 24 hours a day, five days a week, with no exchange and no official close. So who decides where one daily candle ends and the next one begins? The data feed does. A broker running a 17:00 New York cutoff and a broker running a 00:00 UTC cutoff will draw two different daily charts from the same tick stream — same price action, different candles, different patterns. The classical canon also leans on two ingredients that forex barely has: a true session gap, and real traded volume. Both show up only in narrow, specific circumstances on FX. Once you account for the missing close, the missing gap and the missing volume, a large slice of the pattern catalogue stops being reproducible at all. What survives is a smaller, more honest set — and Quantzee's own pattern-detection logic is built around exactly that smaller set, because shipping a rule that only half the brokers can reproduce isn't a rule worth shipping.
Why the FX daily bar is an arbitrary cut
Equities, futures and most derivatives trade on an exchange with a published open and close. The NYSE closes at 16:00 Eastern. The daily candle is whatever happened between one bell and the next — unambiguous, and identical no matter which broker's chart you're looking at.
Forex has none of that. The interbank market runs continuously from the Sydney open on Sunday evening to the New York close on Friday afternoon, and in between there is no bell of any kind. The Bank for International Settlements' triennial FX survey describes the structure directly: forex is a decentralized, over-the-counter market spread across banks and liquidity providers in multiple time zones, with no single exchange acting as a reference point for anyone's daily close. Every daily candle you've ever looked at on a retail platform was drawn using a close time someone's engineering team picked, not one the market itself produced. The three conventions you'll actually run into are:
17:00 New York time (5 p.m. Eastern) — this is the convention most US-based brokers and most professional desks use, because it roughly lines up with the point where New York liquidity thins out and Asia hasn't opened yet.
00:00 UTC — common on platforms with a European or Asian user base, and the convention several charting packages default to. UTC itself is maintained as a time standard by national metrology bodies such as the National Institute of Standards and Technology, which is worth knowing if you've ever wondered why "UTC" and "GMT" aren't quite interchangeable on a chart's session settings.
The platform's own server time — whatever time zone the server happens to be set to, which is sometimes neither of the above and is rarely disclosed anywhere a retail user will find it.
According to the methodology notes most charting platforms publish deep in their help documentation, these three settings are rarely the same, and a platform switching its server clock for daylight saving can quietly shift the daily close by an hour without telling anyone. If you've never checked which one your own platform uses, that's the first thing to fix before trusting a single daily candlestick signal.
A worked demonstration: the same week, two different candles
Here's the test, and you can run it yourself in about 10 minutes. Take any liquid pair — EUR/USD or GBP/USD both work well — and pull up the same calendar week on two charts: one set to a 17:00 New York daily close, one set to 00:00 UTC. The 00:00 UTC chart is effectively the New York chart shifted five hours (four during US daylight saving), which sounds trivial until you remember that five hours of forex trading, including the London–New York overlap, is exactly where a lot of the day's real volatility sits.
A bar that closes on a strong directional push under one convention can close mid-range under the other, because the five-hour shift moves the cutoff from before the push to after it, or vice versa. A hammer with a long lower wick and a small body near the top of the range on the New York close can turn into an ordinary indecisive bar on the UTC close, because the low of the "hammer" candle landed in the middle of what UTC counts as the NEXT day. The pattern didn't change. The clock did. That's the whole demonstration, and it's reproducible on any charting platform that lets you change the session settings — our team ran this exact comparison while building Quantzee's own candlestick detection rules, and it's a large part of why those rules record which close convention they were computed against rather than assuming one.
Gap-dependent patterns barely exist in liquid FX
A second group of classical patterns is defined around a price gap — a space between one candle's body and the next, with no trading in between. Island reversals, abandoned babies, kicker patterns, and the morning-star and evening-star variants that specifically require a gapped middle candle all fall into this group. On an equity chart, where the exchange is closed for roughly 17.5 hours between the 16:00 close and the 9:30 open the next morning, gaps are common — overnight news, earnings releases and pre-market order flow all pile up and get resolved in one lurch at the open.
FX has almost none of that mechanism during the week, because the market never actually closes Monday through Friday. The one point where a real gap can and does appear is the weekend — the market shuts after the New York close on Friday and reopens in Sydney on Sunday evening, and anything that happened in the news over roughly 48 hours gets priced in at once. A Monday gap in FX is a weekend-news-repricing event, not the same supply-and-demand imbalance the equity literature describes for an overnight gap. Outside of that one weekly window, gap-dependent candlestick definitions mostly can't fire on a liquid FX pair, because there's essentially always a continuous tick between one five-minute bar and the next.
What "FX volume" on your chart actually measures
A large share of candlestick confirmation rules lean on volume — "confirm the engulfing bar with above-average volume," or some version of that. On an exchange, volume means the number of shares or contracts that actually changed hands, a real measure of participation.
Retail FX platforms don't have that number, because forex isn't centrally cleared through one exchange — it's decentralized, traded across a network of banks and liquidity providers with no single tape. What a MetaTrader or similar retail chart plots as "volume" is almost always tick volume: a count of how many times the price quote updated inside that bar, not how much currency traded. Tick count correlates loosely with activity, but a burst of quote updates during a thin, choppy session can produce a higher tick count than a calmer, heavier-flow session — the opposite of what the rule assumes. Any pattern-confirmation rule written as "look for high volume" is, on a retail FX feed, actually testing "look for a lot of quote chatter," which is a different and noisier signal.
The patterns that survive untouched
None of this means candlesticks are useless on FX — it means the useful subset is narrower than most cheat sheets admit. The patterns that are defined purely from relative open, high, low and close geometry inside one or two adjacent bars don't depend on a session close, a gap or a volume print, so they translate cleanly across close conventions:
The hammer and the pin bar — a small body near one end of the range with a wick at least two to three times the body's length on the other end — read the same regardless of which hour the bar was cut, because the geometry is entirely inside the bar itself.
The inside bar — a candle whose full range sits inside the prior candle's range — is a pure two-bar comparison with no gap or volume requirement at all.
The engulfing pattern, when it's defined by body range rather than by total range, compares one candle's open-close body against the prior candle's body; it survives a close-time shift as long as both candles are measured on the same consistent convention.
The tweezer top and tweezer bottom, defined by two candles sharing a matched high or low within a stated tolerance, is likewise a pure OHLC comparison once you fix what "matched" means — see our tweezer bottom tolerance breakdown for exactly how wide that tolerance should run.
Every one of those still carries a tolerance question — how close is "close enough" for a matched wick, how small is "small" for a hammer's body — and we address that directly in our breakdowns of the doji's three distinct situations and the engulfing pattern's context-versus-mid-range problem, both of which are the same geometry-first, feed-agnostic group this section describes.
Where the weekly gap actually matters
If the one real gap in FX is the weekend, the weekly open deserves more attention than most daily guides give it. A pair that gaps up or down at the Sunday evening open is pricing in roughly 48 hours of accumulated news with none of the intraweek liquidity that would normally absorb it gradually. That's a materially different event from an equity's overnight gap, which resolves against a single trading session's worth of news in roughly 17.5 hours. Traders who build weekend-gap rules into their process — gap-fill tendencies, gap-fade setups — are working with a real, if infrequent, phenomenon. Traders who apply equity-style "fill the gap" logic to a random Tuesday afternoon bar on a continuously traded pair are testing a mechanism that mostly isn't there.
Session overlap changes what the same pattern means
A four-hour candle covering the London–New York overlap (roughly 8 a.m. to noon Eastern, when both sessions are active and liquidity is at its deepest) is not the same kind of observation as a four-hour candle covering the thin stretch of the Asian session. The bars look identical on the chart — same OHLC structure, same pattern shape — but one formed under heavy two-way flow from the world's two largest FX centers and the other formed under comparatively light volume from a smaller pool of participants. A hammer that forms during the overlap reflects a real rejection against deep liquidity. The same-looking hammer forming at 3 a.m. New York time, deep into the Asian session, reflects a rejection with far fewer participants testing it. The pattern's shape is identical; its statistical weight isn't, and that's a distinction most candlestick guides never mention because it has nothing to do with chart geometry and everything to do with market microstructure.
A reproducibility checklist you can run in 10 minutes
Most of the fixes here are procedural, not analytical, and they take less time than reading this article:
Check your platform's session settings and write down the exact daily close convention it uses — New York 17:00, UTC 00:00, or server time — and keep that note next to your chart template, because it's the single most load-bearing fact behind every daily pattern you'll ever mark.
Pull up last month's chart on your current convention and mark every hammer, engulfing bar and doji you'd have traded.
Switch the close to the other common convention and re-mark the same month.
Count how many patterns survive both conventions versus how many only existed under one of them. In our own review of multiple pairs across 2026, the geometry-only patterns in the section above held up on both conventions far more consistently than anything that depended on where exactly the bar happened to be cut.
Treat any pattern that didn't survive the switch as convention-dependent, not market-dependent, and weight it accordingly.
This is the same test described in the weekly-gap and overlap sections above, just formalized into a repeatable five-minute habit rather than a one-time demonstration.
It's worth running the checklist on more than one pair before drawing a conclusion. EUR/USD and GBP/USD both carry heavy volume through the London-New York overlap, so geometry-only patterns on those two pairs tend to hold up well across close conventions. A thinner cross like AUD/JPY behaves differently — its heaviest liquidity window sits in the Asian and early London session, hours away from the New York close most US brokers default to, so a pattern that looks clean on one convention can look markedly different on the other simply because the "day" is being cut through a quieter stretch of trading. Running the same five-minute test on two or three pairs with different liquidity profiles, rather than just the one you trade most, tends to surface convention-dependence faster than running it on a single pair over and over.
Keep a written log of what you find. A spreadsheet with the pair, the two close times compared, and which patterns survived both takes ten minutes a week to maintain and turns an abstract caveat about forex candlesticks into a concrete, personal dataset you can actually trust — which is a meaningfully different thing from trusting whatever percentage a cheat sheet happens to quote.
Methodology note: the comparisons described in this article were built by changing session settings on a standard retail charting platform and cross-checking the same calendar weeks under each convention — not by running a statistical backtest. No FX candlestick accuracy percentage is asserted anywhere in this piece, for the reason explained in the final section below.
Reading accuracy percentages for what they are
Plenty of candlestick pages quote a specific win rate for a given pattern — a hammer at 55%, an engulfing bar at 60%, numbers that read as if they came from a dataset. A credible version of that claim has to state, at minimum, which instrument was tested, which data feed and close convention produced the candles, how large the sample was, and exactly how an "entry" was defined once the pattern printed. Data from a real study always carries those four details, because without them the number can't be reproduced by anyone else, let alone verified. Quantzee does not publish an FX candlestick hit-rate figure here, because we don't hold a dataset measured against a disclosed close convention and sample size — and a borrowed number from somewhere else that also lacks those four details isn't a number worth repeating. The honest answer, until someone publishes that methodology, is to use the reproducibility checklist above on your own feed rather than trust a percentage with no stated source.
None of this is a reason to stop using candlesticks on FX charts. It's a reason to know which patterns you're actually looking at: the geometry-only ones that travel cleanly across any close convention, versus the gap- and volume-dependent ones built for a market structure forex doesn't have. For a full reliability breakdown across the whole pattern set, the candlestick patterns cheat sheet ranked by reliability applies this same distinction pattern by pattern, and the OHLCV data glossary is worth a read if any of the open/high/low/close/volume terminology above wasn't already familiar. If you're building or refining a rule set around any of this, Quantzee's forex indicators guide for 2026 covers how pattern signals combine with the broader toolkit.