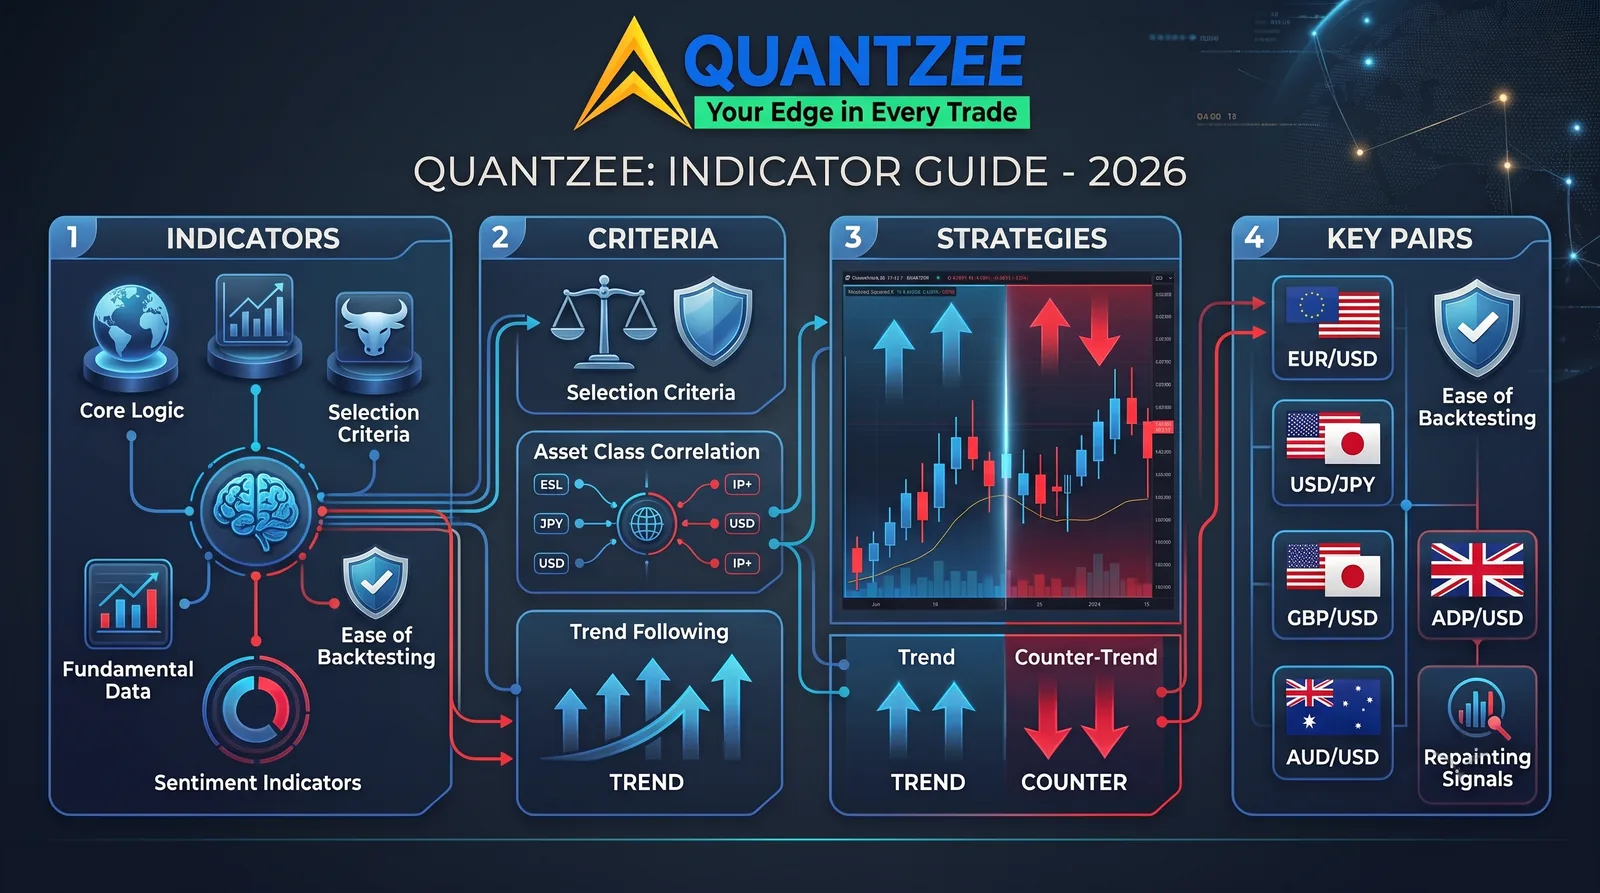
Search “best forex indicators” and you’ll get a wall of articles that are quietly written for one country. The broker list is local. The example pairs are whatever the author’s home currency trades against. The “best time to trade” section assumes you’re awake for the London open. And the settings recommended are tuned — usually without saying so — to one session’s volatility profile.
Forex is the single most genuinely global market there is. It runs roughly 24 hours a day across five trading days, it has no central exchange, and according to the Bank for International Settlements Triennial Survey it turns over trillions of dollars daily across venues spread from Sydney to New York. A guide to forex indicators that only works if you’re sitting in one timezone with one broker isn’t a guide — it’s a local listing with a global title.
This article is the opposite. It covers the indicator families that matter for currency trading in 2026, how each one actually behaves as liquidity rolls from Asia into London into New York, what “non-repainting” means specifically in a forex context, and how to combine three or four tools into a coherent setup without generating a signal every candle. Nothing here depends on your country, your broker, or your account currency.
⚡ Key Takeaways
- Forex indicators don't have one "best" setting — the same tool behaves differently in the low-liquidity Asian session than it does during the London/New York overlap, and your settings should acknowledge that
- Volume-based indicators are structurally weaker in spot forex than in stocks or crypto, because there is no central exchange reporting true volume — what your chart shows is tick volume from one broker's feed
- The four families worth building around are trend, momentum, volatility, and structure — one from each, not four from the same family, is the practical rule for avoiding correlated false confidence
- Non-repainting matters more in forex than almost anywhere else, because the 24-hour session means "the candle closed" is ambiguous and repainting tools quietly rewrite their own history across session boundaries
- Spread and swap costs — not indicator choice — are what kill most short-timeframe forex strategies, and they must be modelled into any backtest before an indicator setup is judged
A note before we go further: this article is educational content about how technical indicators behave in currency markets. It is analytical software commentary, not investment advice, and nothing here is a recommendation to buy or sell any currency pair. Trading forex carries substantial risk, including the risk of losing more than your initial deposit on leveraged accounts. Past performance — real or backtested — does not guarantee future results.
Why “geo-locked” forex advice fails
Three specific things break when a forex indicator guide assumes a single location.
1. Session volatility isn’t constant. A 14-period ATR reading on EUR/USD during the Tokyo session and the same reading during the London/New York overlap describe two different markets. Stop distances, breakout thresholds and volatility filters calibrated to one will misfire in the other. An article that recommends “use a 1.5x ATR stop” without asking when you trade has skipped the most important variable.
2. Pair selection is timezone-dependent, not preference-dependent. AUD/JPY and NZD/USD are meaningfully more active during Asian hours; EUR/GBP and EUR/CHF come alive in the European session; USD/CAD and the dollar majors get their sharpest moves around New York data releases. If you can only realistically trade a four-hour window, the right pairs for you are the ones that are liquid in that window — not the ones a writer in another hemisphere happens to favour.
3. Broker execution differs, and indicators inherit that. Spot forex has no consolidated tape. Your broker’s feed, your broker’s spreads, and your broker’s server timezone all shape what your indicator computes. Two traders running an identical setup on the same pair, with different brokers, can see candles that close at different prices and daily bars that open at different times.
None of this makes indicators useless. It means the useful question isn’t “which indicator is best” but “which indicator family answers which question, and how do I calibrate it to the session I actually trade?”
The four indicator families that matter
Every technical indicator worth putting on a forex chart answers one of four questions. Stacking four tools that all answer the same question is the single most common mistake retail traders make — we covered the mechanics of that in how to stack indicators without drowning in false signals, and it applies with particular force in currencies.
| Family | Question it answers | Typical tools | Forex-specific caveat |
|---|---|---|---|
| Trend | Which direction is the dominant flow? | Moving averages, EMA ribbons, SuperTrend, ADX | Ranges are common in FX; trend tools whipsaw badly in the Asian session |
| Momentum | How strong is the current move, and is it fading? | RSI, MACD, Stochastic, rate-of-change | Divergence signals need a trend filter or they fire endlessly in ranges |
| Volatility | How much movement should I expect right now? | ATR, Bollinger Bands, Keltner Channels | The most session-sensitive family — recalibrate by trading window |
| Structure | Where are the levels that matter? | Support/resistance, VWAP, pivots, order blocks, SMC tooling | Daily pivots depend on your broker’s server-day cutoff |
The practical rule: one primary tool from each family, maximum. A trend filter, a momentum trigger, a volatility gate for sizing and stops, and a structural level for context. Four indicators, four independent questions. Adding a second RSI-style oscillator alongside your first doesn’t add information — it adds the illusion of confirmation, because both tools are derived from the same price series in nearly the same way.
Family 1: Trend indicators — the backbone, with a range problem
Currencies trend. When they do — a central-bank divergence cycle, a sustained carry unwind, a commodity-currency repricing — trend-following indicators are the highest-expectancy tools on the chart. The problem is that currencies also spend long stretches doing nothing in particular, and trend tools are structurally bad at recognising that.
Moving averages and EMA ribbons. A ribbon (several EMAs of increasing length plotted together) is genuinely more useful than a single moving average in forex, because the spacing between the lines is itself information. Tightly compressed lines mean the market is coiled and directionless — exactly when trend signals should be ignored. Fanned, evenly-spaced lines mean a trend has real participation behind it. Traders looking for a free starting point can use a standard EMA ribbon on TradingView before deciding whether a more adaptive tool is worth paying for.
SuperTrend. An ATR-based trailing stop-and-reverse system that flips direction when price closes beyond a volatility-scaled band. Its appeal in forex is that the ATR component partially self-adjusts to session volatility. Its weakness is the classic one: in a range, it flips repeatedly and each flip is a loss. It works best on higher timeframes (H1 and above) and paired with a range filter such as ADX. We wrote a full breakdown of the parameter trade-offs in the SuperTrend indicator settings guide, and Quantzee’s own SuperTrend Pro+ exists specifically to address the whipsaw problem by layering additional confirmation on top of the base flip logic.
ADX (Average Directional Index). Not a direction tool — a conviction tool. ADX tells you whether a trend has strength, regardless of which way it points. Its most valuable use in forex is as a gate: if ADX is below a threshold (many traders use somewhere in the 20–25 region as a starting point, then tune it per pair), you simply don’t take trend signals at all. This single filter removes a large share of the losing trades a naked trend system generates in currency ranges.
Adaptive trend tools. The 2026 generation of trend indicators — including Quantzee’s AI TrendPulse — adjust their sensitivity based on measured volatility conditions rather than using one fixed lookback. The logic is sound for forex specifically: a fixed 20-period setting that behaves well during the London/New York overlap is too twitchy for the Tokyo session and too slow for a data-release spike. Whether an adaptive tool is worth paying for depends entirely on whether you can verify it out-of-sample yourself, which we’ll come back to.
Family 2: Momentum indicators — powerful, and routinely misused
Momentum oscillators are the most-installed and least-correctly-used indicators in retail forex.
RSI. The standard interpretation taught to beginners — “above 70 is overbought, sell; below 30 is oversold, buy” — is close to the worst possible use of RSI in a trending currency pair. In a genuine trend, RSI can sit above 70 for days while the pair continues in the same direction, handing repeated losses to anyone fading it. The two uses that hold up better are: (a) divergence between price highs/lows and RSI highs/lows, as an early warning that a move is losing participation, and (b) the 50 line as a regime marker — RSI persistently above 50 in an uptrend, below 50 in a downtrend, with breaks of the 50 line as a momentum shift signal. Both work considerably better when gated by a trend filter.
MACD. A momentum tool derived from the difference between two EMAs, so it is partly a trend tool in disguise — worth remembering if you’re already running an EMA ribbon, since the information overlaps. Its histogram is the most useful component in forex: histogram bars shrinking while price still makes new extremes is a cleaner deceleration signal than the crossover itself, which lags meaningfully on the pairs and timeframes most retail traders use.
Stochastic. More sensitive than RSI, and therefore noisier. It has a genuine niche in range-bound conditions — precisely the conditions where trend tools fail — which makes a Stochastic-plus-ADX combination coherent: when ADX says “no trend,” Stochastic extremes at established structural levels become tradable; when ADX says “trend,” you switch off the Stochastic entirely and defer to the trend system.
Adaptive oscillators. The recurring complaint about all three classics is that they use fixed lookbacks in a market whose volatility regime changes several times per 24-hour cycle. Tools such as the Adaptive AI Oscillation Engine attempt to normalise oscillator readings against current volatility conditions, so that “overbought” means something comparable at 3am UTC and 3pm UTC. That’s a real problem worth solving in forex; as always, verify the claim on your own pairs before relying on it.
Family 3: Volatility indicators — the most underrated family in forex
If you only add one non-trend tool to a currency chart, make it a volatility measure. Volatility governs stop placement, position size, target realism and — critically in forex — whether a breakout is worth taking at all.
ATR (Average True Range). The workhorse. Its highest-value use isn’t signal generation but sizing and stops: setting your stop at a multiple of current ATR rather than a fixed pip count means your risk automatically adapts as conditions change. A 20-pip stop that is generous during Tokyo hours can be inside the noise band during a New York data release; an ATR-scaled stop handles both without manual intervention. ATR is also the cleanest way to compare volatility across pairs whose pip values and typical ranges differ enormously.
Bollinger Bands. Standard-deviation bands around a moving average. Two forex-relevant uses: the squeeze (bands contracting to unusually narrow width) as a warning that a directional expansion is likely — often preceding session opens or scheduled data — and band-walking as a trend-confirmation signal, since price hugging the upper band in a strong trend is continuation behaviour, not an automatic reversal signal.
Keltner Channels. ATR-based rather than standard-deviation-based, so they respond differently to volatility clustering. The Bollinger/Keltner relationship — Bollinger Bands contracting inside the Keltner Channels — is one of the more robust volatility-compression setups and translates well to currency pairs because it’s scale-free.
Session-aware calibration. Whatever volatility tool you use, calibrate it to the window you trade. The practical method: measure your pair’s average range separately for the Asian, European and US sessions over the last few months, and treat those as three different volatility environments with three different threshold sets — rather than one blended average that describes none of them accurately. This is the same regime-thinking we applied across asset classes in global volatility regimes: reading VIX, VSTOXX and crypto volatility indexes together.
Family 4: Structure — levels, VWAP, and the pivot timezone trap
Support and resistance / order blocks. Currencies respect round numbers and prior swing levels with unusual consistency, partly because option barriers and institutional stop clusters concentrate there. Smart-money-concept tooling — such as SMC Toolkit Pro — automates the identification of these zones, which is useful mainly because it removes the hindsight bias that creeps into hand-drawn levels.
VWAP. Volume-weighted average price is excellent in equities and futures, where volume is real and centrally reported. In spot forex it is a compromise: the “volume” input is tick volume from your broker’s feed, which is a proxy for activity rather than a true measure of contracts traded. VWAP is still usable in forex as a session-anchored mean-reversion reference — anchor it to the session open rather than a calendar day — but treat it as a weaker signal than its equity-market reputation suggests.
Pivot points — and the trap. Daily pivots are computed from the prior day’s high, low and close. In a 24-hour market, “the prior day” depends entirely on your broker’s server timezone. Two traders with brokers on different server times will see genuinely different daily pivot levels on the same pair. If you use pivots, know your broker’s daily cutoff, and don’t assume another trader’s levels match yours.
The volume problem, stated plainly
This deserves its own section because so much forex indicator content glosses over it.
There is no true volume in spot forex. Because currency trading is decentralised — an over-the-counter network of banks, ECNs and brokers rather than a single exchange — no venue publishes a consolidated volume figure. What your chart labels “volume” is almost always tick volume: the number of price changes in a period, from one broker’s feed.
Tick volume correlates reasonably well with actual activity, so it isn’t worthless. But it means:
- Volume-profile and volume-spike indicators are less reliable in spot FX than the same tools on equities or crypto.
- Volume readings can differ between brokers on the same pair at the same moment.
- Any strategy whose primary trigger is a volume threshold is standing on softer ground in forex than its backtest suggests.
If you want a genuine volume input for currency analysis, currency futures (CME FX futures) are centrally cleared and report real volume — many traders use them as a volume reference while executing in spot. That’s a workaround worth knowing, not a reason to avoid volume tools entirely.
Non-repainting: why it matters more in forex
A repainting indicator is one that changes its own historical signals after the fact — a buy arrow that appears on your chart, then quietly moves or vanishes once more data arrives. Backtests of repainting tools look extraordinary and are meaningless, because the backtest is scoring signals that were never actually available at the time they appear to have fired.
Forex amplifies the problem for a structural reason: the market never closes during the week, so “candle close” is a broker convention rather than a market event. An indicator that only finalises on bar close behaves differently depending on where your broker’s daily and weekly boundaries fall, and repainting behaviour that would be obvious at a stock market’s 4pm close can hide inside a 24-hour tape.
Two practical rules:
- Test every indicator for repainting before trusting it. The replay-bar method is the standard approach — we documented it step by step in how to test a TradingView indicator for repainting. It takes about ten minutes and disqualifies a surprising number of popular scripts.
- Treat non-repainting as a minimum requirement, not a feature. Every indicator in the Quantzee line is built to fire on confirmed data and not revise itself afterwards, for exactly this reason — a signal that can be rewritten after the fact cannot be honestly backtested. Our full explanation of the standard is in non-repainting TradingView indicators.
Costs: the thing that actually kills forex strategies
An indicator setup with a genuine statistical edge can still lose money in forex, because currency trading has cost structures that equity traders often underestimate.
Spread. You pay it on every round turn, it widens during illiquid hours and around scheduled news, and it is a far larger proportion of the move on short timeframes. A scalping setup targeting 8 pips on a pair with a variable 1.5–3 pip spread is giving away a substantial share of its gross edge before slippage.
Swap / rollover. Positions held past the daily rollover are credited or debited based on the interest-rate differential between the two currencies. Over multi-day holds, negative swap can consume a strategy’s entire expectancy — and it’s typically invisible in a naive indicator backtest.
Slippage on news. Scheduled releases produce gaps in a market that supposedly doesn’t gap. Stops don’t always fill at the stop price.
The implication for indicator selection: model realistic costs before comparing setups. An indicator combination that looks marginally better on gross pips may be worse net of a realistic spread assumption, particularly on lower timeframes. This is the single most common reason a promising forex backtest doesn’t survive contact with a live account — a failure mode we broke down in detail in why your backtest doesn’t match live trading. Indicator subscription cost is part of that same cost stack — a $49.99+/month suite like LuxAlgo eats into a forex account’s edge every single month, where a one-time purchase around $59.99 charges the account once and then stops; see our LuxAlgo alternative comparison for the full numbers.
Putting it together: a session-aware, four-tool template
Here’s a concrete, indicator-agnostic template that respects everything above. It is a framework to test, not a signal service.
Step 1 — Pick your session first, pairs second. Decide the window you can genuinely trade consistently. Then choose two or three pairs that are liquid in that window. Trading EUR/GBP because an article recommended it, during a session when it barely moves, is a self-inflicted problem no indicator fixes.
Step 2 — Establish trend on a higher timeframe. Use one trend tool on a timeframe roughly 4–6x your execution timeframe. If you execute on M15, read trend on H1 or H4. This higher-timeframe bias is your directional filter; you take signals in that direction only. The mechanics of doing this without writing code are covered in building multi-timeframe strategies without Pine Script.
Step 3 — Gate with volatility and conviction. Require two conditions before any entry: ADX above your threshold (trend has strength) and ATR within a sane band for your session (not dead, not a news spike). Signals failing either gate are skipped, not taken smaller.
Step 4 — Trigger with momentum at a structural level. Only now does your entry trigger matter: a momentum signal in the direction of the higher-timeframe trend, occurring at or near a structural level. Momentum alone, floating in the middle of a range, is not an entry.
Step 5 — Size and stop from ATR, not from a fixed pip count. Stop at a multiple of current ATR; position size derived from that stop and a fixed percentage account risk. This makes your risk consistent across pairs and sessions automatically.
Step 6 — Validate before you trade it. Run the setup through walk-forward splits, realistic spread and swap assumptions, and a regime breakdown by session — the full process is in stress-testing a trading strategy: a practical checklist. Then log every trade; the reasons a setup underperforms are usually visible in a journal long before they’re visible in the equity curve, as we argued in the trading journal habit that improves win rate.
Step 7 — Automate the watching, not the judgement. You cannot stare at a 24-hour market. Alerts are the mechanism that makes session-aware forex trading practical from any timezone — set them on your gate conditions, not just your entries, so you’re notified when conditions become tradable rather than after a move has already happened. Setup guides: TradingView alerts to webhook and a mobile alert workflow.
What actually changed for forex indicators in 2026
Three shifts are worth noting, without overstating them.
Adaptive parameters are becoming the default expectation. Fixed-lookback indicators are increasingly seen as a starting point rather than a finished tool, particularly in a market with forex’s session structure. The useful version of this is volatility-normalised parameters; the marketing version is calling any parameter change “AI.” Judge by whether the tool’s behaviour is documented and testable, not by the label.
Multi-timeframe confirmation is now table stakes. Tools that read higher-timeframe context internally, rather than requiring the trader to flip charts manually, have moved from premium feature to baseline expectation.
Verification scrutiny has risen. Traders are more sceptical of vendor backtests than they were a few years ago, and rightly so. The reasonable posture toward any indicator — free or paid, ours included — is to re-test the repainting claim yourself and re-run your own out-of-sample validation before committing capital. Our position on that is unchanged and stated openly on the pricing page: a tool you haven’t personally verified is a tool you shouldn’t be sizing up on.