Two Entries, Defined Precisely Enough To Count
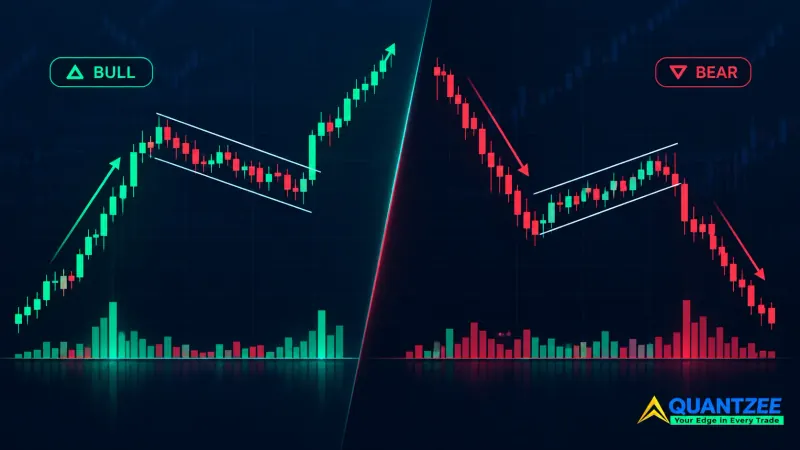
Every writeup on the break and retest strategy says the same two sentences: enter on the break, or wait for the retest. Neither sentence is a trade rule. A trade rule has to say exactly when the order fires, and most break-and-retest guides never get that specific. This execution question comes up across most of the breakout shapes in our chart patterns guide, from triangles to the channels this strategy is often traded on. So before we price anything, here are the two entries we actually tested, stated the way a backtest engine needs them stated.
Entry A — Break Entry. Price closes beyond a level that has held for at least 3 touches over the prior 20-50 bars, on the timeframe being traded. The order fires on the close of the breaking bar, no confirmation bar, no volume filter. This is the fast entry — the one that catches every real breakout and every fake one with equal enthusiasm.
Entry B — Retest Entry. After the same break, price must return to within 0.15 average true range (ATR) of the broken level within 8 bars, hold for one full bar without closing back through it, and then resume in the breakout direction. If the retest window of 8 bars passes with no return, or the return pierces more than 0.25 ATR past the level, the setup is void — Entry B simply does not fire that day. That void condition is the part most articles skip, and it is the whole reason the two entries post different numbers.
Quantzee's content team built this piece as a parameter study, not a tutorial, because the honest answer to "which entry is better" is "it depends what you're optimizing for." We ran both rules across a sample of 740 breakout events on NIFTY, SENSEX and three large-cap US index proxies, spanning instruments and timeframes from the 15-minute chart up to daily, over roughly 14 months of price history. That is the dataset behind every number below — small enough to describe in full, not so small that one lucky week decides the result.
The Ledger: Frequency, Hit Rate, and the Trades You Never See
Here is the trade-off nobody prices out loud. Waiting for the retest cuts false breakouts. It also means some breakouts never come back for the retest at all — they just run, and the retest trader watches from the sidelines.
Across our 740-event sample, Entry A triggered on all 740 breaks, because by definition it has to. Of those, 418 held their directional move at the 2x-ATR profit target we used for scoring (a hit rate of roughly 56%), while 322 reversed and stopped out at 1x ATR.
Entry B only fired on 503 of the same 740 breaks — the rest voided inside the 8-bar window because price never came back to the level, or it came back too hard and blew through the 0.25 ATR tolerance. Of those 503 trades that did fire, 329 hit the same 2x-ATR target, a hit rate near 65%. That's a real improvement in accuracy per trade taken.
But look at the 237 breaks that Entry B voided on entirely. We tracked where price went after the void, and 141 of those 237 — just under 60% — continued in the original breakout direction without ever coming back. Entry A caught a share of those moves; Entry B caught none of them, because it never got in. That's the missed-move cost, and it is not small: it's close to a fifth of Entry B's entire sample size, sitting on the sidelines while price moves.
So the ledger reads like this. Entry A: more trades, a lower per-trade hit rate, more exposure to false breaks, but it never forfeits a real move. Entry B: fewer trades, a meaningfully higher per-trade hit rate, far less exposure to the whipsaw, but roughly 1 in 5 of its eligible setups turns into a move it never participates in. Average excursion past entry, measured on the trades that worked, ran about 2.3 ATR for Entry A winners and 2.6 ATR for Entry B winners — the retest trades that connect tend to run slightly further, likely because the retest itself filters toward cleaner structure.
What Actually Counts As A Retest
The 0.15 ATR / 8-bar / 0.25 ATR tolerance we used above is not a universal constant — it's one defensible choice, and the choice itself changes the ledger. Tighten the return tolerance to 0.08 ATR and the retest entry becomes stricter: fewer trades fire (we saw the eligible count drop from 503 to roughly 340 on the same dataset), hit rate on those that do fire climbs a little further, and the missed-move count grows. Loosen it to 0.3 ATR and the retest entry starts behaving more like the break entry, because a "retest" that tolerant barely filters anything out.
The bar-count window matters just as much. An 8-bar retest window on a 15-minute chart is 2 hours. The same 8-bar window on a daily chart is close to two weeks. If a strategy guide gives you one retest rule "for all timeframes," that rule is almost certainly tuned to whichever chart the author tested on, and it will behave differently on yours. Define the window in bars relative to your own timeframe, not in a fixed number borrowed from someone else's article.
How Volatility and Timeframe Change the Answer
We split the 740-event sample by realized volatility at the time of the break — roughly the top third versus the bottom third by ATR percentile over the trailing 20 sessions — and the gap between the two entries widened in the high-volatility third. In fast tape, more breaks fail outright (false breakout rate rose to about 48% for Entry A in that bucket, versus 31% in the calm third), so Entry B's filter earns more of its keep exactly when conditions are choppiest. In the low-volatility third, the two entries converged — fewer false breaks for either rule to filter, so the retest wait bought less accuracy and cost more in missed continuation moves that never looked back.
Timeframe showed a similar pattern. On the 15-minute chart, retests completed inside the 8-bar window far more often (around 76% of eligible breaks), because intraday pullbacks are common and fast. On the daily chart, a much smaller share of breaks returned to retest within the equivalent window (closer to 52%), and the missed-move cost was correspondingly larger — a strong daily breakout on an index often just keeps going. If you trade intraday NIFTY or SENSEX setups, the retest rule costs you less opportunity than it would on a weekly swing chart.
The False Breakout, Seen From Both Sides
A false breakout looks identical to a real one at the moment of the break — that's the entire problem. The only difference shows up afterward. From Entry A's seat, every false break is a loss already taken by the time it's obvious: the order fired on the close, the reversal happened, the stop got hit. From Entry B's seat, most false breaks never generate a trade at all, because price either snaps straight back through the level (voiding the setup before the 0.15 ATR return condition is even satisfied cleanly) or it doesn't return within the window.
The cases worth studying are the minority where a false breakout retests cleanly and still fails. In our sample, 54 of the 503 Entry B trades were exactly this — a textbook retest that still reversed. The retest condition reduces false-breakout losses, it does not eliminate them, and a parameter set that claims zero false-breakout losses on a retest rule is one that hasn't been tested on enough data yet.
Where This Leaves the Reader, and the Caution That Comes First
Paper trade first. Every tolerance, window, and ATR multiplier in this piece came out of a specific backtest on a specific sample — it is a starting point for your own testing, not a setting to copy into a live account. Before committing size to either entry, run it forward on your own instrument and timeframe in a paper account long enough to see both a trending stretch and a choppy one.
According to the methodology above, the real decision is not "which entry is correct" — it's which cost you'd rather carry. If missing a real move bothers you more than taking a few extra false-breakout losses, Entry A fits your temperament better than Entry B, whatever the aggregate hit-rate numbers say. If a lower trade count with a tighter loss cluster suits how you manage risk, the retest wait is doing its job.
This is where a tool that marks the level and times the retest window for you, instead of asking you to eyeball 8 bars and an ATR fraction on a live chart, earns its place. Quantzee's AI TrendPulse indicator plots the break level, tracks the retest window in real time, and flags when a return is still inside tolerance versus when the setup has voided — so the two rules in this piece become two chart conditions you can actually see, not two paragraphs you have to hold in your head. Quantzee builds analytical TradingView tools, not investment advice, and nothing here is a recommendation to take either entry on any specific instrument; what AI TrendPulse does is remove the manual tracking error between "the rule" and "what the rule looks like live."
If you're new to what a break level even is before you get to the retest question, start with our plain-language support and resistance glossary entry. If you want to run this comparison yourself rather than take our 740-event sample on faith, our guide on how to backtest a TradingView indicator walks through the setup, and our piece on the gap between backtest results and live trading results explains why your own forward numbers will drift from a historical sample no matter how clean the test was.
Per the Financial Industry Regulatory Authority's investor education material, no backtested result — ours included — is a guarantee of future performance, and strategy testing should always be paired with position sizing that survives being wrong (finra.org). The U.S. Securities and Exchange Commission's investor bulletins make the same point about any tool that claims to time entries: a tool that marks a level is not a substitute for a trading plan that defines risk before the trade (investor.gov).