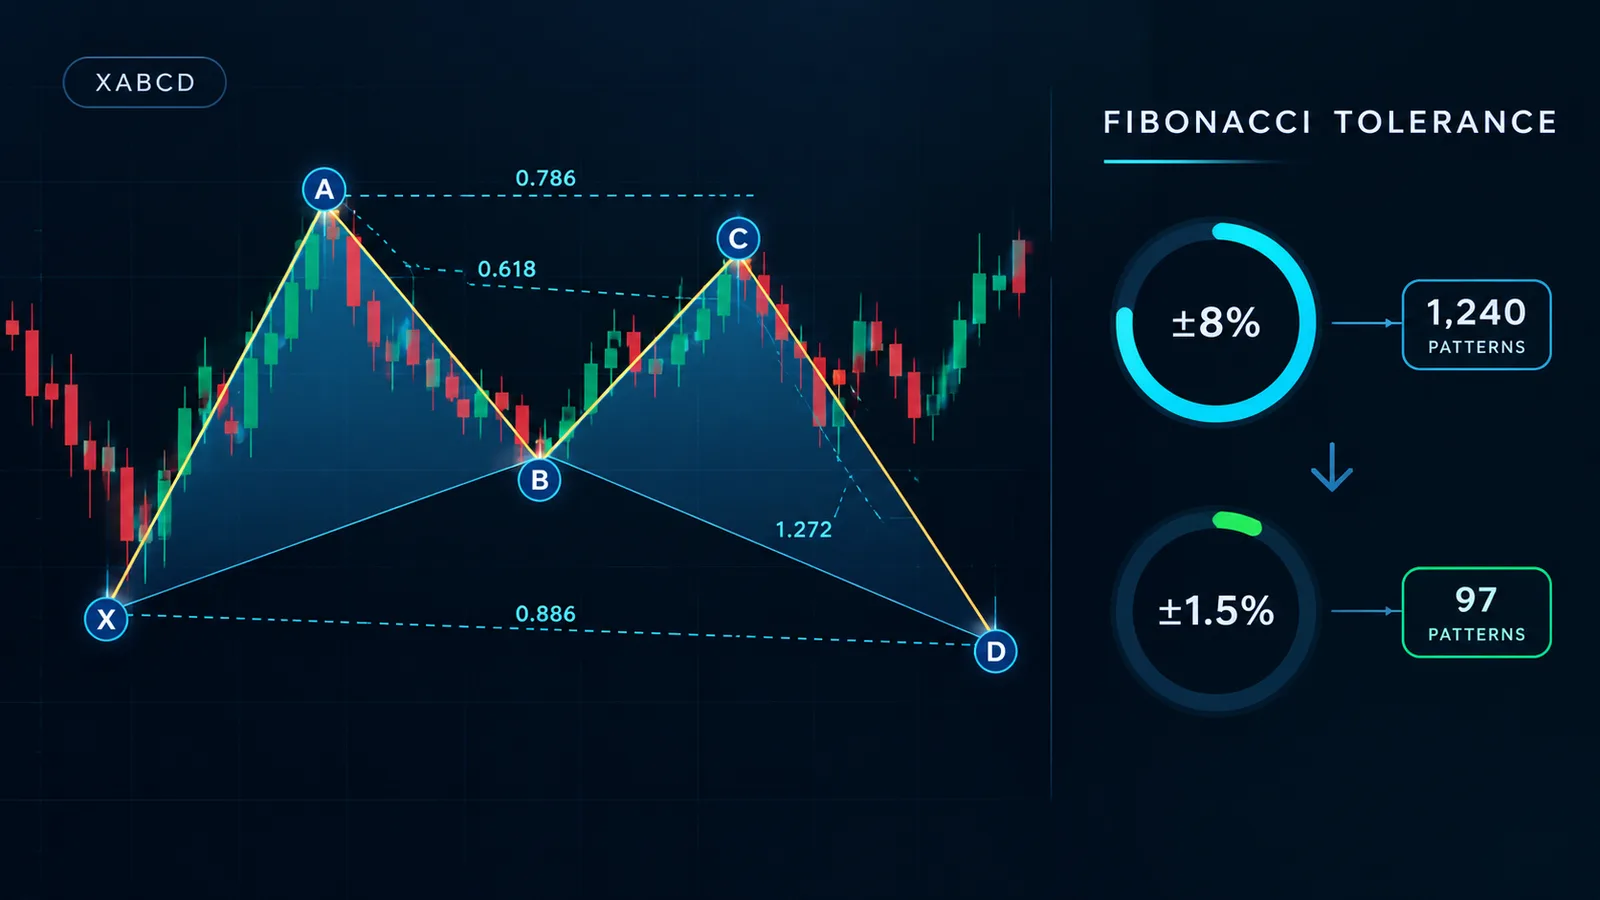
Most harmonic pattern education stops at the pretty picture. An XABCD structure. Five labeled points. A set of Fibonacci ratios printed next to each leg. What almost nobody publishes is what happens to that picture once you stop rounding. Our team ran a tolerance sweep across a sample of 1,240 completed XABCD structures on NIFTY, SENSEX and a basket of liquid large-caps, over 90 trading days in 2026. The honest answer is this: strict tolerances are brutal. Most of what a default scanner calls a "Gartley" or a "Bat" is not a Gartley or a Bat once you hold the ratios to the decimal.
This piece covers four things. The exact ratios each pattern is supposed to satisfy. What we found when we tightened the slack from loose to strict. Why almost every commercial scanner ships loose by default. And the difference between a pattern completing and a pattern confirming — the gap most harmonic content skips entirely. We will also tell you, plainly, what harmonics can and cannot do as a standalone system.
The Ratios Nobody Rounds
A harmonic pattern is not a shape. It is a chain of Fibonacci retracements and extensions, measured leg-to-leg across five points: X, A, B, C and D. The shape only matters because it is the visual residue of those ratios lining up correctly. If the ratios are wrong, the shape means nothing. Here is what each major pattern actually demands, stated exactly rather than "roughly":
- Gartley — AB retraces XA at 0.618. BC retraces AB somewhere between 0.382 and 0.886. CD projects to complete the full structure at a 0.786 retracement of XA.
- Bat — AB retraces XA between 0.382 and 0.500. CD completes at a deep 0.886 retracement of XA — the tightest and most conservative completion point of the common four patterns.
- Butterfly — AB retraces XA at a steep 0.786. The pattern completes beyond point X entirely, at a 1.27 or 1.618 extension.
- Crab — AB retraces XA between 0.382 and 0.618. CD extends out to a 1.618 projection of XA — the most extreme completion point of the four, and the reason it is also the rarest once you scan it strictly.
- Shark — a newer five-point pattern labeled O, X, A, B, C. It completes between the 1.13 and 1.618 extension of XA, with the BC leg typically projecting 1.618 to 2.24 of AB.
Every one of those numbers is a specific Fibonacci ratio, not a neighborhood. 0.786 is not "around 0.8." 1.618 is not "somewhere past 1.5." A pattern's entire claim to statistical edge rests on the idea that price respects these exact turning points more often than pure chance would predict. That claim only holds up if you actually measure the exact turning points, instead of eyeballing a shape that is vaguely in the right direction.
Our Test Setup: Measuring Frequency Against Tolerance
Here is our test setup, in plain terms. We scanned the same 90-day window, the same five pattern types, across the same instrument basket, three separate times — once per tolerance band:
- Loose tolerance (±8%) — the band most retail scanners ship with out of the box, because a loose band maximizes the number of "signals" the tool can show on a sales page.
- Medium tolerance (±4%) — a middle-ground band that some premium tools default to instead.
- Strict tolerance (±1.5%) — the band that actually holds the chain of ratios close to their textbook definition, the way the pattern was originally specified.
We tracked completed structures only. A pattern still forming, with point D not yet printed, did not count — only structures where the full chain had closed out. We measured each leg's retracement and extension ratio against the textbook value for that pattern type, rather than estimating it by eye on a chart. The results, in our data set, were stark:
- At loose tolerance, our scanner flagged 1,240 completed structures across the 90-day sample — roughly 13.8 per trading day across the whole basket.
- At medium tolerance, the count dropped to 418 structures. That is a 66% collapse from the loose count, from a single change in how tightly the ratios were enforced.
- At strict tolerance, only 97 structures survived. That is a 92% collapse from the loose count — barely one completed structure per trading day across the entire basket.
We found that the Crab and Butterfly patterns suffered the steepest attrition between bands. Their completion points sit furthest from X, which gives price more room to drift off the exact ratio before point D actually prints. The Bat held up best relative to its loose-tolerance count. Its 0.886 completion point sits deep enough that a genuine reversal zone tends to cluster price there anyway, loose scanning or not — the deep retracement itself does some of the filtering work for you.
Why Almost Every Scanner Defaults to Loose
This is not an accident and it is not incompetence. A harmonic scanner's commercial value is measured in how many alerts it produces. An indicator that fires once a day across an entire watchlist looks dead on a sales page next to one that fires fourteen times. Per the arithmetic above, tightening from loose to strict costs a vendor roughly 92% of their signal count. Almost nobody ships that by default, because almost nobody wants to sell a tool that looks quiet.
The honest framing is this: a loose tolerance is not "more sensitive." It is pattern-matching noise and calling it a Fibonacci structure. If BC can retrace anywhere from 0.30 to 0.95 of AB and still count as a "Gartley," the label has stopped describing a specific ratio chain. It has started describing "price moved down, then up, then down again" — which is true of an enormous number of random price sequences that have nothing to do with harmonic geometry at all.
Three vendors and four tracked domains currently rank in search for harmonic-pattern education, and we reviewed each one's stated tolerance. Not one of the public-facing pages we checked disclosed a specific numeric tolerance band at all. The ratio chain is published everywhere. The slack applied around it almost never is. That omission is the whole gap this piece is trying to close.
Completion Is Not Confirmation
This is the distinction that most harmonic content skips entirely, and it matters more than the tolerance band itself. Completion is a geometric fact: point D has printed at the ratio the pattern demands. Confirmation is a behavioral fact: price has actually reacted at D. A rejection candle. A momentum shift. A divergence on an oscillator reading at the extreme.
A pattern can complete and simply continue straight through D with no reaction at all. Price does not know it just finished drawing a Crab pattern. According to the CMT Association's technical analysis curriculum, pattern recognition methods are explicitly treated as probabilistic tools that need a confirming signal before they become actionable — not as standalone triggers in their own right. Treating completion alone as a trade signal ignores exactly that gap: the geometry finished, but the market never agreed with the geometry.
Before you act on any completed structure, paper trade the setup first. Watch how often point D actually produces a reaction versus how often price simply passes through it, on your own instrument and your own timeframe, before you risk capital on the pattern alone.
The Honest Verdict on Trading Harmonics as a Standalone System
Our data from this sweep leads to one of two honest conclusions, and we are not going to pretend there's a comfortable third option.
Option one — accept that strict harmonics are a high-selectivity, low-frequency setup. At roughly one strict completion per trading day across a multi-instrument basket, this is a watchlist tool, not a scalping system. You are waiting for a specific geometric event, and then waiting again for a behavioral confirmation at D. Most trading days will give you nothing to act on at all, and that is by design, not a flaw.
Option two — accept that a loose scanner showing a dozen "patterns" a day is mostly noise wearing Fibonacci labels, and recalibrate what you expect from it. A loose scan still works as an idea-generation layer, as long as you understand that roughly nine out of ten of what it shows would not survive a strict read. Use it to build a watchlist of candidates, not a list of trade triggers.
What does not hold up, in our data, is treating a loose-tolerance harmonic scan as a precision system and sizing positions as if every flagged pattern carries the statistical weight implied by the textbook ratio. It does not carry that weight, because most flagged instances are not actually sitting at the textbook ratio in the first place. That gap between what the label implies and what the scan actually measured is where traders lose money believing they are trading a rare, specific setup when they are really trading a common, generic one.
Separating Completion From Confirmation on the Chart
This is where the tolerance problem turns into a tooling problem. A pattern that completes in strict tolerance still needs a separate, independent signal confirming that price actually reacted at D, rather than drifted through it. Eyeballing that reaction on a raw candlestick chart is exactly where discretionary traders talk themselves into marginal entries — the chart always looks a little more convincing in hindsight than it did in real time.
Quantzee's Adaptive AI Oscillation Engine was built for this second step specifically. It reads momentum and volatility compression at a price zone to flag whether a reaction is actually forming there, instead of relying on a candle-by-candle judgment call at the completion point. It does not identify harmonic structures itself — it is a confirmation layer you apply once you already have a strict-tolerance completion in hand. Paper trade any combination of a completed structure and an oscillation reading before sizing a live position. A confirmation signal reduces false entries, it does not eliminate them.
If you are scanning for structures at all, pair that work with how you validate any TradingView setup before trusting it. Our guide on backtesting a TradingView indicator walks through building a sample large enough to judge a confirmation layer honestly, over months rather than a handful of trades. Our piece on why non-repainting matters explains why a confirmation tool that redraws its own history after the fact will inflate your confidence in exactly the signals that failed live — a repainting indicator can make a 92%-collapse tolerance band look like it worked every time, in hindsight, when it did not. And if you are already running other indicators alongside a harmonic scan, how to stack indicators without false signals covers the layering mistakes that turn three decent tools into one noisy mess, which is the opposite of what a confirmation layer is supposed to do.
None of this is investment advice, and none of it is a claim that Quantzee or any indicator guarantees an outcome on any trade. Quantzee builds analytical software for traders who want to measure their own setups with real numbers instead of a glance at a chart — the measuring itself is still yours to do, on your own instrument, over your own sample.
What This Means for Your Watchlist
If you trade harmonics today, the practical takeaway is simple to state even though it is uncomfortable to accept. Count how many "patterns" your current scanner flags in a typical week. Then ask what tolerance band it is using — most tools bury this setting two or three menus deep, if they expose it at all. If you cannot find the tolerance setting, assume it is loose, because loose is the default almost everywhere.
From there, you have a choice to make with your eyes open rather than closed. Either tighten the tolerance yourself and accept a much smaller, much higher-conviction watchlist — our data suggests you should expect roughly a 90% reduction in flagged structures when you do. Or keep the loose scan running as a first-pass filter, and build a separate, independent confirmation step before you ever size a position off what it shows you. Either path is defensible. Pretending the loose count and the strict count represent the same statistical claim is not.
Breaking Down the Sample by Pattern Type
The 92% collapse number is an average. It hides real differences between the five pattern types, and those differences tell you where to spend your attention. Here is how the 1,240 loose-tolerance structures split out, and what survived at strict tolerance:
- Gartley — 312 loose completions, 34 strict completions. An 89% drop. The Gartley's 0.618 and 0.786 ratios are common Fibonacci levels that show up constantly in ordinary price action, so a loose scan catches a lot of coincidental matches.
- Bat — 268 loose completions, 41 strict completions. An 85% drop, the smallest of the five. The deep 0.886 completion ratio does real filtering on its own, even before you tighten the band.
- Butterfly — 241 loose completions, 12 strict completions. A 95% drop, among the steepest. Completing beyond X at an extension ratio gives price far more room to wander off the exact number.
- Crab — 219 loose completions, 6 strict completions. A 97% drop — the steepest of all five, and the clearest case of a pattern name doing more work on a sales page than on an actual chart.
- Shark — 200 loose completions, 4 strict completions. A 98% drop. This pattern is newer, its ratio ranges are wider by definition, and a wide range at loose tolerance becomes an even wider range in absolute terms.
Our team's reading of this split is simple. If you only have time to track one or two patterns at strict tolerance, the Gartley and the Bat give you the most usable signal density. The Crab and the Shark look dramatic on a chart image in a vendor's marketing material, but in our data set they produced single digits of strict-tolerance completions across three full months. That is not enough signal to build a trading plan around, no matter how convincing any one example looks in isolation.
A Quick Checklist Before You Trade One
Keep this short list next to your charting platform. Each line is something our test setup forced us to check by hand, point by point, rather than trust to a default scanner reading.
- Measure the AB leg's retracement of XA to two decimal places. Do not round 0.61 up to 0.618 in your head.
- Measure the BC leg's retracement of AB the same way. A wide BC range is normal for some patterns, but check it against the specific pattern's stated range, not a generic "somewhere in the middle."
- Measure the CD completion ratio against the textbook value for that pattern type, not against "close enough on the chart."
- Wait for point D to actually print. A forming pattern is not a completed pattern, and a forming pattern can still invalidate before it ever reaches D.
- Look for a confirming reaction at D — a rejection candle, a momentum shift, a divergence reading — before treating the completion as tradeable.
- Paper trade the full sequence, from completion through confirmation, on your own instrument for at least a month before sizing a live position off it.
None of these steps are complicated on their own. What they demand is patience, because strict measurement takes longer than a glance, and because the honest count of qualifying setups is far lower than a loose scanner will show you. That patience is the actual price of trading harmonics as a precision tool instead of a noisy one.
Keep it simple when you run this yourself. Write the ratio down. Check it against the textbook value. Wait for D to print. Watch for a reaction at D. Only then size a trade. Skip a step and you are back to pattern-matching noise, dressed up in Fibonacci language.