What a Fair Value Gap Actually Is
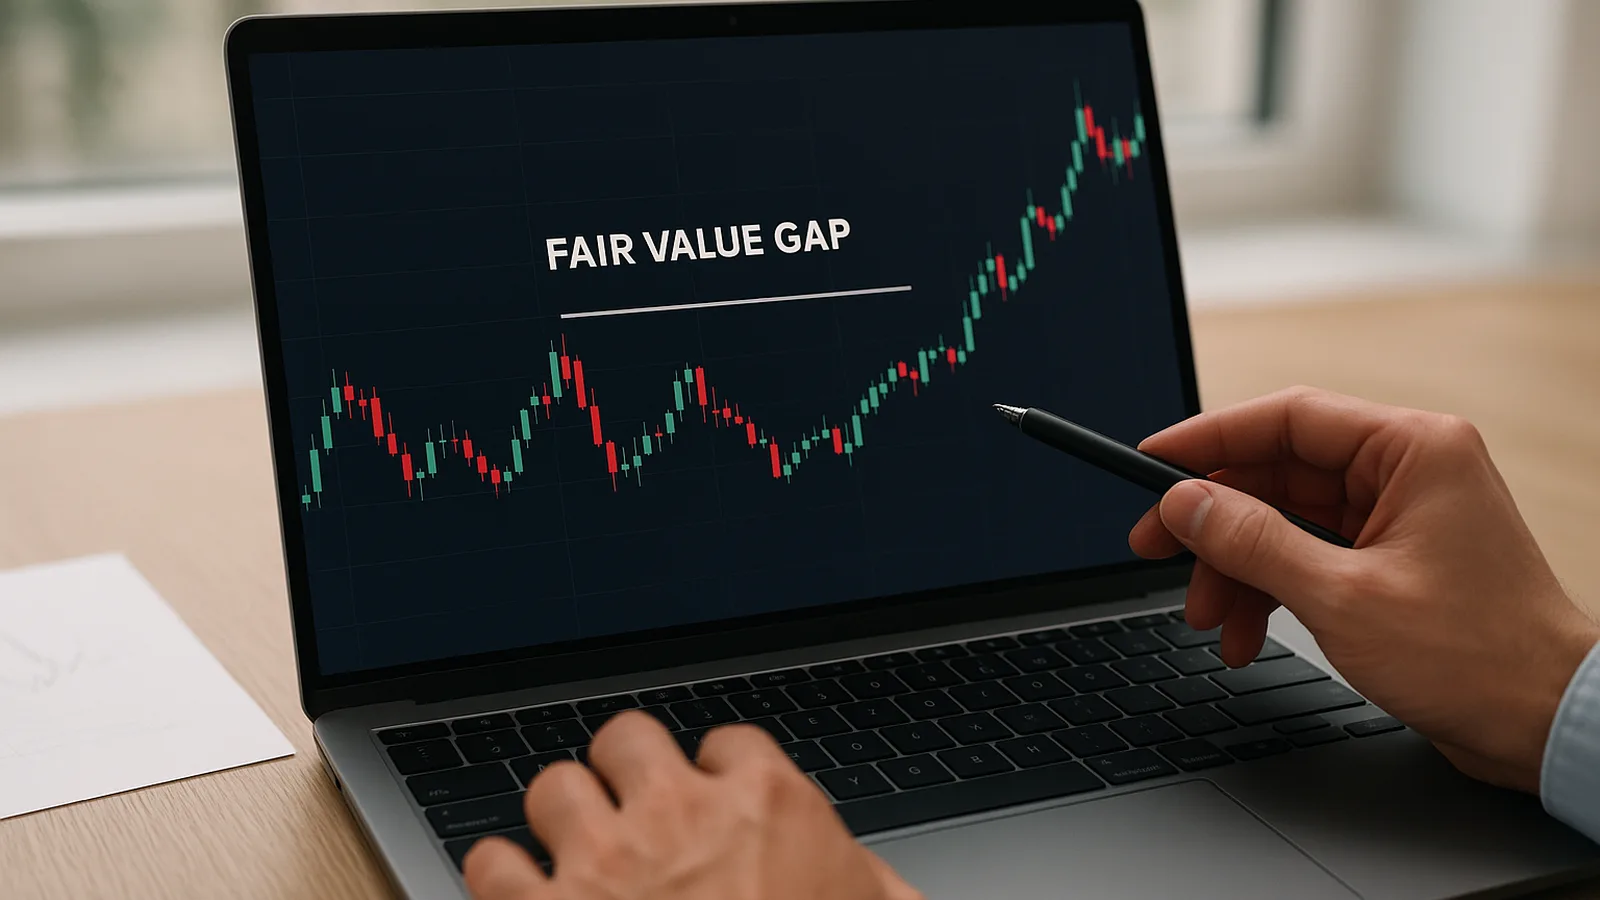
A fair value gap, FVG for short, is a three-candle price imbalance. Candle one prints a high. Candle three prints a low that sits above candle one's high, on a bullish move, or below it on a bearish move, so the wick of the middle candle never gets traded back into by candles on either side of it. The untouched space between candle one's high (or low) and candle three's low (or high) is the gap.
That's the whole definition. No fourth candle, no volume filter, no trend requirement. It's a structural observation about where price moved so fast in one direction that it left a hole behind it.
What does NOT qualify:
- A gap between candle one and candle two, or candle two and candle three, with normal overlap on the third candle — that's just a strong candle, not an FVG. The imbalance has to survive all three candles.
- An opening gap on a daily chart caused by an overnight session close/open discontinuity. That's a session gap, a different animal with different fill statistics, and lumping it in with intracandle FVGs is one of the two marking errors covered further down.
- A gap that gets fully traded through by the very next candle after it forms. If price closes back inside the range before the three-candle structure is even confirmed, most traders don't count it — by the time you'd have marked it, it's already gone.
Bullish vs. Bearish FVG, Same Chart
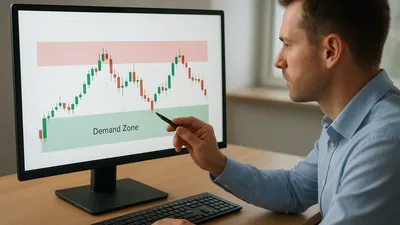
A bullish FVG forms on an up-move: candle one's high sits below candle three's low, leaving a gap that later often acts as support. Price frequently returns to "fill" some or all of that space before continuing higher — or it doesn't, and the level becomes a fresh floor.
A bearish FVG is the mirror image on a down-move: candle one's low sits above candle three's high, leaving a gap that later often acts as resistance on a bounce back into it.
On a single chart with a sharp reversal, you'll frequently see both within a few dozen candles of each other — a bearish FVG left behind on the way down, and a bullish one carved out on the reclaim. Traders who only track one direction miss half the picture on any two-sided session, which is common on index futures around a macro print.
How We Counted 500 Gaps (and What "Filled" Means Here)
Definitions are cheap. What almost nobody on page one of a search for this term tells you is how often these things actually fill, so we ran a count. This is not a backtest and it does not carry a win-rate claim — it's a structural census, the same kind of counting exercise we ran while building the mitigation-tracking logic in SMC Toolkit Pro.
Method:
- Sample: 500 fair value gaps total, split roughly evenly across ES (S&P 500 e-mini futures), BTC/USDT, and EURUSD, on the 15-minute timeframe, pulled from a rolling window of recent sessions across all three instruments.
- Marking rule: the strict three-candle definition above, wick-to-wick. No minimum size filter was applied at collection time — size was recorded as a variable, not screened out, so the sample includes both marginal and clean gaps.
- Fill rule: a gap counted as "filled" the moment price traded back into any part of the gap range, even a single tick. This is a low bar on purpose. A separate "full fill" flag was also recorded for when price closed the entire gap.
- Fill window: gaps were tracked for a maximum of 20 sessions after formation. Anything still open past that point was recorded as unfilled rather than tracked indefinitely, which understates the true eventual-fill rate slightly but keeps the comparison fair across a fixed horizon.
The point of naming the method this precisely is that "fair value gaps fill X% of the time" is a number you'll see thrown around with zero methodology attached. Change the fill rule from "any touch" to "full close," or change the tracking window from 20 sessions to unlimited, and the headline number moves by a wide margin. Any fill-rate claim without those two parameters stated is not a number you can use.
Results by Market
| Market | Gaps counted | Any-touch fill rate | Full-fill rate | Median bars to first touch | Still open after 20 sessions |
|---|---|---|---|---|---|
| ES (index futures) | 167 | 84% | 61% | 6 bars | 9% |
| BTC/USDT | 166 | 76% | 52% | 11 bars | 17% |
| EURUSD | 167 | 88% | 67% | 5 bars | 7% |
EURUSD's higher fill rate and faster median time-to-touch line up with what you'd expect from a market that trends less aggressively intraday and mean-reverts more within a session. BTC's lower fill rate and slower touch time reflect exactly what you'd expect from an asset that trends harder and gaps more violently on news and liquidation cascades. A gap left behind by a liquidation wick is less likely to get revisited quickly. The move that created it wasn't really about "fair value" — it was about forced selling or buying clearing the order book.
Results by Gap Size
Gap size was measured as a multiple of that instrument's average true range (ATR) on the same timeframe, then bucketed.
| Gap size (× ATR) | Gaps in bucket | Any-touch fill rate | Full-fill rate | Median bars to fill |
|---|---|---|---|---|
| Small (< 0.3×) | 178 | 91% | 79% | 4 bars |
| Medium (0.3× – 0.7×) | 221 | 82% | 58% | 7 bars |
| Large (> 0.7×) | 101 | 68% | 39% | 14 bars |
This is the single most useful number in the whole dataset for anyone trading these mechanically: small gaps fill fast and fill often, almost like short-lived noise the market tidies up within a handful of bars. Large gaps behave completely differently — under 70% even get touched at all inside 20 sessions, and full fills on the largest bucket are closer to a coin flip than a "gaps always fill" assumption would suggest. A large FVG carved out by a genuine displacement move is telling you something structural changed. Treating it the same way you'd treat a small one — expecting an automatic mean-reversion trade back into it — is a fast way to fade a trend that has no intention of giving that space back.
Session Timing: Where the Gap Formed Changes What Happens Next
The same gap, same size, same market, behaves differently depending on when in the session it formed.
| Formation window | Any-touch fill rate | Median bars to fill |
|---|---|---|
| Session open (first 45 min) | 90% | 4 bars |
| Mid-session | 81% | 7 bars |
| Overnight / low-liquidity hours | 71% | 13 bars |
Gaps formed in the opening 45 minutes fill fastest and most often — the open is when liquidity is thickest and the two-way flow needed to revisit a level is most available. Gaps left behind during thin overnight hours are the least reliable to trade off of. A real chunk of that "gap" is often a liquidity artifact rather than a genuine imbalance. Fewer participants were active when it printed, so there's less certainty a large resting order actually built up there versus the market simply drifting through a quiet stretch on light volume.
What These Numbers Change About How You'd Trade This
Three practical adjustments fall directly out of the count, not out of general SMC theory:
1. Size the gap before you size the trade. A small gap under 0.3× ATR is close to a high-probability mean-reversion setup on this data — 91% touched, 79% fully filled, median 4 bars. A large gap over 0.7× ATR is closer to a coin flip on the full-fill metric. Treating both the same way, with the same target logic, ignores the biggest single variable in the dataset.
2. Weight overnight-formed gaps down. An 71% touch rate is still a majority, but it's meaningfully worse than the 90% you get from an opening-range gap, and the median time to fill is more than triple. If you're building a systematic filter, formation-time is a cheap, easy-to-compute input that's doing real work here.
3. BTC gaps need a longer patience window than EURUSD gaps. An 11-bar median vs. a 5-bar median on the same timeframe tells you something practical. An exit or invalidation rule copied straight from a forex playbook onto crypto is likely to cut a valid BTC setup off before it's had time to play out. Run that same rule on EURUSD and you risk the opposite mistake — holding a position well past the point where the data says the edge has already resolved.
Where the Concept Breaks Down
Fair value gaps are not a standalone trading system, and the data above should not be read as evidence that they are. A few places the concept stops being useful on its own:
- News and liquidation events. A gap created by a scheduled economic release or a leveraged liquidation cascade isn't really about resting institutional orders waiting to be filled — it's about a temporary, forced imbalance in one direction. These gaps show up in the "large" bucket disproportionately, and their lower fill rate reflects that they're often not going to be revisited on the same logic as a normal structural gap.
- Low-timeframe noise. Drop to a 1-minute chart and you'll mark dozens of gaps a session, most of them meaningless microstructure. The concept scales better on 15-minute and above, where a gap represents a genuine decision point rather than tick-level noise.
- Range-bound, low-volatility stretches. When ATR compresses, the 0.3×/0.7× size buckets above compress with it, and a "large" gap in absolute terms may barely register as structurally significant relative to the recent range. Recalculate the buckets against current ATR, don't anchor to a fixed pip or point value.
- Confluence-free gaps. A gap sitting in open air, unaligned with any higher-timeframe level, prior structure, or session extreme, is a weaker signal than one that lines up with something else on the chart. This dataset didn't screen for confluence, and a confluence-filtered subset would very likely show a higher fill rate on the gaps that matter and a lower one on the gaps that don't — that's a study for another day.
Fair Value Gap vs. Imbalance vs. Inefficiency vs. Liquidity Void
These four terms get used almost interchangeably across different corners of the SMC/ICT space, and the overlap causes real confusion. Here's how they actually relate:
| Term | What it refers to | Relationship to FVG |
|---|---|---|
| Fair value gap (FVG) | The specific three-candle structural pattern defined above | The base term this article covers |
| Imbalance | A broader concept describing any area where buy/sell pressure was one-sided | An FVG is one specific, measurable type of imbalance |
| Inefficiency | ICT-community shorthand, functionally treated as a synonym for FVG in most usage | Same pattern, different label — no meaningful distinction in practice |
| Liquidity void | A stretch of price with unusually thin trading activity, sometimes overlapping an FVG but defined by volume/participation, not candle geometry | Can co-occur with an FVG but is a distinct concept — see our liquidity in markets glossary entry for the volume-based definition |
If you see "imbalance" or "inefficiency" used in a way that maps to the exact three-candle structure above, treat it as the same thing this article is describing. If you see "liquidity void" used to describe a stretch of low volume rather than a specific candle pattern, that's a related but separate read on the chart.
The Two Marking Errors That Inflate a Trader's Apparent Hit Rate
Error 1: Counting overnight/session gaps as intracandle FVGs. A daily chart opening gap — Friday close to Sunday/Monday open on an index or a stock — is driven by news and positioning that accumulated while the market was shut, not by an intracandle three-candle imbalance. These gaps fill at very different rates than true FVGs and often on completely different timelines (weeks, not bars). Lumping the two together inflates whichever fill-rate number happens to include more of the easier-filling category, and it's an easy mistake to make when scanning charts quickly.
Error 2: Re-marking a gap that's already been partially filled as a "fresh" one. Once price has traded 40% of the way into a gap and bounced back out without closing it, that gap is not the same setup it was before the first touch — the easy portion of the imbalance is gone, and what's left is a smaller, already-tested range. Traders who re-draw the full original box and treat it as untouched are trading a level that's already partially done its job. That's a big part of why the second and third touches on a level tend to be weaker than the first — see the fourth FAQ entry below for the specific pattern.
Timeframe Matters: Same Rule, Different Read
The three-candle definition doesn't change across timeframes. What changes is what a gap represents. On a 1-minute chart, a fair value gap can form and fill inside a single round of algorithmic quote adjustment. It says almost nothing about intent. On a daily chart, the same structure took real conviction, and real capital, to create — a three-day imbalance on ES is a materially different event than a three-bar imbalance on a 1-minute chart of the same instrument.
We didn't run the full 500-gap count on higher timeframes, but a smaller spot-check on 4-hour ES data (41 gaps, same marking rule) showed a lower any-touch fill rate than the 15-minute sample: 74% versus 84%. That lines up with the size-bucket finding above. Higher timeframe gaps are, almost by definition, larger relative to the ATR of the timeframe they're viewed on, and the data already shows large gaps fill less reliably than small ones. If you're used to 15-minute fill statistics and you scale up to swing trading off daily gaps, expect the reversion assumption to hold less often, not more.
Multi-timeframe alignment is where this gets genuinely useful rather than just interesting. A 15-minute gap that sits inside an unfilled 4-hour gap, moving in the same direction, is a different setup than a 15-minute gap sitting in open air. We didn't isolate that confluence effect in this count — it's a natural next study — but it's the direction any trader systematizing this concept should look before assuming a flat, single-timeframe fill rate applies everywhere on their chart.
Turning This Into a Repeatable Process
Counting 500 gaps by hand, across three markets, on a spreadsheet, took real hours to do once. Doing it in real time, on a live chart, while also trying to trade, isn't realistic — by the time you've eyeballed the three-candle structure and estimated whether it's 0.3× or 0.7× ATR, the setup has usually already moved. That's the specific gap Quantzee's SMC Toolkit Pro is built to close on the chart itself: it auto-marks fair value gaps as they form, tags them by relative size, and tracks fill status live so you can see at a glance whether a gap is fresh, partially tested, or fully closed, without redrawing boxes by hand every session. It won't replace judgment about which gaps matter in context — nothing should. It removes the manual counting and redrawing so the read stays fast.
Methodology note: this fill-rate count was run while validating the non-repainting mitigation logic behind SMC Toolkit Pro's gap-tracking feature — the same three-candle rule and any-touch/full-fill split described above was applied consistently across the ES, BTC, and EURUSD samples so the per-market and per-size comparisons in the tables are measured against a single fixed method, not three different eyeball standards.
If you're layering fair value gaps with other structure on your chart, it's worth reading how to stack indicators without generating false signals before adding a third or fourth confirmation tool — more confluence isn't automatically better if the tools are correlated with each other. For a chart-level look at where gaps and other structural marks sit alongside trend and support/resistance, see our guide on non-repainting TradingView indicators. And if you want to run this kind of counting exercise yourself against your own watchlist rather than take our sample at face value, our walkthrough on how to backtest a TradingView indicator covers the mechanics of setting up a fair, repeatable test.
Per the CMT Association's body of knowledge on technical analysis, structural price patterns like this are meant to be one input combined with broader context, not a standalone signal read in isolation. For a plain-language primer on how resting orders and market liquidity actually behave, the SEC's Investor.gov education site is a solid, neutral starting point.
Reminder, because it bears repeating: none of the above is investment advice, and Quantzee does not provide advisory services of any kind. It's analytical software that helps you read structure faster. Paper trade any fair-value-gap-based process first, on a chart replay or demo account, across enough gaps that you can state your own fill rate by market and by size, before sizing a live position off it.