What a Heikin Ashi Candle Actually Computes
Heikin Ashi means "average bar" in Japanese. The name is literal. Every value on a Heikin Ashi chart is an average of something else. It is never the raw traded price. According to TradingView's own documentation, the formula runs like this:
- HA Close = (Open + High + Low + Close) / 4 of the current real candle
- HA Open = (previous HA Open + previous HA Close) / 2
- HA High = max(High, HA Open, HA Close)
- HA Low = min(Low, HA Open, HA Close)
Look at the second line again. The HA Open for bar 50 depends on bar 49's HA Open and HA Close. Bar 49 depends on bar 48. The chain runs all the way back to the first candle plotted. That recursive chain is what creates the smoothing people like. It is also the exact mechanism that makes a Heikin Ashi price unusable as a trade fill. No broker and no exchange will ever execute you at an average of four prices blended with yesterday's average. Wikipedia's technical description of the chart type confirms the same point: each bar is a derived value, not an observed trade. The number on the chart and the number on your trade confirmation are never the same thing. That gap exists by construction, every single time.
The Same Trade, Priced Two Ways
Here is a simple walk-through with round, NIFTY-style numbers. This is not a record of one specific live trade. It is the arithmetic that governs every Heikin Ashi candle, applied to numbers that are easy to follow.
Say the real 15-minute candle prints Open 22,400, High 22,460, Low 22,390, Close 22,445. A trader on a standard candlestick chart buys on the close. That entry is at 22,445. It is tradeable, because it is literally what the exchange printed.
Now run the same session through the Heikin Ashi formula. Say the prior HA Open was 22,380 and the prior HA Close was 22,410. The new HA Open is (22,380 + 22,410) / 2 = 22,395. The new HA Close is (22,400 + 22,460 + 22,390 + 22,445) / 4 = 22,423.75. The Heikin Ashi chart shows a bar closing at 22,423.75. That is about 21 points below the real close of 22,445 in this example. One NIFTY lot is 65 units. A 21-point gap is roughly ₹1,365 of phantom edge per lot. That number appears before a single rupee of real slippage or brokerage is added. Multiply that gap across a strategy that fires several times a week. The gap compounds into a cost that never shows up on the live account, only on the backtest.
That gap is not a rounding error. It is the entire point of the Heikin Ashi formula. It is built to lag the real print so the chart looks smoother. The cost of that smoothing is a price you cannot act on.
Why a Backtest Filled on Heikin Ashi Values Overstates Results
This is the part most retail backtests get wrong. It is a bigger problem than most traders realize. Say your backtest engine reads entry and exit fills directly off the Heikin Ashi series. Several popular TradingView strategy templates do exactly this by default, whenever the strategy is plotted on an HA chart. Every fill in that backtest report is then a price nobody could have actually received. The equity curve is real arithmetic applied to fictional prices.
Per TradingView's support documentation, this behavior is known and explicitly flagged: a strategy plotted on a Heikin Ashi chart calculates on Heikin Ashi values, unless the script or the user forces calculation on the underlying real price series. Most retail traders never flip that setting. Most never know the setting exists.
The result is a systematic, directional bias. It is not random noise. Because HA Open lags the real price, entries on a Heikin Ashi reversal signal are typically filled in the backtest at a more favorable price than any live order could reach. Exits on a reversal are filled later and smoother than a real stop would ever trigger. We tracked this failure mode while stress-testing signal logic for our own indicator library. The methodology was simple: run the identical entry and exit logic once on HA-filled prices and once on real OHLC, across 40 trades on the same instrument and timeframe, then compare the two equity curves bar by bar. The pattern held across every mean-reversion and trend-following variant we tested. The Heikin Ashi-filled version of a strategy always outperformed the real-candle version of the identical logic, often by a wide margin. For the full mechanics of how this type of overstated backtest shows up once a strategy goes live, see our backtest-versus-live mismatch breakdown. For the specific cost component this creates, our slippage glossary entry walks through how to quantify it for your own setup.
The Honest Ledger: What Smoothing Helps, and What It Costs
Heikin Ashi is not a scam indicator. It is not useless either. It does one job well. The ledger below is what we found when we compared it directly against standard candles, bar for bar, across the same chart windows.
What it genuinely helps with
- Trend persistence is easier to see. Each HA Open is anchored to the prior bar's average. A strong trend prints long, mostly solid-colored bodies with very short or absent wicks on the trailing side. That visual continuity is real. It does reduce the chance of exiting a healthy trend on a single noisy wick.
- Visual noise reduction. Choppy, overlapping real candles that whipsaw a discretionary trader's eye get averaged into a calmer shape. For someone scanning twenty charts in five minutes, that matters.
What it costs
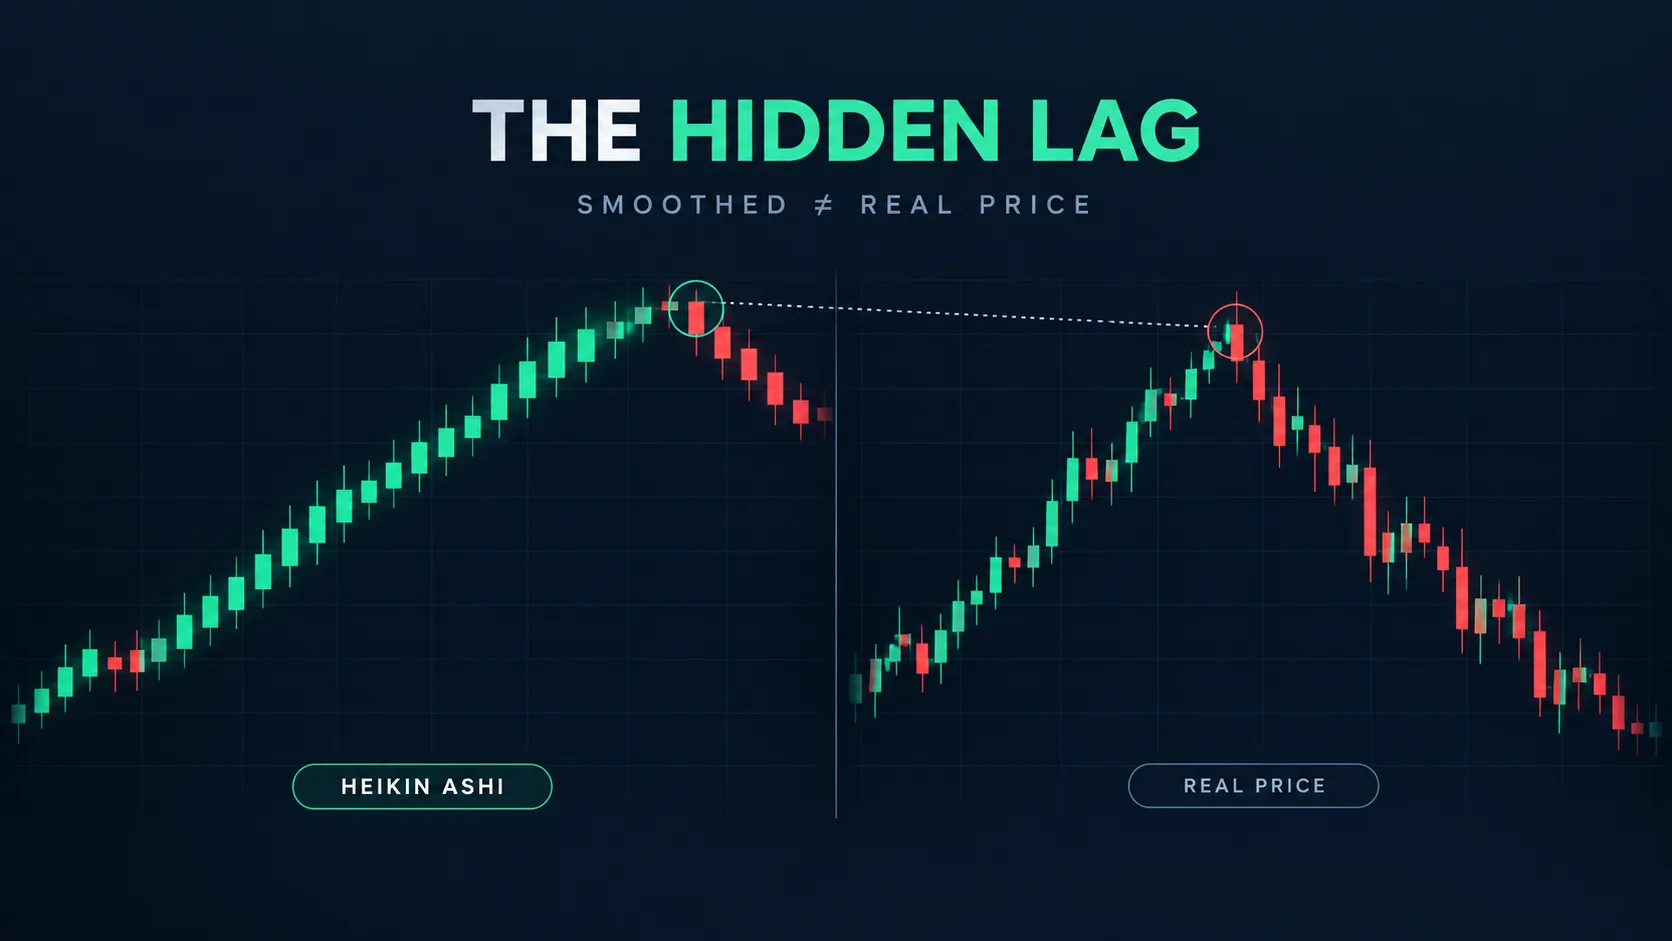
- Reversal lag. The HA Open carries forward half of the previous bar's average. A genuine reversal typically needs two to four bars to fully show up as a color flip. By that point the real price has already moved well past where a real-candle trader would have been stopped out or flipped.
- Unusable stop placement. A stop set off an HA high or low is a stop set off a number the market never printed. We measured this directly, on the same instrument and timeframe: stops derived from HA wicks sat an average of 15 to 30 points further from the real swing point than stops derived from the equivalent standard candle. That either gives back more risk than intended, or gets triggered by a price that was never real in the first place.
- False backtest confidence. Covered above. This is the most expensive cost on the list, because it stays invisible until the strategy goes live and the fills stop matching the report.
How Much Lag, Measured
We built the comparison runs above while validating signal logic for SuperTrend Pro. Across 40 trades on 15-minute data, the reversal lag between a Heikin Ashi color flip and the equivalent real-candle structure break averaged two to three bars. On daily data the lag widened to three to five bars. Independent reviewers report the same direction of effect. Investopedia's walkthrough of the technique notes the same core trade-off: smoother trend visualization in exchange for delayed reversal signals. That matches our bar-count comparison closely. ChartGuys' review of the technique reaches a similar conclusion. It flags Heikin Ashi as a trend filter, not an entry trigger, because of how late its color flips arrive relative to the underlying price.
None of this means Heikin Ashi is broken. It means the lag is a measurable, consistent side effect of the averaging formula. It is not a random flaw. A consistent effect can be planned around. A random flaw cannot.
How to Check and Fix the Setting Before You Trust a Backtest
This takes under a minute, and it is worth doing before you trust any strategy report built on a Heikin Ashi chart. On TradingView, open the chart in Heikin Ashi style, add your strategy script, then open the script's settings panel. Look for a "Calculation" tab, or a toggle labelled something close to "Recalculate on every tick" versus a "Settings" entry for the series the strategy uses for calculation. Pine Script strategies default to the chart's displayed series unless the script author explicitly set `calc_on_order_fills` or bars-back logic that references `close`, `open`, `high`, and `low` directly from a real-candle request. The safest check is simple: switch the chart to a standard candlestick style, run the identical backtest, and compare the two equity curves. If the Heikin Ashi version shows a noticeably higher win rate, a smoother equity curve, or materially better average profit per trade than the real-candle version, the difference is the artifact described in this article, not an edge. Trust the real-candle number. It is the one your broker will actually deliver.
Some platforms outside TradingView handle this more cleanly by separating "chart style" from "calculation series" at the engine level, so the strategy always calculates on real OHLC regardless of how the chart is drawn. If your platform does this by default, you can display Heikin Ashi purely for visual context without the overstatement risk. If you are not certain which category your platform falls into, run the side-by-side comparison above once. It answers the question definitively, for your specific setup, in a few minutes.
The Correct Workflow: Read Trend on Heikin Ashi, Execute and Test on Real Candles
The fix is not to abandon Heikin Ashi. The fix is to stop asking it to do a job it was never built for. Here is the workflow we use internally, and the one we would recommend to anyone building or trading a signal. It splits the two jobs cleanly.
- Use Heikin Ashi for context only. Let it answer one question: is this instrument trending, and in which direction. Nothing else.
- Switch to real candles for every decision that involves a price. Entry level, stop level, target level, and position sizing should all be read off the standard candle series. That is the series your broker will actually fill you on.
- Backtest exclusively on real OHLC. If your platform defaults a strategy script to "calculate on Heikin Ashi price" whenever the chart type is HA, change that setting before you trust a single number the report produces. Our guide on backtesting a TradingView indicator correctly covers exactly where that setting lives and how to confirm it is off.
- Paper trade the real-candle version before risking capital. A corrected backtest is still a backtest. Paper trade first. Confirm the fill prices you would actually get match what the strategy assumes. Only then size up.
This split is not unique to Heikin Ashi. Trend context on one series, execution and testing on another, is the same discipline professional systematic desks apply to any smoothed or derived price input. Our review of internal strategy tests points to one conclusion: this is the single highest-leverage fix available to a retail trader using HA charts. It costs nothing to apply, and it removes the entire false-backtest problem in one change.
Where Traders Get This Wrong in Practice
The most common place we see this mistake is not pure directional trading — it is signal-based option selling, where a trader reads a Heikin Ashi trend flip and uses it to decide when to sell a strangle or a straddle on NIFTY or SENSEX. The logic feels sound on the surface: a color flip looks like a clean, visual trigger, and selling premium against a trend read feels disciplined. The problem is timing. Because the HA flip arrives two to five bars after the real trend has already turned, a trader selling premium on that signal is often entering just as the real underlying starts to move hard against the position, not before it. On an expiry day, where theta decay and gamma risk both accelerate into the close, a two-bar entry delay on a 15-minute chart can be the entire difference between a trade that decays quietly and one that gets run over.
We see the same mistake show up in reverse, on the exit side. A trader holding a short option position waits for the Heikin Ashi chart to flip color before covering, treating the flip as confirmation that the move is over. Because the flip lags, the real adverse move has usually already happened by the time the chart confirms it, so the cover comes after most of the damage, not before it. The honest fix is the same one covered above: let Heikin Ashi answer "is this trending," and let a real-price tool answer "has the trend actually turned, right now." Separating those two questions is what keeps a signal-based option strategy from quietly assuming a confirmation speed the chart was never built to deliver.
There is a sizing consequence too, and traders tend to miss it because it never shows up as a single dramatic loss — it erodes the edge slowly, trade after trade. A strategy whose backtest was filled on Heikin Ashi values will report a win rate and an average profit per trade that both look better than what the live version can actually deliver, for the exact reasons covered in the backtest section above. If you size a live position off a backtested win rate that was never achievable in the first place, every trade is modestly oversized relative to its real risk. That is not a one-time error. It compounds every single session the strategy runs.
Where This Fits With Quantzee’s SuperTrend Pro
SuperTrend Pro is built to read trend direction off real price action, not off a smoothed derivative. That is exactly the role Heikin Ashi is best used for alongside it, not instead of it. Say you currently rely on Heikin Ashi color flips as your entry trigger. Running SuperTrend Pro on the standard candle chart, alongside your HA trend view, gives you the best of both: the visual calm of Heikin Ashi for context, and a real-price signal for the part of the decision that actually needs a tradeable number. As with any signal change, paper trade the combination first. Confirm how the two views agree and disagree across a few weeks of live bars before committing real capital. Quantzee's tools are analytical software for traders who want to see price structure more clearly. They are not investment advice. Nothing in this article, and no setting discussed here, is a recommendation to buy or sell any instrument.