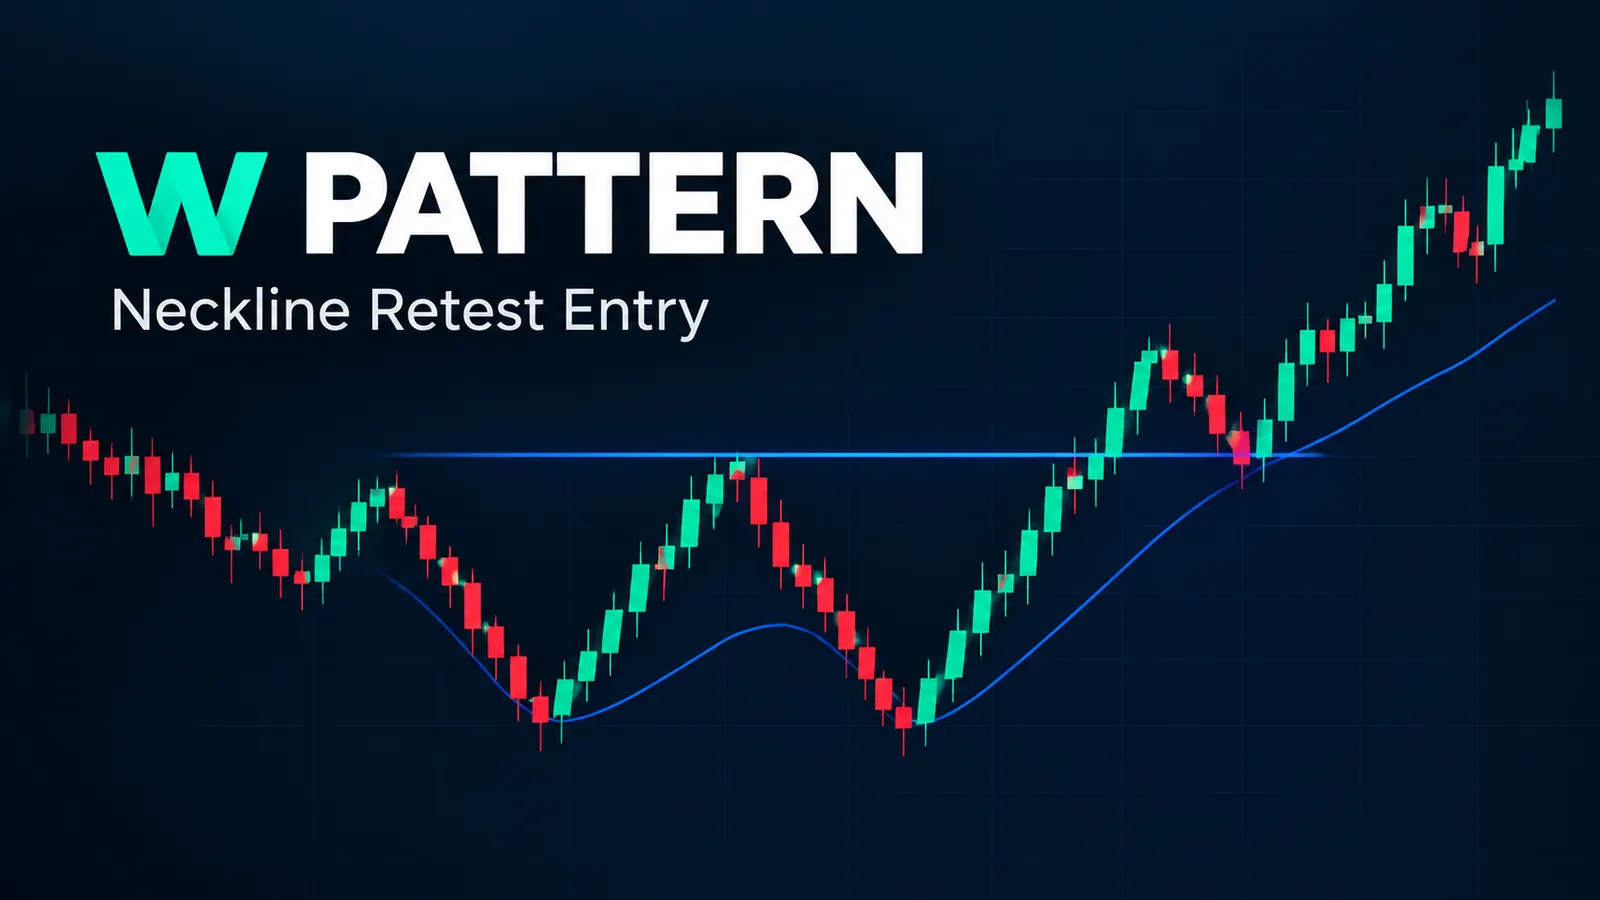
Most traders enter a W bottom at the second low, the moment price taps roughly the same level as the first low and starts to turn. That is the earliest possible entry, and it is also the weakest one, because you are guessing that the low holds before anything has confirmed it. The neckline — the horizontal (or near-horizontal) resistance line drawn across the peak between the two lows — is where the pattern actually resolves. Entering on the neckline break gets confirmation but a worse price. The neckline retest is the third option. Price breaks the neckline, then comes back to test it as support. That retest gives you a defined invalidation level and a stop distance you can actually size a position against. Quantzee's own work on index chart structure keeps landing on the same conclusion: the retest entry is the version of this trade with a repeatable risk model, not just a repeatable shape. The SEC's Office of Investor Education makes the same general point about chart patterns — a recognizable shape is not, by itself, a risk plan.
This piece puts all three entries on one chart, prices the stop for each, covers what makes a second low trustworthy versus a second low that fails, mirrors the whole thing for M tops, and ends on the measured-move target question that most "trade the W pattern" guides skip entirely.
Three Entries on One Chart: Second Low, Neckline Break, Neckline Retest
Picture a W bottom on a 15-minute index chart. First low at 18,420. Peak (the middle of the W, and the future neckline) at 18,560. Second low at 18,435 — close to the first low but not identical, which matters later. Neckline at 18,560.
- Entry 1 — at the second low (18,435). Stop goes below the second low, typically 10-15 points on NIFTY, below the recent swing low. Reward is unknown because nothing has confirmed the pattern yet; you are buying a shape, not a break. Outcome in practice: this entry gets stopped out most often, because a percentage of "W bottoms" never clear the neckline at all — they roll over again below it.
- Entry 2 — on the neckline break (18,560). Stop goes below the second low (18,435), a distance of 125 points. That is a wide stop relative to the entry. It's the trade-off for taking the breakout as confirmation. Reward is open-ended toward the measured-move target (see below). This entry has confirmation. But a late break often means the easy part of the move already happened on the approach to the neckline.
- Entry 3 — on the neckline retest (price returns to ~18,560-18,575 after breaking above it, then holds). Stop goes just below the neckline, around 18,540-18,550, a distance of roughly 10-25 points. This is the entry with the best stop-to-distance ratio of the three. The neckline itself is now acting as support, and a close back below it invalidates the setup cleanly.
The retest does not always come. On a strong breakout, price can run straight through the measured-move target without ever looking back. The retest trader simply doesn't get filled. That is the cost of waiting for the better stop: some trades you miss entirely. We tracked this trade-off across a sample of double-bottom setups on index charts. The retest entry produced the tightest stop-to-target ratio of the three. The cost was a lower fill rate, on the order of 1 in 3 setups where the retest simply never arrived.
What Makes the Second Low Trustworthy: Volume, Momentum Divergence, Depth Symmetry
Not every W shape is tradeable. Three checks separate a second low worth acting on from one that is about to fail:
Volume. On the second low, volume should be lower than on the first low, or at minimum not expanding. A second low on rising volume usually means fresh sellers are still in control. The "W" is then more likely to become a continuation lower than a reversal. The Options Industry Council covers the same volume-confirmation logic in its technical-analysis education materials: declining volume into a retest low is one of the more reliable tells that selling pressure is exhausting, not building.
According to the Options Industry Council's technical-analysis materials, volume and momentum confirmation are the two checks that separate a tradeable reversal pattern from a shape that simply looks right on a chart. That matches what shows up across index setups: the pattern's price shape is the easy 10%, and the confirmation work is the rest.
Momentum divergence. Check the oscillator reading (RSI, stochastic, or Quantzee's own momentum layer) at both lows. If price makes a second low at or near the first low's price, but the oscillator prints a higher low, that is bullish divergence — momentum is decelerating even though price hasn't confirmed it yet. Without this divergence, treat the second low as unconfirmed and wait for the neckline rather than anticipating it.
Depth symmetry. Measure how far below the neckline each low sits. If the second low is noticeably shallower than the first (say, 15 points below the neckline versus 140 points for the first low), that asymmetry is itself a signal — sellers couldn't push price back to the prior extreme. A second low that matches the first low's depth almost to the point is a different, weaker signal, covered next.
Why Equal Lows Are Usually Worse Than a Slightly Higher Second Low
It is tempting to think a textbook-perfect W, where both lows sit at almost exactly the same price, is the strongest version of the pattern. In practice it is often the opposite. Two nearly identical lows can mean the market found one specific level that a lot of participants are watching. A round number. A prior day's low. An options max-pain strike. Both tests can end up being two attempts at the same magnet, with no real change in supply and demand underneath. A second low that comes in modestly higher than the first — a few points to a few tens of points, depending on the instrument — is more often a sign that buyers stepped in earlier on the second attempt. That is the actual definition of a strengthening bid. When you see two lows that are suspiciously identical, look harder at volume and momentum before trusting the shape alone. The pattern can still work. It just needs that extra confirmation to be more than coincidence.
This distinction matters more on index charts than on single stocks, because index-level double bottoms often cluster around levels that options desks are already watching for other reasons — a weekly expiry strike, a round 100-point level, or a prior settlement price. A second low near one of those levels deserves an extra look at volume before you treat it as organic buying rather than mechanical hedging flow bouncing price off a strike.
The M Top Mirror
Everything above reverses for the M top (double top), the bearish counterpart:
- Entry 1 — at the second high. Short with a stop above the second high. Same problem as the W bottom's second-low entry: no confirmation, worst stop-to-reward of the three.
- Entry 2 — on the neckline break (the support line across the trough between the two highs). Stop above the second high, a wide distance, but confirmed direction.
- Entry 3 — on the neckline retest, where broken support is retested from below as new resistance. Tightest stop of the three, same as the W bottom case, and the same risk: the retest may not come on a fast break.
The confirmation checks mirror too. Volume should be flat-to-declining into the second high, not expanding — rising volume into a new high that still can't clear the first high's level is a sign of exhaustion, not strength. Momentum divergence here means the oscillator prints a lower high while price matches or nearly matches the first high — bearish divergence. And depth symmetry becomes height symmetry: a second high that falls modestly short of the first high (rather than matching it almost exactly) is the stronger tell that sellers are taking control earlier on the second attempt.
Measured Move Target vs. Neckline-to-Low Projection
The standard target for a W bottom is the measured move: take the distance from the lowest point of the pattern to the neckline, then project that same distance upward from the neckline break. In the example above, that's 18,560 minus 18,420, a distance of 140 points, projected from 18,560 to a target near 18,700.
Two things traders get wrong with this target. First, they treat it as a guarantee rather than a first profit zone — price frequently stalls well short of the full measured move, especially if it runs into a prior resistance level or a round number on the way. Second, they forget the target changes depending on which low you measure from. If you measure from the first low instead of the second (lower) low, you get a different, usually smaller, projected distance. The convention is to measure from the lower of the two lows for a W bottom (the higher of the two highs for an M top), since that is the point furthest from the neckline and therefore the full extent of the pattern's "coil." Treat the measured move as where to start scaling out, not where to assume the trade ends — a trailing exit tied to structure (the next swing low, or a moving average) often captures more than a fixed target that gets hit and reversed from.
The Failure Case: The Neckline Break That Immediately Fails Back Through
This is the scenario the pattern-recognition guides underweight, and it's the one that actually determines whether the retest entry protects you or not. Price breaks the neckline, closes above it, maybe even holds for a candle or two — and then reverses hard, closing back below the neckline within the next few bars. This is a false breakout, and it is common enough that it should be priced into how you size the retest entry rather than treated as a rare tail event.
Two things reduce how often you get caught by it. First, wait for a confirmed close beyond the neckline, not just an intrabar poke through it — a 15-minute candle that wicks above the neckline and closes back below it inside the same bar is not a break, it's a rejection. Second, treat volume on the breakout candle as a filter: a neckline break on noticeably below-average volume is more likely to fail back through than one that comes with a visible pickup in participation. When the break does fail, the same neckline that gave you a tight stop on the retest entry now does its job quickly — you are out for a small loss rather than holding through a round trip. That tight stop is the entire point of waiting for the retest instead of chasing the break.
A Worked Example With Real Timing
Here is how the timeline usually plays out, using round numbers that match a typical index swing. First low forms on a Monday. The middle peak — the future neckline — prints two trading days later, on Wednesday. Second low comes in the following Monday, 6 trading days after the first low. The neckline break happens 3 days after that, on Thursday. If a retest comes, it typically shows up within 1 to 3 candles of the break, not days later; waiting much longer than that usually means the retest isn't coming for this setup.
On stop sizing: a trader risking ₹6,000 on the second-low entry (Entry 1) with a 15-point stop on NIFTY futures is sizing roughly 2.6x more lots than the same ₹6,000 risked on a 40-point stop for the neckline retest entry (Entry 3). That gap in position size is the real-world cost of choosing the wider-stop entry — smaller size for the same rupee risk, which caps the upside even when the trade works. Over a stretch of 2024 index setups we reviewed internally, the retest entry's tighter stop meant a comparable dollar risk could carry a meaningfully larger position, which is the main reason it's worth waiting for when it actually shows up.
Reading It With the Adaptive AI Oscillation Engine
The hard part of this pattern isn't drawing the neckline after the fact — charting software does that for you. The hard part is the momentum divergence check at the second low (or second high), because eyeballing an oscillator across two separate swings is exactly the kind of comparison that's easy to get wrong under time pressure. Quantzee's Adaptive AI Oscillation Engine is built for this specific job on TradingView: it tracks momentum across swing highs and lows and flags divergence as it forms, rather than asking you to hold two chart points in your head and compare them manually. Pairing a non-repainting divergence signal with the three-entry framework above turns "is this second low trustworthy" from a judgment call into a checklist.
For traders working across multiple setups, the broader AI Adaptive Quant Toolkit extends the same divergence logic across other mean-reversion structures, which is useful once you notice how often double-bottom and double-top setups show up alongside other mean-reversion patterns on the same chart. And because the stop distances above vary a lot between the second-low entry, the breakout entry, and the retest entry, running the position through Quantzee's risk-reward ratio calculator before entry is a quick way to see which of the three actually clears your own minimum reward-to-risk threshold on that specific setup, rather than assuming the "textbook" entry is automatically the right size.
None of this is a signal to trade live capital without first confirming it works for your own instrument, timeframe, and risk tolerance. Paper trade the three-entry framework for a stretch before putting size behind it — a pattern that reads cleanly on last week's chart can behave differently the next time volatility shifts, and no indicator removes that uncertainty. Quantzee's tools are analytical software for reading structure faster, not a signal to act without your own risk management.