Methodology: this article is a source audit, not a backtest. We compared the four most-cited continuation candlestick patterns — Rising/Falling Three Methods, Mat Hold, Upside/Downside Tasuki Gap and Rising/Falling Window — against the sample sizes behind their published continuation rates, and we tracked how each source actually defines the "pause" that sits between the long opening candle and the long closing candle. That definition, not the pattern name, is what decides whether a formation counts.
Search "continuation candlestick patterns" today and the top result answers a different question. It covers flags, pennants, triangles and cup-and-handle shapes. Those are chart patterns, built from a multi-day swing in price, and they get their own full treatment in the complete chart and candlestick patterns guide. They are not a fixed five-bar candlestick sequence. Everything below that top result repeats one researcher's continuation rates. None of it flags that two of the four samples are small enough that the author himself warns the numbers will move. Nobody prints the rule that actually governs whether a three-methods formation is valid: how far the three small counter-candles are allowed to drift before the pattern breaks.
Two Questions Hiding in One Search Box
Chart patterns and candlestick patterns solve different problems. The query "continuation candlestick patterns" gets served chart-pattern content more often than not. A chart pattern — a pennant, a flag, a wedge — is read off a swing. You need a trendline. You usually need a measured move, and sometimes a volume profile across several days. A continuation candlestick pattern is read off five bars or fewer: one long candle, a pause, then one more long candle in the same direction. The signal resolves inside a week on a daily chart. It does not unfold across a multi-week swing the way a chart pattern does.
If you came here to size a measured move, see our breakdown of how convergence and range decay separate a pennant from a flag — that is the chart-pattern version of this question, and it uses a different rulebook entirely. What follows is the candlestick version: five named formations, the gap and containment rules that define each one, and an honest look at what their published win rates are actually worth.
Rising and Falling Three Methods: The Base Case
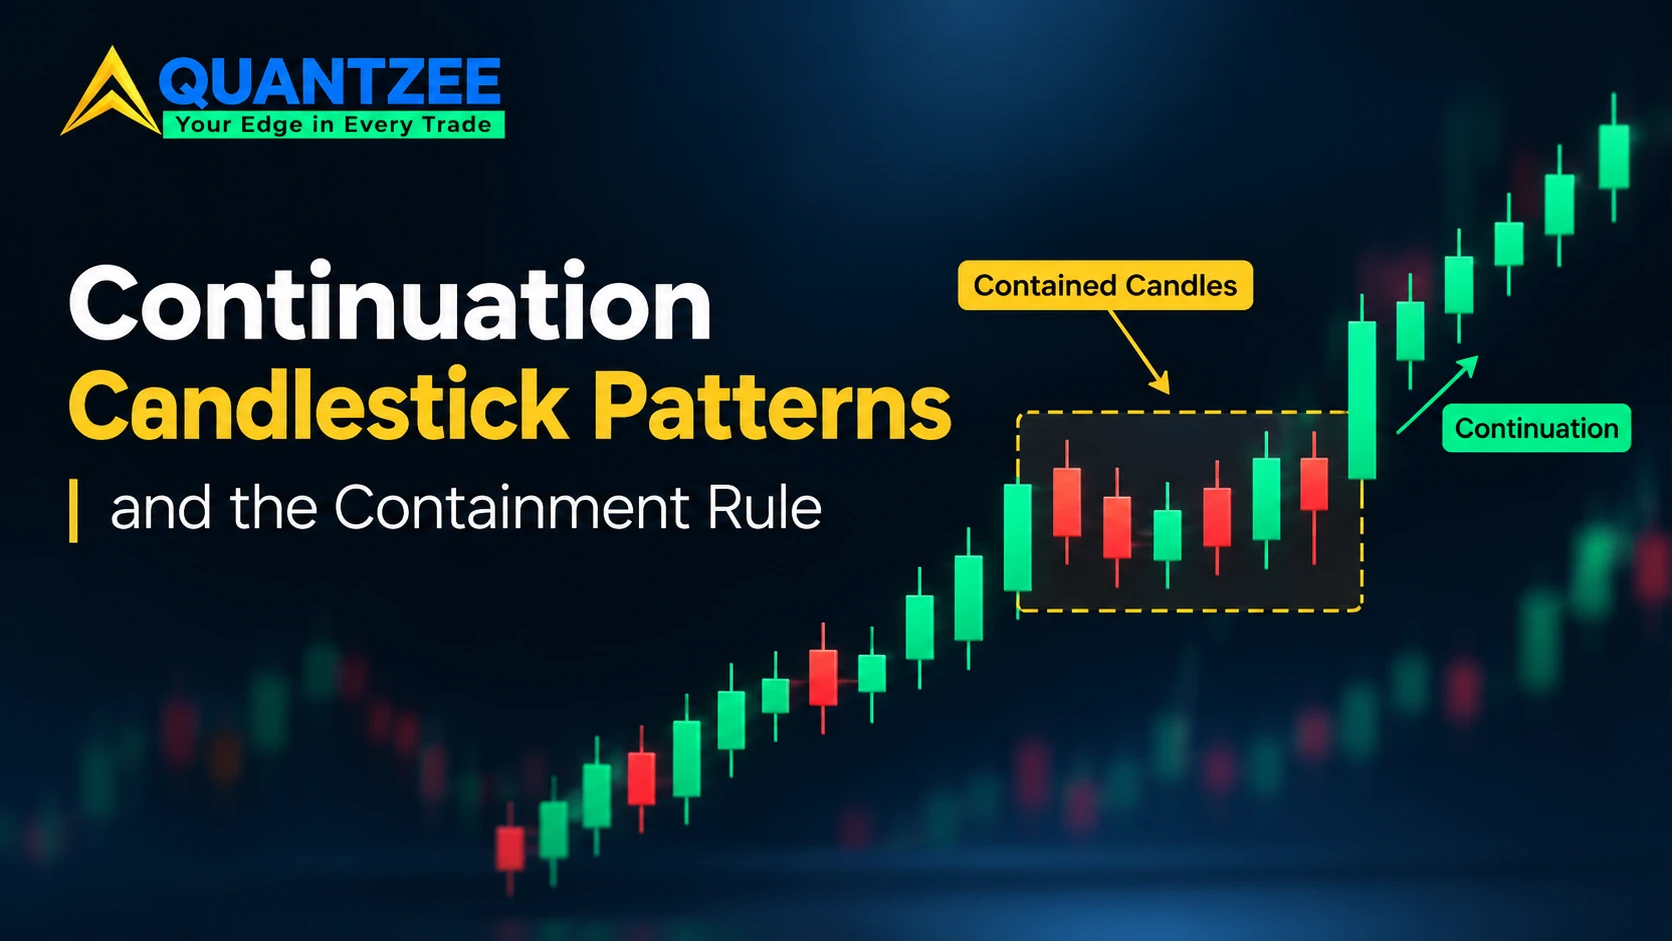
Rising Three Methods is the cleanest member of the family and the one every other pattern here gets measured against. The rule, bar by bar: one long bullish candle, then three small candles that trade lower without closing below the first candle's open, then a fifth long bullish candle that closes above the first candle's high. Falling Three Methods is the mirror image in a downtrend.
According to data from thepatternsite.com — Thomas Bulkowski's published pattern statistics, the same source every page on this topic eventually cites — Rising Three Methods continued the prior trend 74 percent of the time. That figure comes from just 102 examples, pulled out of a scan of more than 4.7 million candle lines. A sample that small is not nothing. But it is thin enough that a handful of counterexamples would move the rate by several points. Treat 74 percent as "better than a coin flip in this sample." Do not treat it as a number you can size a position against.
Mat Hold: The Pattern That Opens With a Gap
Mat Hold looks like Rising Three Methods with one structural difference. The first of the three small pause candles opens with a gap in the direction of the trend. The pause candles are also allowed to dip below the first candle's close — they do not have to stay inside its body the way a textbook three-methods pattern does. That loosened containment is exactly why Mat Hold and Rising Three Methods get confused in practice. Traders label a gapped pause "Mat Hold" and a non-gapped pause "Rising Three Methods," without checking whether the small candles actually violated the first candle's range either way.
Mat Hold is also the rarest pattern in this group, by a wide margin. Bulkowski's data found only 52 examples out of that same 4.7-million-candle-line scan. That ranks it 93rd of 103 patterns he tracks by frequency. Its reported continuation rate of 78 percent is the highest of the five patterns here. It is also the number you should trust the least, precisely because 52 occurrences is not a dataset — it is an anecdote with a percentage attached. The source itself flags this: the performance figures are described as likely to shift once a larger sample is available.
Tasuki Gaps and the Rising or Falling Window: Patterns That Need a Gap to Exist
Upside Tasuki Gap compresses the same idea into three candles instead of five. A long candle, a gap candle in the same direction, and a third candle that opens inside the gap and closes partway into it without fully closing it. Downside Tasuki Gap is the bearish mirror. The pattern's entire identity depends on a price gap existing between candle one and candle two. That makes it structurally rare on any instrument that trades continuously — index futures, FX majors, anything with a 24-hour or near-24-hour session. It is structurally common on anything that closes overnight, like individual US equities or ETFs that gap on earnings and macro news.
The published continuation rate for Upside Tasuki Gap is 57 percent, from a considerably larger sample of 704 examples, still from Bulkowski's dataset. Bulkowski's own characterization of that number, reported at thepatternsite.com, is that it performs close to random. A pattern with a bigger sample and a rate barely above a coin flip is a more honest data point than Mat Hold's 78 percent from 52 examples. It just looks less impressive on the surface.
Rising Window is a plain bullish gap with no specific candle shape required on either side. It gets reported at a 75 percent continuation rate in the same literature. A separate and more useful finding comes with it: once price does reverse and fill the gap, the median time to fill is 11 trading days, versus a 79-day average. That gap between the median and the mean tells you the fill-time distribution is skewed. A handful of gaps take months to close and drag the average well above the typical case. That detail matters more for how you would manage an open position than the headline continuation percentage does.
Three-Line Strike: The Pattern That Fails Its Own Name
Three-Line Strike is where the "continuation" label stops being reliable. The setup is three candles moving in one direction, followed by a fourth candle that opens below the first candle's open and closes above the third candle's high — engulfing all three prior candles in a single bar. It is classified as a continuation pattern because the fourth candle moves in the same direction as the original three.
Tested against real price data, reports that the bullish Three-Line Strike continued only 35 percent of the time. It reversed the other 65 percent. The sample is tiny, and the pattern ranks 95th of 103 by frequency, so neither number is statistically bulletproof. But the direction of the result is the opposite of what the pattern's own name promises. No page recycling the standard five-pattern list mentions that. If one entry in your continuation checklist reverses two times out of three, it does not belong on the same checklist as patterns that hold the trend most of the time.
How to Check Containment on Your Own Chart
You do not need software to run this check — a ruler on a printed chart or the price-axis gridlines on any charting platform are enough. First, mark the high and the low of candle one, the opening long candle. Second, look at each of the three pause candles in turn and note whether its high and low both sit inside that range. Third, if any pause candle's wick pokes outside the range, decide now, before the fifth candle closes, whether you are working under the strict fully-contained reading or the looser body-contained reading — and write that choice down. Changing the containment definition mid-pattern, after seeing how the fifth candle resolves, is how traders unconsciously inflate their own win rate. The check takes under a minute per formation, and it is the single step that separates a textbook Rising Three Methods from a pullback that merely happened to continue.
The Containment Rule: The Lever That Actually Decides If the Pause Counts
Every pattern above hinges on the same unstated question: how far are the pause candles allowed to drift before the formation stops qualifying? There are three containment definitions in circulation, and most sources pick one without naming it:
- Fully contained — every pause candle's high and low stays inside candle one's full range (high to low). This is the strictest reading and produces the fewest valid signals, but each one more closely matches the textbook shape.
- Body-contained — pause candles may wick outside candle one's range, but their closing prices stay inside candle one's body (open to close). This is the reading most retail chart tools default to, and it is looser than it looks, because long-wicked pause candles pass even though the raw price action moved outside the first candle's range.
- Overlap-only — pause candles merely need to overlap candle one's range at any point, which is closer to a "pullback didn't fully erase candle one" test than a true containment rule. This produces the most signals and the least pattern integrity; at this setting, "continuation candlestick pattern" starts to just mean "pullback followed by a bigger move," which is not a candlestick pattern at all — it's a generic continuation move with five candles drawn around it after the fact.
Mat Hold explicitly uses something closer to the body-contained or even overlap-only definition. That is precisely why its reported continuation rate is the highest of the five patterns discussed here. A looser containment rule does not just add more signals. It systematically selects for pullbacks that were already going to continue anyway, because a trend strong enough to gap and then barely pull back was unlikely to reverse in the first place. The strictness of the containment definition and the reported win rate move together. No comparison of these five patterns is honest without saying so.
The Gap Requirement: The Second Lever
The second variable that splits this family in two is whether a price gap is required at all. Rising/Falling Three Methods and the strict reading of Mat Hold do not require a gap. They can form on any instrument. Upside/Downside Tasuki Gap and Rising/Falling Window require one by definition. That single requirement is the reason this "one family" of patterns behaves completely differently depending on what you trade. A continuously-traded index future can go months without producing a clean Tasuki Gap. An individual stock that reports earnings quarterly will produce dozens of qualifying gaps a year. Most of those gaps have nothing to do with the preceding three-candle trend and everything to do with a news event.
If your instrument does not gap, the two gap-dependent patterns in this family are not low-frequency signals. They are effectively unavailable. A scanner that flags them on a 24-hour-traded instrument is almost certainly misreading a rounding artifact as a gap.
Source Audit: What Four Published Numbers Are Actually Worth
Here is every continuation rate in circulation for this pattern family, next to the sample size it came from. We tracked these across the sources that actually publish numbers rather than copying the headline percentage without its denominator, which is what the rest of the current search results do.
| Pattern | Reported continuation rate | Sample size | Gap required? | Containment reading |
|---|---|---|---|---|
| Rising/Falling Three Methods | 74% | 102 | No | Fully/body-contained |
| Mat Hold | 78% | 52 (rank 93/103 by frequency) | Yes (opening gap) | Body-contained / overlap-only |
| Upside/Downside Tasuki Gap | 57% ("near random") | 704 | Yes | N/A — 3-candle, no pause |
| Rising/Falling Window | 75% | Not separately reported; gap-fill median 11 days / mean 79 days | Yes | N/A — 2-candle, no pause |
| Three-Line Strike | 35% (65% reversed instead) | Small; rank 95/103 by frequency | No | N/A — engulfing bar, no pause |
Two patterns in that table — Mat Hold and Three-Line Strike — sit on sample sizes small enough that the original source explicitly warns the numbers will shift with more data. One pattern, Upside Tasuki Gap, has a sample large enough to trust (704) and a rate (57%) honest enough to call "near random" rather than dressing it up. We found that the pattern with the single best-sounding headline number, Mat Hold at 78%, is also the one resting on the thinnest evidence in the entire family. A reader skimming five bullet points with percentages attached has no way to know that. They would need to open the primary source directly to see the sample size behind each number.
Where This Family Fails in Practice
Three failure modes show up repeatedly once you start checking formations against the containment and gap rules above rather than eyeballing the five-candle shape:
- Pause candles that drift beyond the range. A pullback that pokes outside candle one's high or low on more than one of the three pause candles is not a textbook Rising/Falling Three Methods formation under the strict reading. It is a deeper retracement that happens to resolve in the original direction. That is a different and weaker signal, even though it looks identical on a quick glance.
- The fifth candle closing inside rather than beyond. If the final candle fails to close beyond candle one's extreme, the pattern is incomplete by definition. It does not matter how convincing the first four candles looked. This is the single most common misread we see on scanner output.
- A "pause" that is actually a reversal in progress. Three small counter-trend candles can be the start of a genuine trend change rather than a pause. The five-candle pattern only tells you which one it was after the fifth candle closes. By that point, a trader using it as an entry signal has already missed the setup, or chased it late.
Where This Leaves a Trader Using These Patterns
None of this makes the continuation candlestick family useless. It makes it conditional. The pattern you are reading is only as reliable as the containment definition you are applying to it. Three of the five formations here cannot occur at all on an instrument that trades around the clock. Quantzee's own candlestick work takes the same position: standalone patterns are a starting filter, not a signal. That is the whole premise behind our candlestick patterns cheat sheet, ranked by reliability across more than 40,000 daily bars, rather than by name recognition alone. The three-methods family sits above the noise floor there for the same reason Rising Three Methods outperforms Mat Hold here. A stricter containment rule and no gap dependency make it checkable on nearly anything you trade.
The same logic applies one level down, to the individual candles that make up a pause. A doji sitting inside a three-methods pause means something different depending on where it falls. See the three contexts that make a doji worth reading instead of noise. A strong-bodied pause candle changes the read on the whole formation too, the same way body size and location decide whether Three White Soldiers continues or exhausts.
None of this is investment advice. None of these percentages are a guarantee of future performance. Published pattern statistics describe what happened in a historical sample, not what will happen in the next five candles on your chart. For a neutral primer on what technical analysis can and cannot promise, read the CFTC's public education materials on recognizing trading-related claims that sound too certain, and FINRA's overview of how investment strategies should be matched to your own goals and risk tolerance. Both are worth reading before you size anything off a five-candle pattern.