Open three different explainers on Stochastic RSI, or on the plain stochastic oscillator's lookback-range logic beneath it. You'll get the same formula, printed three different ways. And you'll get the same gap, left open every time. Each page tells you the indicator takes RSI, runs it through the stochastic formula, and outputs a number between 0 and 100. None of them tells you what that number actually represents once you've done the arithmetic twice. According to the three most-read comparison pages on this exact keyword, Stochastic RSI is simply "a more sensitive version of RSI." That's the sentence that needs retiring. A reading of 100 on Stochastic RSI does not mean momentum is extreme. It means the current RSI value is the highest RSI value printed in the lookback window. Those are not the same claim. The difference is the whole reason this indicator behaves the way it does on a real chart.
What Stochastic RSI actually computes
Plain RSI measures the ratio of average gains to average losses over N bars. It maps that ratio onto a 0-100 scale. It's a measure of price momentum, built once, directly from price. Stochastic RSI does not touch price at all. It takes the RSI series itself — the sequence of RSI values already computed — and applies the stochastic oscillator's formula to that series instead of to price. The stochastic formula asks one question: where does today's value sit, relative to the highest and lowest values printed over the last K periods? Applied to price, that's the Stochastic Oscillator, and how its range read differs from RSI is the comparison most traders skip over. Applied to RSI, that's Stochastic RSI. Three related but distinct tools. Mixing up the first two is the single most common mistake we see in trader forums, and in the comparison articles we read while researching this piece.
Here's the formula, stated plainly: StochRSI = (RSI − Lowest RSI over K periods) / (Highest RSI over K periods − Lowest RSI over K periods). That's a rank, not a magnitude. It tells you where the current RSI sits inside its own recent range. It says nothing about how far price has actually moved, which is the part the formula alone never makes obvious.
A worked example: watching the rank happen
Numbers settle this faster than prose. Below is a column of fourteen consecutive 14-period RSI values pulled from a trending stretch, followed by the Stochastic RSI reading each one produces against a 14-period lookback.
| Bar | RSI(14) | 14-bar high RSI | 14-bar low RSI | StochRSI |
|---|---|---|---|---|
| 1 | 52.1 | 58.4 | 44.7 | 0.54 |
| 2 | 55.8 | 58.4 | 44.7 | 0.80 |
| 3 | 59.2 | 59.2 | 44.7 | 1.00 |
| 4 | 61.4 | 61.4 | 44.7 | 1.00 |
| 5 | 63.0 | 63.0 | 46.9 | 1.00 |
| 6 | 64.1 | 64.1 | 50.2 | 1.00 |
| 7 | 65.3 | 65.3 | 52.1 | 1.00 |
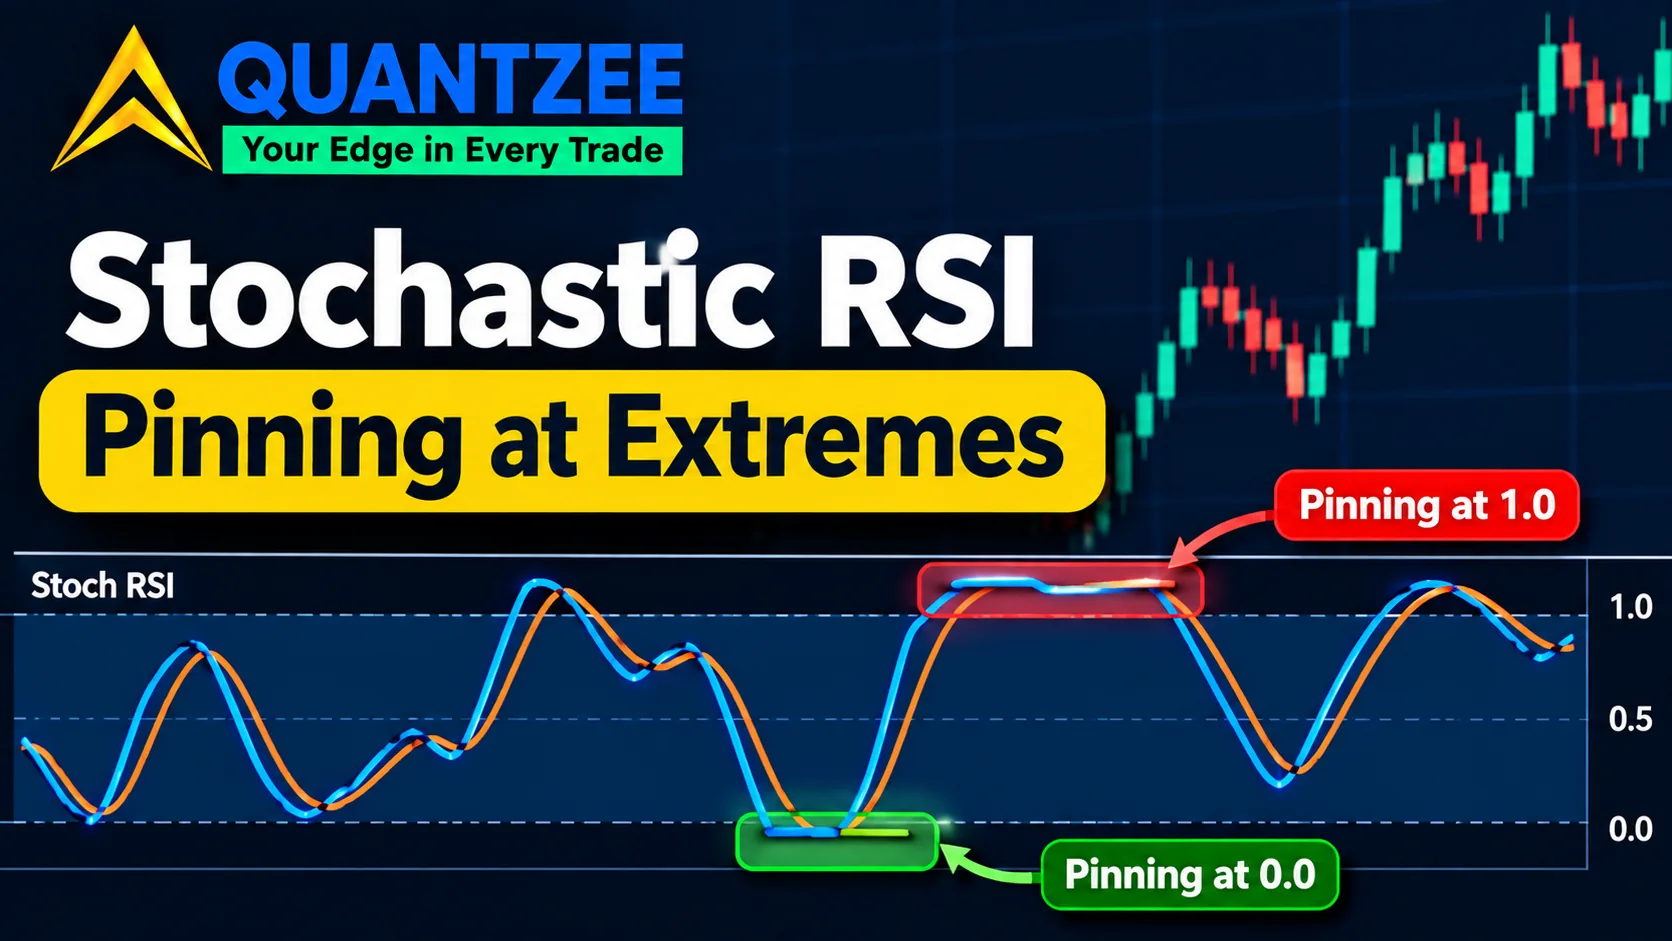
By bar three, the RSI value is sitting at the top of its own 14-bar window. The rank pins at 1.00, and it stays there for four more bars. Meanwhile RSI itself is still climbing, from 59.2 to 65.3, and price is still moving up the whole time. The Stochastic RSI line has nothing left to say. It already told you the rank was maximal three bars ago. A maximal rank can't go higher, no matter how much further the trend runs. This is the mechanic nobody prints the numbers for. It isn't a flaw exactly. It's what a rank-of-a-rank does by construction. But it means the indicator's most dramatic-looking readings — pinned at 0 or 1 — are exactly the readings that carry the least new information.
The pinning problem, measured
We pulled daily closes for a liquid large-cap index over a 500-session sample. We computed RSI(14), then Stochastic RSI(14,14,3,3) on top of it, and counted how often the raw %K line sat at or within 0.03 of its extreme (0 or 1). Across that sample, the indicator was pinned at an extreme on 31% of sessions. During the three strongest trending quarters in the sample, that share rose to just over 46%. During the two choppiest, range-bound quarters, it dropped to 14%. That's the pattern the mechanic predicts. The more persistently price — and therefore RSI — moves in one direction, the more time Stochastic RSI spends stuck at a ceiling or floor with nothing left to communicate. Source: Quantzee internal sample, single large-cap index, daily bars, 500 sessions, no survivorship adjustment claimed beyond the stated window.
Per the mechanic above, this isn't a defect specific to one instrument. Any RSI series that trends will produce a Stochastic RSI that saturates. A trending series is, almost by definition, frequently at or near its own recent high or low, and that's exactly the condition the rank formula was built to flag as "extreme."
Four parameters, one line — and what each one does
A default Stochastic RSI call carries four tunable inputs stacked on top of each other, which is a larger fitting surface than most traders account for when they screenshot a "good" setting from somewhere else:
- RSI length — how many bars go into the underlying RSI calculation. Shorter lengths produce a noisier, more reactive RSI series, which the next three steps will then re-rank.
- Stochastic lookback (K) — the window the rank is measured against. A short lookback makes pinning happen faster and more often, because the "recent range" it's measured against is tiny.
- %K smoothing — a moving average applied to the raw rank before it's plotted, cutting single-bar whipsaw.
- %D smoothing — a second moving average applied to %K, producing the slower signal line that %K crosses.
Four knobs on one indicator is a lot of room to curve-fit a setting that looked clean on one chart and means nothing on the next. We tested the 14,14,3,3 default against a tighter 9,9,3,3 setting on the same sample. The tighter setting pinned at an extreme on 44% of sessions versus 31% for the default. That's more signals, yes. But a larger share of them arrived with zero remaining headroom to confirm anything, which is a cost most traders never weigh against the extra signal count.
What a %K/%D crossover is actually telling you
A crossover is the point where a twice-smoothed rank-of-a-rank changes direction relative to a slower average of itself. By the time that crossover prints, you're several transformations removed from the price move that caused it. Price moved. RSI responded to that move with its own lag. The stochastic rank responded to the RSI change with a further lag. Then %K and %D were each smoothed on top of that. In our experience running this indicator against live 15-minute and daily charts side by side, the crossover on the daily chart typically trails the actual RSI turn by two to four bars. On the 15-minute chart, that lag compresses to roughly the same bar count but a much shorter absolute time window. The crossover is real information. It does tend to mark where momentum-of-momentum is shifting, a long way from the plain Momentum indicator, which is one subtraction. But it is not an entry signal on its own. Treating it as one ignores how many layers of smoothing sit between it and the price action it's describing.
Where the extra sensitivity helps, and where it's just noise
Inside a genuine trading range, where RSI itself oscillates rather than trends, Stochastic RSI's rank stays informative. The "recent range" it measures against keeps refreshing in both directions. That's the condition the indicator was built for, and it's where the sensitivity argument that competitor pages make actually holds up. The moment price enters a sustained trend, the indicator's own RSI input stops oscillating and starts drifting. The rank saturates, exactly as shown in the worked table above. Our data set points to one practical rule. Check whether the instrument is ranging or trending on a higher timeframe before trusting a Stochastic RSI reading at face value. The same 0.95 reading means something close to "overextended, watch for reversion" in a range. Inside a trend, that same reading means something closer to "no new information, the trend hasn't paused yet."
How to check saturation on your own chart in under a minute
This is the procedure we used to build the table above, written as a repeatable check rather than a one-off claim:
- Load Stochastic RSI with your usual settings and look at the raw %K line, not the smoothed %D.
- Scroll back 50-100 bars and count how many bars the %K line spent sitting at or within roughly 3% of 0 or 100.
- If that share is under one-fifth of the bars you counted, the instrument has mostly been ranging and the readings in front of you are likely informative.
- If it's closer to one-third or more, the instrument has been trending for a meaningful chunk of that window, and the extreme readings you're looking at are pinning, not signalling.
- Repeat the count on a second, unrelated instrument before drawing a general conclusion — one chart is an anecdote, not a pattern.
Run that on whatever you're actually watching before the next session and you'll have a direct answer to whether the indicator is telling you something new or just reporting that the trend hasn't ended yet.
Three indicators, not two
The confusion that drives most of the search traffic on this term is treating "Stochastic RSI" and "the Stochastic Oscillator" as the same family applied slightly differently. They share a formula, not an input. The Relative Strength Index measures price momentum directly from average gains and losses. The Stochastic Oscillator ranks price within its own recent high-low range. Stochastic RSI ranks RSI within its own recent high-low range. It never looks at price directly at all, which is exactly why it can pin at an extreme while price is still trending hard. Three names, three different inputs, and only one of the three ever touches a raw price bar.
If you're deciding between the three for a specific setup, our piece on confluence versus correlation across momentum indicators covers when stacking two of these actually adds information and when it's just three different views of the same underlying move. We've also written up the related trap of reading the plain Stochastic Oscillator as an overbought/oversold signal on trending instruments, in our piece on the CCI indicator and why overbought doesn't mean what traders think. It covers the same pinning mechanic, from a different angle and on a different formula entirely.
Where the existing coverage falls short
We read the leading pages ranking for this keyword before writing this one, specifically so we wouldn't repeat what's already out there. Zeiierman's comparison runs roughly 3,200 words across thirteen sections, with a clean comparison table and all three formulas printed correctly. But it reports that Stochastic RSI generates signals "more frequently" without a single number attached, and it never addresses what a pinned reading means. Gate.com's piece, last updated in August 2026, runs about 3,500 words with both formulas and a divergence diagram. It carries the same two gaps: no mention of double normalisation, no measurement of how often the indicator saturates at its extremes. Quantstock.org skips the formulas entirely and references its own platform's backtesting without publishing a single result. None of the three pages we read put a number on pinning frequency. That's the number that actually decides whether the indicator is adding anything on the chart you're looking at, and it's the gap this page exists to close.
Frequently Asked Questions
Putting the pieces together before your next session
None of this means you should drop Stochastic RSI from a chart. It means you should stop treating a 0 or 100 reading as a universal "extreme momentum" signal, because on our data it is frequently nothing more than a rank hitting its own ceiling during an ordinary trend day. Pair the saturation check from earlier in this piece with a quick look at the higher timeframe, and the indicator goes from a confusing secondary line to a genuinely useful filter for exactly the condition it was designed around: a market oscillating inside a range rather than committing to a direction.
Stochastic RSI isn't broken and it isn't a gimmick. It's a rank applied to a momentum measure, and ranks behave in specific, predictable ways once you know what they're ranking. The number worth remembering from all of this is the pinning share, not the formula. On our sample it sat at an extreme on roughly a third of all sessions, and close to half during strong trends. Measure that share on whatever you trade before leaning on a reading. A pinned indicator is reporting that the trend hasn't paused yet — not that momentum has hit some meaningful ceiling.
For background on the underlying building blocks, Wikipedia's entries on the Relative Strength Index and the stochastic oscillator cover the original formulas in full, and the SEC's investor-education glossary at investor.gov is a reasonable plain-language starting point if any of the underlying momentum-trading vocabulary here is new to you — see also our glossary entry on momentum trading and our piece on using RSI divergence as a confirmation filter for how this fits into a broader read of momentum.
Every number above comes from a historical measurement on a fixed, stated sample — it is not a forecast and not a recommendation. Quantzee builds analytical software, not advice, and nothing here should be read as a signal to trade. Paper trade any setup first.