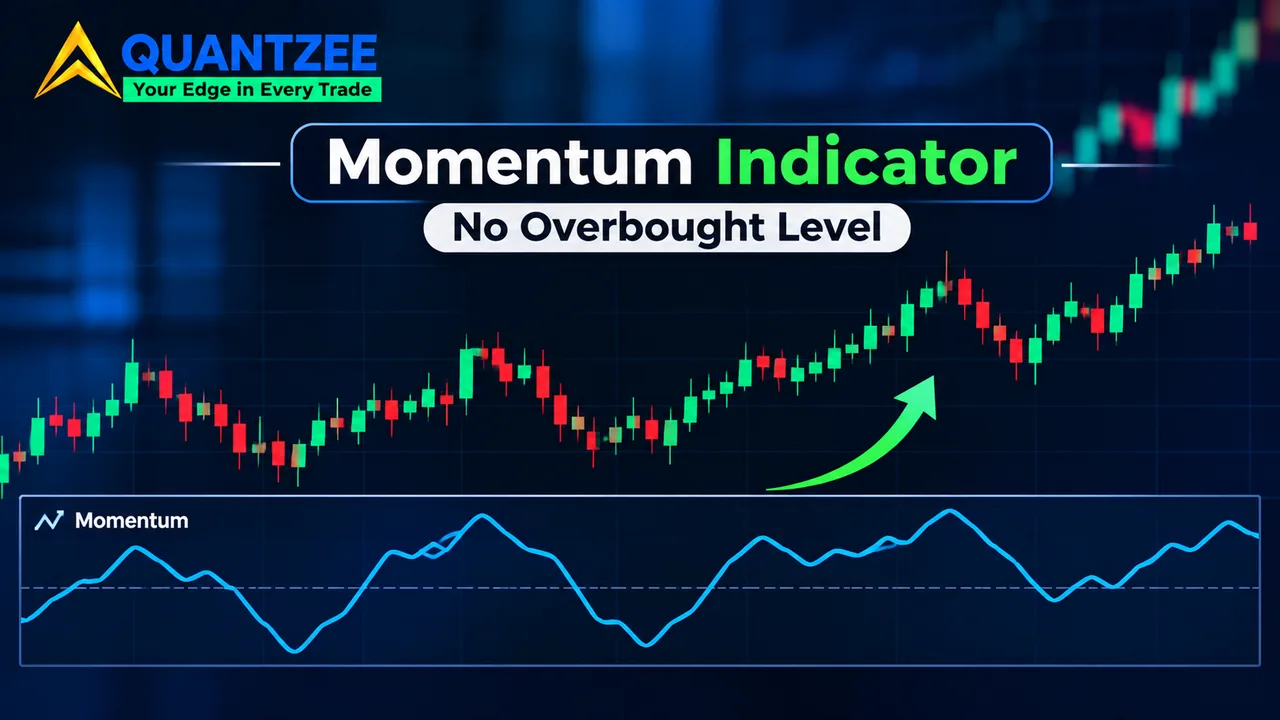
Search for a momentum trading indicator and you'll find two kinds of page. One is a tour of RSI, MACD and Stochastic. The other gives you "buy above 70, sell below 30" as if it were a property of the indicator called Momentum. Neither is describing the actual Momentum indicator, which is a single subtraction, and which has no 70 and no 30.
This post separates the two. It gives the formula, explains why the output can't have an overbought line, and shows the one fix that makes a threshold portable. The arithmetic is run on real daily bars for three funds, so you can check every number.
What the Momentum indicator actually calculates
Momentum compares today's close with the close n bars ago. That's the whole indicator. With n = 10, the reading on a given day is the close on that day minus the close ten trading days earlier.
Two forms circulate, and they look different on a chart even though they carry the same information.
- Subtraction form: Momentum = Close(today) − Close(n bars ago). It is centred on zero and quoted in the instrument's own price units. Most charting platforms plot this one.
- Ratio form: Momentum = Close(today) / Close(n bars ago) × 100. It is centred on 100. According to the MetaTrader 5 help pages (accessed 6 November 2026), this is the definition that platform uses: "MOMENTUM = CLOSE (i) / CLOSE (i - n) * 100".
Same data, two lines. A stock that closes at 733.00 against 763.96 ten bars ago reads −30.96 in the first form and 95.95 in the second. One sits below zero and the other below 100, so a screenshot from one platform can look like a contradiction of a screenshot from another when it isn't.
The practical lesson: before you copy anyone's setting, find out which form their chart is plotting, and what length it uses.
Why a momentum trading indicator in points has no overbought level
RSI is bounded. It is built so the output can't leave a 0 to 100 box, which is why 70 and 30 mean something: they're fixed fractions of a known range. Momentum has no box. A ten-bar change in points can be 5 on a quiet fund and 500 on an expensive index, and nothing in the formula caps it.
So when a page says "Momentum above 70 is overbought," it has borrowed a threshold from a different indicator. On a 700-dollar fund, 70 points is a 10 percent move in two weeks. On a 40-dollar stock it's almost two times the price. The same number describes completely different events.
The MetaTrader documentation says as much in its own way. It reads extreme high or low Momentum values as continuation of the current trend, not as a reversal warning. That is the opposite of the overbought logic attached to this keyword elsewhere.
The CCI has a similar reputation problem: its ±100 lines are widely sold as exhaustion marks and were designed for something else. We covered that in our breakdown of what CCI's ±100 lines actually mark. Same pattern, different indicator.
A worked example: the same 70-point line on three funds
Methodology
We pulled one year of daily bars (6 November 2025 to 5 November 2026, 251 sessions) for SPY, QQQ and GLD from Yahoo Finance's public chart data on 6 November 2026. We computed ten-bar Momentum in the subtraction form on the raw close, which gives 241 readings per fund. Average true range uses a plain 14-bar average of true range, not Wilder smoothing. All figures below come from that sample of 241 readings per fund. This is a description of one year of history, not a test of any trading rule.
The raw readings
Here's the most recent ten-bar reading for each fund, ending 5 November 2026 and starting from the 22 October 2026 close.
| Fund | Close, 22 Oct | Close, 5 Nov | Momentum (points) | Ratio form |
|---|---|---|---|---|
| SPY | 763.96 | 733.00 | −30.96 | 95.95 |
| QQQ | 704.47 | 647.05 | −57.42 | 91.85 |
| GLD | 369.00 | 375.49 | +6.49 | 101.76 |
QQQ's −57.42 looks nearly twice as bad as SPY's −30.96. In percent it's −8.15 against −4.05, so about twice as large, and that gap is real: QQQ simply moved more. GLD's +6.49 looks tiny next to both, yet it's a 1.76 percent gain.
Now take the whole year. Across 12 months of readings, the range of the ten-bar line was:
- SPY: −37.06 to +62.49 points
- QQQ: −57.42 to +70.32 points
- GLD: −73.73 to +72.93 points
Put a fixed line at +70 on all three. It would have fired once on QQQ, once on GLD and never on SPY. Same number, same year, three different frequencies. A line at +70 tells you nothing about how stretched any of them were. It only tells you which has the biggest share price and the widest swings.
Normalise the reading before you set a threshold
Two divisions fix the scale problem. Both are plain arithmetic.
Divide by price: percent change
Divide the points reading by the close ten bars ago. For SPY: −30.96 / 763.96 = −4.05 percent. For QQQ: −57.42 / 704.47 = −8.15 percent. For GLD: +6.49 / 369.00 = +1.76 percent. Across the year, ten-bar percent change ran from −5.54 to +9.89 on SPY, −8.15 to +12.6 on QQQ and −15.43 to +17.3 on GLD. A "plus 8 percent" line now means the same thing on every instrument in price terms, though not in volatility terms: 8 percent is a rare event for SPY and an ordinary fortnight for GLD in this sample.
Divide by ATR: volatility units
The ATR division handles that second problem. Take the points reading and divide by the 14-bar average true range. Our own calculation gives:
- SPY: ATR(14) = 10.97, so −30.96 / 10.97 = −2.82
- QQQ: ATR(14) = 16.42, so −57.42 / 16.42 = −3.50
- GLD: ATR(14) = 6.44, so +6.49 / 6.44 = +1.01
Read the units: "SPY's ten-bar change is minus 2.82 average daily ranges." Now the instruments are comparable. Across the year the ATR-scaled line ran −3.71 to +6.10 on SPY, −4.14 to +5.77 on QQQ and −6.73 to +7.84 on GLD. These spreads are far closer to one another than the raw point ranges were, though still not identical. A threshold such as "two ATRs" can at least be reasoned about across all three. Our glossary entry on average true range covers how ATR is built if you want the details.
One caution. A normalised threshold is portable, but it isn't evidence of anything. We haven't tested a rule built on it, and we won't pretend a number from three funds in one year is an edge.
What the zero line means, and what it doesn't
Above zero, today's close is higher than the close n bars ago. Below zero, it's lower. That's all. Crossing zero doesn't say the trend "turned"; it says the close n bars back is now at the same level as today's close.
Two situations look alike on the chart and aren't:
- A rising Momentum line while price rises: the gains of recent bars are bigger than the gains of the bars that dropped out of the window. Price is accelerating.
- A falling Momentum line while price still rises: recent gains are smaller than the ones leaving the window. Price is still going up, just more slowly. The line can even cross zero while price sits near a high, if the gain from n bars ago was large.
That second case is where beginners get hurt. The indicator is a speed reading, not a direction reading.
Lookback length: short n against long n
A short n, say 5, measures what happened this week. It flips sign often and reacts to a single big bar. A long n, say 20 or 30, smooths noise but lags, and it reflects an old event for a full n bars after the fact.
There's a mechanical quirk worth knowing. Momentum only compares two closes. When one very large bar leaves the n-bar window, the line drops by that bar's size in a single step, even if nothing happened on the current day. A cliff in the line is often a bar leaving the window, not a market event.
An n that works on one instrument won't transfer. A fund with a 14-bar ATR of 10.97 and a fund with 6.44 don't have the same natural rhythm, so a length tuned on one is a guess on the other. Normalising helps with scale but not with rhythm.
Momentum against ROC, the MACD histogram and bounded oscillators
| Indicator | What it measures | Bounded? | Unit |
|---|---|---|---|
| Momentum (subtraction) | Close minus close n bars ago | No | Price points |
| Momentum (ratio form) | Close ÷ close n bars ago × 100 | No | Index around 100 |
| Rate of change | Percent change over n bars | No | Percent |
| MACD histogram | Fast EMA minus slow EMA, minus signal line | No | Price points |
| RSI | Average gains against average losses | Yes, 0 to 100 | Index |
Rate of change is the percent version of Momentum, which is the first normalisation above wearing a different name. The MACD histogram is built from moving averages, so it smooths where Momentum uses raw closes. RSI is the only one in the table with a floor and a ceiling, so it's the only one where 70 and 30 have a fixed meaning. If you want the bounded view, our RSI glossary page sets it out.
Divergence on an unbounded line
The textbook case: price makes a higher high while Momentum makes a lower high. It tells you the latest push was slower than the one before. Per the MetaTrader help page, divergence between the indicator and price is one of the two intended uses.
On a bounded oscillator, a lower high is compared against a fixed ceiling, so "slightly lower" is easy to see. On an unbounded line there's no ceiling to compare to. Whether a peak of 41 points is "lower" than a peak of 44 depends on how far back you look and on how the y-axis auto-scales. The signal is softer, and two people can draw different divergences on the same chart. Our approach is to treat a divergence as a note that speed has faded, not as a trigger.
The trend failure mode
In a steady uptrend, Momentum can fall for many bars while price keeps setting new highs. That happens whenever the daily gains shrink: each day still adds to price, but each day adds less than the day leaving the window, so the difference shrinks.
A crossover rule, such as "buy when Momentum crosses above its own moving average, sell when it crosses below", will keep generating exit signals through that stretch. We haven't found a measured win rate for that rule on a comparable sample, and we aren't going to quote one. If you want to know how it behaves, test it yourself on your instrument and your timeframe, with costs, before putting money behind it. And paper trade first.
For the wider context on trading with this kind of speed reading, our momentum trading glossary entry explains the idea the indicator is built to measure. Quantzee's tools are analytical software; nothing here is a signal or advice.
How to read the line without a threshold
If you drop the idea of an overbought line, what is left is still useful, because Momentum is a clean speed gauge when you read it relative to its own recent history instead of against a number somebody else chose. Look at where the current reading sits compared with the highest and lowest readings of the last year on the same instrument, which for SPY in our sample meant a floor near −37 points and a ceiling near +62, and ask whether today's move is ordinary or unusual for that fund.
A second habit is to read the slope before the sign. A line that is still positive but rolling over tells you the gains are getting smaller, and a line that is negative but turning up tells you the losses are getting smaller, so the direction of the line often carries more information than which side of zero it happens to be on. Then compare that with what price itself is doing, because a rising line under a flat price and a falling line under a rising price are the two cases that deserve a second look before any decision is made on them.
Finally, write down the form, the length and the normalisation you used, since a reading of −2.82 means nothing a month from now if you can't recall that it was a ten-bar change divided by a 14-bar average true range.
Frequently Asked Questions
Changelog
6 November 2026: first published. Figures computed on daily bars for SPY, QQQ and GLD from 6 November 2025 to 5 November 2026. Platform definition checked against the MetaTrader 5 help page on 6 November 2026.
Sources: MetaTrader 5 Help, Momentum.