The stochastic oscillator is a number between 0 and 100 that tells you where the latest close sits inside the high-low range of the last N bars. That is the whole indicator. Everything people say about stochastic oscillator settings, overbought lines and crossover strategy follows from that one sentence, and most of the confusion follows from forgetting it.
This guide is built in three parts. First, what the stochastic oscillator is and how fast, slow and full versions differ. Second, how to think about settings, where the lookback length turns out to be the parameter that matters. Third, how to build a trading strategy around it without pretending the indicator can do jobs it can't. Quantzee builds analytical software for chart analysis, so the angle here is measurement: what the number means, and what you'd need to supply before a stochastic rule can even be tested.
What Is the Stochastic Oscillator?
George Lane's stochastic oscillator compares a closing price to the range it has traded in recently. It uses three inputs from each bar: the high, the low and the close. The standard form, as documented in the StockCharts ChartSchool entry on fast, slow and full stochastics, is:
%K = 100 × (Close − Lowest Low over N bars) ÷ (Highest High over N bars − Lowest Low over N bars)
Every term is simple. Close is the latest closing price. Lowest Low is the lowest low of the last N bars, and Highest High is the highest high of the same N bars. N is the lookback, 14 by default in most charting platforms. The result is 0 when the close equals the lowest low and 100 when it equals the highest high.
%D is then a moving average of %K, usually a 3-period simple average. It's the slower line, the one %K crosses.
A worked example on real prices
Tradeciety's guide to the stochastic indicator prints a calculation on real chart prices. The 14-bar high was 0.6283 and the 14-bar low was 0.6258, a range of 0.0025. The latest close was 0.6280. So (0.6280 − 0.6258) ÷ 0.0025 = 0.0022 ÷ 0.0025 = 0.88, and the reading is 88. Per the source page, that is how its author gets a reading above the 80 line. We reuse its numbers only to show the arithmetic, and we have not re-run them on our own data.
Now the point most guides skip. Keep the same close and the same low, and change only the range. The next figures are a hypothetical, arithmetic only, not market data. Suppose a longer lookback pulls in an earlier high of 0.6340. The range becomes 0.6340 − 0.6258 = 0.0082. The close hasn't moved, but the reading becomes 0.0022 ÷ 0.0082 = 0.268, or about 27. Same price, same bar, a reading of 88 in one lookback and 27 in another.
That swing is not a bug. It is the definition working as written, and it explains why 80 and 20 behave differently from one setup to the next.
What the Number Actually Measures
Stochastic is a normalised position, not a measure of speed. A reading of 88 says the close is 88% of the way up the recent range. It says nothing about how fast price got there, how large the move was in money terms, or whether anyone is still buying.
Two consequences matter in practice.
The first is saturation. In a steady advance, each new close sits at or near the top of the last 14 bars' range, because each new bar sets a new high. The oscillator then prints 90, 95, 100 and stays there. The indicator isn't broken. It is reporting, correctly, that the close is at the top of the window, which is what an uptrend looks like in this arithmetic. Traders who treat a saturated reading as a reversal signal are asking a position gauge to answer a trend question.
The second is that thresholds scale with the range. Take the range of 0.0025 above. An 80 reading means the close is 0.0020 above the low. Take the hypothetical range of 0.0082: an 80 reading means the close is 0.0066 above the low. The first is a move of 20 hundredths of a point on a quiet tape; the second is 66. Both print "80". In a quiet market the oscillator reaches the 80 line on a move that is economically trivial, and a rule of "80 means stretched" treats the two as the same event.
Our own CCI write-up makes a parallel argument for a different oscillator: the level isn't what you think it marks. If you've read why CCI above +100 isn't an overbought signal, the logic carries across, with one difference. CCI has no ceiling, so +180 is possible. Stochastic is closed at both ends, so it can only pin. The range-width point here is the bounded-indicator version of the same lesson.
Fast, Slow and Full Stochastic
There are three common versions, and they differ only in how much smoothing is applied. Per the StockCharts ChartSchool definitions:
- Fast stochastic. Fast %K is the raw formula above. Fast %D is a 3-period simple moving average of Fast %K. The raw line is jumpy and crosses its signal line often.
- Slow stochastic. Slow %K is Fast %D, so one smoothing step has already been applied. Slow %D is a 3-period average of Slow %K, a second smoothing step. Fewer crossovers, more lag.
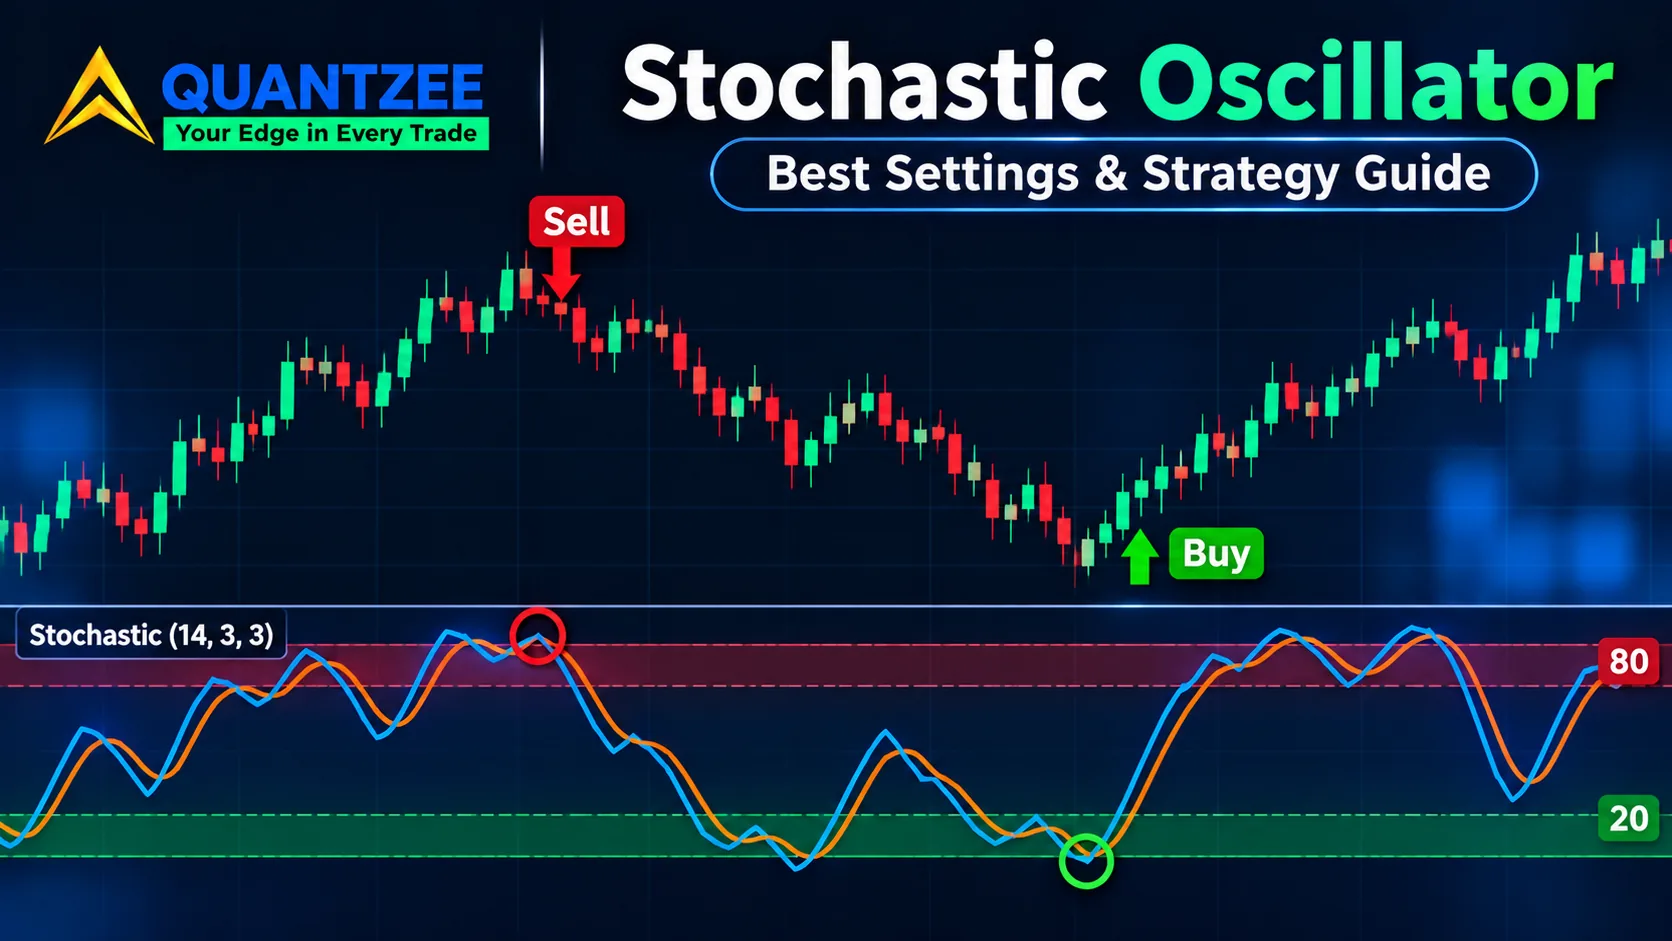
- Full stochastic. The same machine with the smoothing lengths left open. The three numbers in "14, 3, 3" are the lookback, the %K smoothing and the %D smoothing. Set the middle value to 1 and you have the fast version. Set it to 3 and you have the slow version.
So "which stochastic should I use?" is really "how much smoothing do I want?" Each added smoothing step cuts signal count and adds lag, a trade you make explicitly whichever version you pick.
The practical trap is comparing across variants. A result quoted for (14, 1, 3) can't be carried over to (14, 3, 3). They're different signals, firing on different bars, with different noise levels. If a strategy page says "stochastic crossovers win X% of the time" without naming the variant, the number can't be reproduced, and it isn't evidence about the version you plug into your chart.
One more identity worth knowing. Williams %R is Fast %K shifted down by 100: %R = %K − 100, which runs from −100 to 0 instead of 0 to 100. Same formula, different axis. Anyone running Fast Stochastic and Williams %R together is plotting one series twice.
Settings: The Lookback Is the Real Parameter
Most "best settings" pages give you a set of numbers and a timeframe. The defaults are 14, 3, 3. StockCharts uses 14 periods as its reference setup, and nearly every platform ships it.
The 14 is the number to think about, not the 3s. Smoothing values change how noisy the line is. The lookback changes what the line is measuring, because it sets the range that every close is compared against. Move N from 14 to 5 and the high-low window shrinks, so 80 and 20 become closer, more frequent targets. Move N to 50 and the window widens, the oscillator drifts through the middle for long stretches, and a reading near 100 means something much rarer.
The most prescriptive competitor we reviewed, the best-stochastic-strategy page on tradingstrategyguides.com, publishes this settings table by timeframe: 8, 3, 3 on 5-minute charts; 14, 3, 3 on 15-minute; 20, 5, 5 on 30-minute; 9, 3, 3 on 1-hour; 5, 3, 3 on daily. It then tells the reader to backtest. It presents no backtest of its own, and it never notes that shifting the lookback from 5 to 20 changes what the 80 line stands for. That is the gap. A table of settings with no test behind it is a list of preferences.
What a reader can usefully do with this:
Pick the lookback by asking what range you want a close measured against. A 14-bar window on a daily chart is a roughly three-week range. A 14-bar window on a 15-minute chart is three and a half hours. Those are different questions. Then hold the lookback fixed while you vary one thing at a time, and log the results. A sensible sweep might try lookbacks of 5, 9, 14, 20 and 30 with smoothing held at 3, then vary smoothing at the winning lookback. Anything else confounds two variables at once.
There's no universally right answer, and a page claiming one hasn't tested across regimes. What you can get is a setting that suits a particular instrument, bar size and rule set, validated on data you set aside.
The 80 and 20 Lines
The lines come with the indicator, which makes them easy to read as a statement about momentum. The formula says otherwise: 80 is a percentage position inside a window.
So treat the lines as markers of where the close sits, and decide separately whether that location matters for your rule. In a range-bound market, a close near the top of a range often does precede a pullback, because price has no reason to hold there. In a trend, the close lives near the top of its range for as long as the trend lasts. The same reading demands opposite handling depending on regime, which is exactly the problem the trend-definition gap below leaves open.
Signals: Crossover Versus Threshold Exit
There are two different rules people call "the stochastic signal", and they aren't interchangeable.
The crossover rule. %K crosses above %D, a buy signal; %K crosses below %D, a sell signal. This tells you the short-term line has turned relative to its own average. It can fire anywhere in the 0 to 100 range, including at 55, where nothing is "oversold" at all.
The threshold-exit rule. The oscillator falls below 20 and then moves back above it (or rises above 80 and then falls back below). This tells you the close has left the bottom fifth of the range. It needs no crossover.
The two fire on different bars. In a sharp V-shaped reversal, the cross above %D can arrive while the reading is still at 12, ten bars before a re-entry above 20. In a slow grind, the order can flip. Combining them as "cross while below 20" is a third rule with a smaller signal count than either one alone. Describe which rule you're testing. A page that says "buy when stochastic crosses in oversold territory" has quietly picked the third one.
Each rule has a precondition. The crossover needs a defined market regime, since in a strong trend it whipsaws constantly. The threshold exit needs a range wide enough that 20 means a real distance from the high, which loops back to the lookback point above.
Divergence on an Oscillator That Saturates
Divergence means price makes a higher high while the oscillator makes a lower high, or the mirror image at lows. It is a classic stochastic setup. It has a specific problem here.
Because the indicator is bounded and range-based, it can print its lower high for reasons that have nothing to do with fading momentum. Suppose price makes a new high on bar 30, then another, slightly higher high on bar 44. On bar 30 the 14-bar window may include a deep recent low, so the reading is 100. By bar 44 the old low has dropped out of the window, the lowest low has risen, the range has narrowed, and the same kind of close can read 94. A "lower high" in the oscillator, produced by the range catching up with price, not by buyers backing off.
Before treating a divergence as informative, check that the lookback range has been broadly stable across both highs. If the window's low or high changed between the two points, the comparison is between two different measurements. Our breakdown of regular, hidden and exaggerated divergence covers which divergence types hold up and why, and the same stable-input check applies to each.
Stochastic, RSI and Williams %R: One Input, Three Readings
A common chart layout puts stochastic, RSI and Williams %R in three panes and reads agreement as confirmation. The arithmetic argues against that. Williams %R is algebraically Fast %K minus 100, as shown above. RSI is built from closing-price changes over a similar lookback. Stochastic uses the high, low and close in the same window. The three are different transformations of overlapping data from one price series.
When the three agree, you've learned something about the price series. You haven't collected three independent opinions. Our own piece on confluence versus correlation goes through the independence test in detail and reports one sample. It is a single chart and a small count, so read it with that in mind:
- The sample was 90 trading sessions in late 2025 on an hourly chart, comparing a 14-period RSI with a 20-period CCI.
- Both crossed their own overbought line 22 times. On 19 of those 22, the two crossings landed within one or two candles of each other.
- Swapping CCI for Chaikin Money Flow, a volume-based tool, agreement dropped to 11 of 22.
- In that sample the volume tool flagged five early warnings that the momentum tool missed, and three of those five came before a pullback of 1.5% or more within the next two sessions.
Be exact about what that does and doesn't show. It's RSI against CCI and RSI against Chaikin Money Flow, not stochastic. It has 22 events and five warnings, which is too few to support a rate. It doesn't show that a volume tool "works". What it does show is the structure of the claim: two price-momentum oscillators agreed 19 times in 22, and an indicator built from a different input agreed half as often. Stochastic belongs in the first family by construction.
Practically: if you want a second opinion next to stochastic, pick one that consumes something other than the same high-low-close series, such as volume, or a trend filter built differently. Adding RSI doesn't give you that. Our guide to trading indicators and signals sorts the common indicators by the input they use if you want a reference.
Building a Strategy: What You Must Add
This is the part where most pages hand over three entry rules and a screenshot. We aren't going to publish a win rate, because there isn't one to publish. Quantzee hasn't run a stochastic backtest for this guide, and a win rate belongs to a complete rule set, not to an indicator. The standing position on the site is the same one our guide to backtesting a TradingView indicator takes: an indicator signal is a trigger, and a result only exists once the rest of the system is specified.
Every competitor page we reviewed says to use stochastic alongside trend analysis. None gives a rule for deciding what the trend is. Their advice makes the signal conditional and then leaves the condition blank. The honest way to fill it is to name what stochastic lacks:
- A trend definition. Something that says, in testable terms, whether you're in an uptrend, downtrend or range. A 50-bar moving average slope, a higher-highs rule, an ADX threshold. Pick one, write it down, and fix it before you look at results.
- A stop. The oscillator has no concept of where a trade is wrong. A stop can be a distance in points, a multiple of ATR, or the last swing low. Without one, the exit is "when I stop feeling good".
- Position sizing. How much you risk per trade, as a fixed fraction of the account or a fixed unit. This decides drawdown far more than the entry does.
- A cost term. Spread, commission and slippage. Short-lookback stochastic rules fire often, so costs compound, and a rule that looks flat before costs can be negative after.
With those four supplied, a stochastic rule becomes testable. A skeleton you could actually run looks like this: trend filter says up; wait for Slow %K to fall below 20 and come back above it; enter at the next bar's open; stop at the lowest low of the last 10 bars; exit when %K reaches 80 or the stop is hit; risk 1% of the account per trade; deduct a fixed cost per round trip. Each clause is a variable you can test, and none of those choices is endorsed here. It's a template, not a recommendation.
When you test it, hold out data. Fit on one stretch, check on another, and look at the distribution of trade outcomes, not just the average. A strategy that works on 30 trades hasn't told you much. One that works across a few hundred trades in several regimes has at least earned a closer look. The random-walk test for an indicator on our site shows how to check whether a signal beats what noise alone would produce, which is a fair first filter for any stochastic rule.
Paper trade first. Run any rule on a demo account before you commit real capital, and treat every setting in this article as a starting point to test, not a finding.
Mistakes That Show Up Again and Again
Reading 80 as "sell". It marks position in a window. In a trend, readings above 80 can persist for dozens of bars.
Changing the lookback to fit a timeframe and keeping the same thresholds. The thresholds mean something else after the change.
Quoting results without the variant. Fast, slow and full are different signals.
Stacking RSI and Williams %R as confirmation. One measurement, repeated.
Treating a divergence as a signal without checking that the range was stable between the two highs.
Skipping costs. A rule that fires 200 times a year pays costs 200 times.
Sources and Further Reading
Formulas and variant definitions: StockCharts ChartSchool, Stochastic Oscillator (Fast, Slow and Full), and the TradingView support page on Stochastic (STOCH). Worked arithmetic: Tradeciety. Settings-by-timeframe table: tradingstrategyguides.com. On the limits of technical analysis, see the US SEC's investor education site, investor.gov, and the CFTC's Learn and Protect pages. Quantzee provides analytical software, not investment advice, and nothing here recommends buying or selling any instrument.