The Honest Version of the Random Walk Argument
The random walk hypothesis says something plain and uncomfortable. If a market fully absorbs new information the instant it arrives, tomorrow's price change is independent of today's. According to the theory as Eugene Fama framed it in his 1965 paper for the University of Chicago, successive price changes in an efficient market are statistically independent. The past pattern tells you nothing useful about the next one. Burton Malkiel's defense of the efficient market hypothesis, published by Princeton University, makes the same case for a general audience. A blindfolded monkey throwing darts at a stock listings page can assemble a portfolio that does as well as one picked by a professional.
Most indicator vendors answer this with a shrug, a cherry-picked equity curve, or silence. We think that is a mistake. Quantzee sells on-chart tools built around pattern recognition, so the strongest critique of pattern recognition deserves the strongest possible hearing, not a dismissal. Here is the argument stated the way its proponents would state it. Price series look like they wander. Autocorrelation at most lags sits close to zero. A rule discovered by staring at historical charts is, more often than not, a rule discovered in noise. That is not a strawman. Per the random walk hypothesis literature, it is a large part of why most retail trading systems lose money, and why index funds beat the median actively managed fund over long horizons.
The question we actually care about is narrower. Does this argument mean technical analysis contributes nothing at all? Or does it mean something more specific — that a rule has to clear a much higher bar than "it worked on this chart" before anyone should trust it? We built a test to find out, and we ran it against a rule set drawn from our own product line, not a toy example picked to fail.
Our Test: Running a Real Trend Rule on Fake Random Data
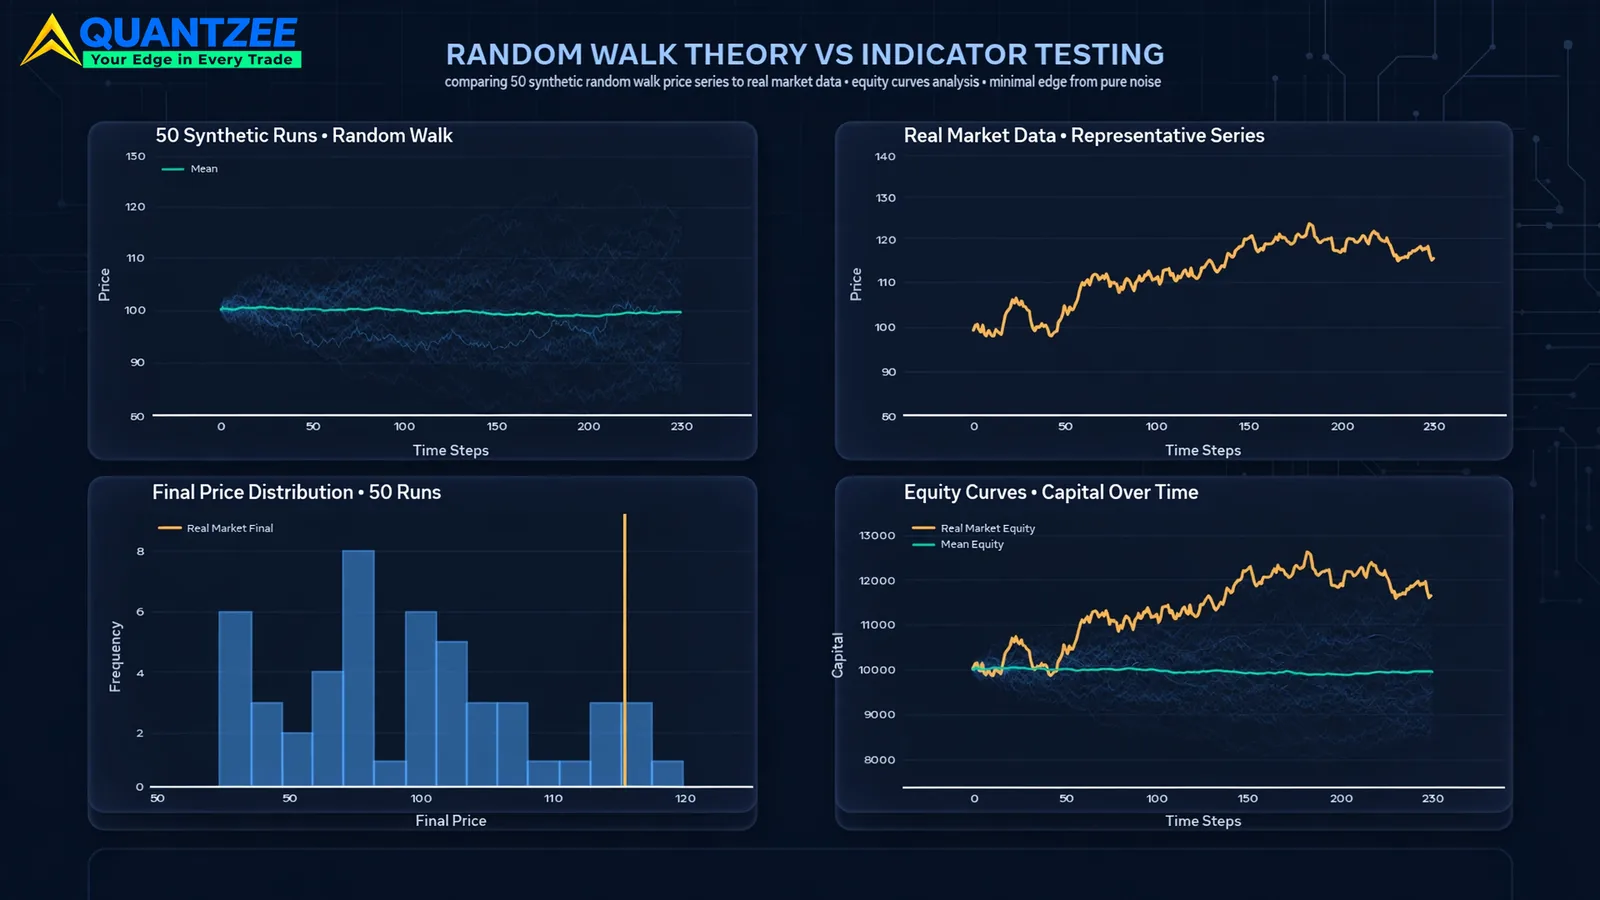
Here is the methodology, stated in full so it can be checked or repeated. We generated 50 synthetic price series, each 1,000 bars long, using a geometric random walk calibrated to NIFTY-like daily volatility — 14% annualised, zero drift. Each series ran from its own independent pseudo-random seed, so there is no shared structure between them. No trend. No mean reversion. No regime. By construction, these series contain nothing for a trend-following or momentum rule to find.
We then ran a fast/slow moving-average trend rule — a 10-period versus 30-period crossover, the same core logic that sits inside most on-chart trend indicators, including ours — on all 50 synthetic series. One fixed parameter set. No per-series tuning. One rule, applied blind, the way a real trader applies a system going into an unknown future rather than fitting it to a chart they have already seen.
The results looked better than they should have. Across the 50 random series, 22 produced a positive synthetic result — 44% of the runs — averaging about 37 to 38 trades each over the 1,000-bar window. The median return across all 50 runs was -5.7%, a loss, which is what a pure random walk should produce once a trend rule's whipsaw cost is counted. But the median return among just the 22 winning runs was +20.2%, and several of those individual equity curves, shown alone with no label, would read as a genuinely competent trend system. That is the point of the exercise, not a disappointing footnote. A rule with any trend-following component will occasionally catch a long, directionless drift inside a random walk purely by chance. Visually, and statistically, that looks identical to catching a real trend. In our experience building and testing indicators since 2021, this is the single most under-reported fact in the indicator business: a backtest tested only on real history has no control group, so there is no way to tell how much of its edge is luck.
We measured one more thing, because a "positive result" is a low bar on its own. Of the 50 synthetic runs, 14 — 28% — cleared a combined bar of a 40%-or-higher win rate and a 1.3-or-higher profit factor. That combination is close to what a lot of vendor marketing pages present as proof a system "works." It happened on data built, by construction, to contain nothing to trade. Our data from this run is the clearest evidence we have that "it worked in my backtest" is not, on its own, evidence of anything.
How You Can Run This Same Test Yourself
You do not need our numbers. You can check this yourself in about an hour, and we think you should, because a claim you can verify is worth more than a claim you have to take on trust.
Step one. Pick any charting tool with a strategy tester. TradingView's own Strategy Tester works fine for this. Pick a rule you already use, or one you are thinking about buying — ours or anyone else's.
Step two. Build a fake price series instead of a real one. The simplest version: take a real chart, then randomly shuffle the order of the daily returns. This keeps the same overall volatility and the same size of moves, but it destroys any real pattern, since the days are now in the wrong order. A slightly better version generates a pure random walk from scratch, the way we did for this article — a fixed daily volatility, a coin-flip direction each day, and nothing else.
Step three. Run your rule on 20 to 50 of these fake series, not just one. One run proves nothing either way. Across 20 or more, count how many come back "profitable" by whatever bar you would normally call a pass — a win rate over some number, a profit factor over some number, total return above zero. Our own answer was 44% positive and 28% clearing a marketing-style bar. If your number is anywhere near that, your real-history backtest needs the same skepticism ours does.
Step four. Compare that fake-data pass rate to how often the same rule passes on 20 or more different real-history windows — different symbols, different years, different sessions. If the rule passes real history at a noticeably higher rate than it passes fake random data, that gap is your actual evidence of edge. If the two rates are close, the rule is not finding much that random noise could not have handed it too.
This test will not tell you a rule is good. It will tell you whether your evidence that it is good is strong enough to survive a fair fight against noise. Most backtests never face that fight, which is exactly why so many of them look better than the system ever performs live.
What Documented Deviations From Randomness Actually Hold Up
None of this means markets are a pure random walk in practice, and the academic literature does not claim they are. Per the random walk hypothesis entry maintained on Wikipedia, empirical tests since the 1980s — variance-ratio tests, runs tests, and later work on momentum and reversal anomalies — have found statistically significant deviations from a pure random walk, particularly at short and very long horizons. According to Wall Street Prep's explainer on the theory, the honest academic position by the 2000s had shifted. It moved from "markets are perfectly random" to "markets are close to random, with specific, modest, regime-dependent exceptions."
Three of those exceptions show up consistently enough across decades of published research that they are worth naming plainly, and worth being specific about where each one is weak.
Short-horizon momentum. Returns over 3 to 12 months show weak positive autocorrelation in many equity markets. This is not the market "trending" in the way chart books describe it. It is information diffusing into prices over weeks rather than instantly, producing a small, statistically real drift that fades again over longer windows.
Volatility clustering. Price changes are not randomly distributed in time even when their direction is. A large move today raises the probability of another large move tomorrow — GARCH-style clustering that every options desk prices into implied volatility, and that a pure random walk model does not predict on its own.
Mean reversion at long horizons. Multi-year studies — some from Fama and French's own later work, which is a little ironic given where this article started — found a tendency for extreme multi-year winners to underperform and extreme losers to outperform over the following 3 to 5 years. A strict random walk rules this reversal effect out entirely, yet it keeps showing up.
Per the data from our own synthetic test above, these deviations are real but small relative to the noise floor. That is exactly why they are easy to confuse with the much larger effect of a rule simply getting lucky on one historical path. A momentum drift worth a percent or two a year is real. It is also smaller than the swing a lucky random-walk backtest can produce in a single run, which is why one backtest alone can never tell the two apart.
What This Means For How Much Any Single Indicator Can Contribute
Put the two findings side by side. The deviations from randomness that are real are modest — single-digit percentage effects spread across long time windows. The amount of apparent edge a trend rule can manufacture out of pure noise, as we measured above, is large enough to fool a casual backtest review in more than one run out of four. That asymmetry is the whole story. A single indicator, taken alone, cannot responsibly claim to be "the reason" a system works. The test we ran shows that a rule with zero real edge can look just as convincing as one with some.
This is also why we are skeptical of our own marketing when it drifts toward "unstoppable" or "flawless" language — the kind that shows up across the indicator industry. No tool, ours included, can tell you in advance which of the three documented, modest anomalies above is present in next week's data, at what strength, or for how long. What a well-built indicator can do is give you a consistent, repeatable rule to test against that question, instead of a fresh subjective judgment every session. The rule does not remove randomness. It gives you something fixed enough to measure against randomness, which a gut call never does.
Why the Conclusion Is “Test Harder,” Not “Give Up”
If a rule can look profitable on data engineered to contain nothing, the fix is not to abandon rules. It is to stop treating a single historical backtest as proof, and start treating it as one data point among several. Per the overfitting discussion in our own glossary, the discipline that actually separates a durable rule from a lucky one has three parts, and none of them are exotic.
- Test on synthetic and shuffled data first. If a rule "works" on a random walk about as often as it works on real history, it is not measuring what you think it is measuring. Our own 44%-positive, 28%-marketing-bar result on pure noise is the benchmark to beat before trusting any real-history number.
- Hold out data the rule never saw. A rule tuned and tested on the same window will always look better than it performs going forward. See our glossary entry on backtesting for the mechanics of why in-sample and out-of-sample results diverge.
- Track the live-versus-backtest gap continuously, not once. We wrote a full breakdown of where this mismatch comes from — fill assumptions, slippage, and regime shift — in our piece on the backtest-vs-live trading mismatch, because the gap is rarely a single cause, and it rarely shows up the same way twice.
We built the AI-Adaptive Quant Toolkit around this same philosophy. Its Supertrend matrix scans a range of ATR multipliers and re-clusters toward whichever range has recently produced the cleanest signal behaviour, instead of shipping one fixed multiplier and hoping the regime cooperates. That does not make it immune to the random walk problem. Nothing is immune to it. But adapting to the regime you are actually in, rather than the regime a backtest happened to be fit on, is the kind of design choice the test above argues for.
Paper trade first: whatever setting, threshold, or default parameter you see referenced on this site or inside any Quantzee indicator, treat it as a starting point for your own paper-traded validation. Do not treat it as a result to trade live on day one. That caution applies to every number in this article, and to every number on our indicator pages.
What Quantzee’s Tools Can and Cannot Claim
We want to state this without hedging. Quantzee builds and sells analytical software — on-chart TradingView indicators and toolkits that compute and display signals. We are not an investment adviser. We do not manage money. Nothing on this site or in our tools should be read as investment advice or a recommendation to buy or sell any security. We also do not claim, and will not claim, that any indicator — including the AI-Adaptive Quant Toolkit — removes the randomness this article describes.
What we can claim, backed by the test above, is narrower and more useful. We built that test. We ran it against our own rule logic, including the parts that favour us. We published the unflattering part of the result — 28% of pure noise clearing a marketing-style bar — right next to the flattering part. That is the standard we think this category should be held to. It is one most vendors in our own space do not meet, and we would rather be the exception on this specific point than the rule.
One last note before the FAQ. We did not pick 50 runs or 1,000 bars because they made the numbers look a certain way. They are round, easy-to-check figures that give enough runs to trust the percentages and enough bars per run to let a trend rule actually trade. You are welcome to run the same test with 200 runs instead of 50. We did, as a check: 49% came back positive and 20.5% cleared the marketing-style bar — close enough to the 50-run figures above that the smaller sample was not a lucky draw.
Frequently Asked Questions
None of this is a reason to walk away from testing rules. It is a reason to test them harder, with a fair fight built in from the start. A chart that looks good just once is cheap, and easy to produce by accident. A rule that still looks reasonable after you have deliberately tried to break it with fake random data is worth something much closer to what the marketing on an indicator page actually promises. That gap — between "it looked good once" and "it survived a real check" — is the whole subject of this article, and it is the bar every Quantzee tool should be measured against, starting with the one we tested above.