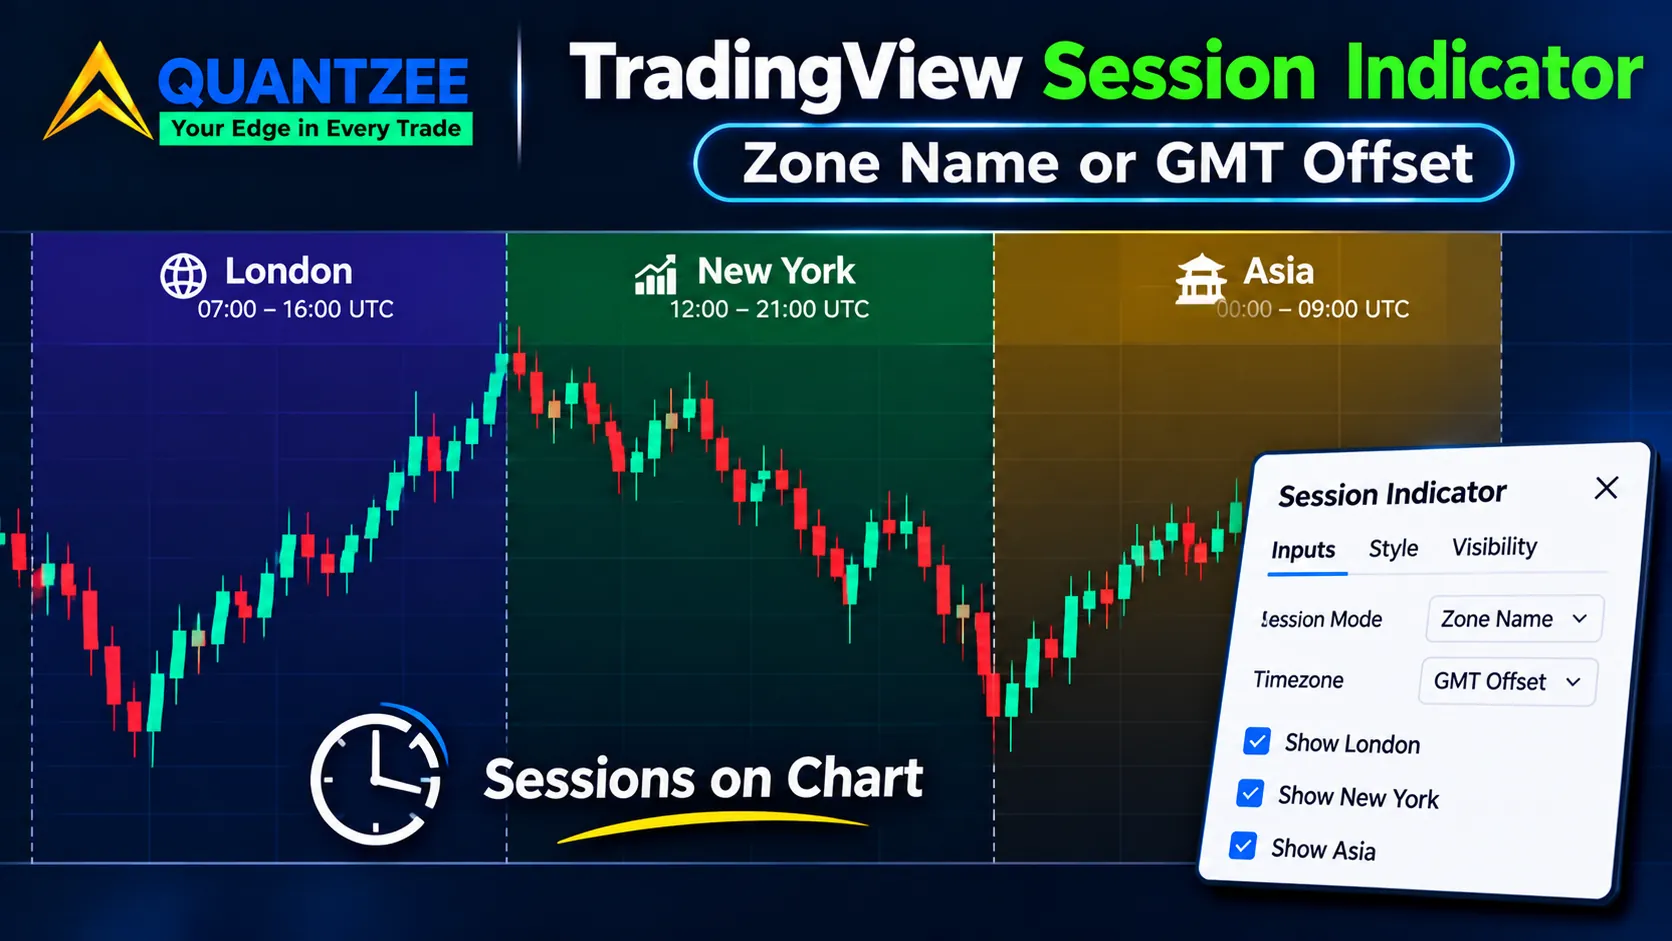
A TradingView session indicator draws a box over every bar that opened inside a time window, and that's all it does. It doesn't measure the market. It reports a clock. So the only question worth asking before you trust one is which clock it's reading, and on most chart screenshots you can't tell. A box labelled "New York" that's anchored to a fixed GMT offset is correct for about eight months of the year and an hour wrong for the other four. A box anchored to the zone name America/New_York is correct all year. Nothing on the chart shows you which one you've got.
This post is about that one setting: how to tell which anchoring a script uses, what the staggered US and UK clock changes do to the London and New York overlap, and a short checklist to run before you build any rule on top of a session box.
What does a TradingView session indicator actually draw?
Our team builds chart indicators, so we've spent time on exactly this kind of timestamp logic, and the zone is always the first thing to pin down.
According to TradingView's own documentation for the built-in Trading Sessions indicator, it draws "a colored box containing all the bars that opened within the session in the specified time zone." You can set up to three sessions, each with its own start time, end time and time zone. The defaults stand in for Tokyo, London and New York. The indicator only works on intraday timeframes, so it disappears on a daily chart.
Read that sentence again and notice what's missing. There's no volatility measure, no volume threshold, no judgment about which bars matter. A bar is in the box if its open timestamp falls between your start and end times as read in the zone you picked. Everything else, including any claim that "London is where the move happens", is something you bring to the chart yourself.
That's why the zone setting carries so much weight. The box edges are a pure function of two numbers and a zone. Get the zone wrong and the box is wrong, however clean it looks.
IANA zone name versus fixed GMT offset: what's the difference?
TradingView's documentation lists two supported formats for a session's time zone. One is GMT or UTC notation, a numerical offset such as GMT-5 or UTC+11. The other is IANA database notation, a regional identifier such as America/New_York, Europe/London or Asia/Tokyo. The IANA time zone database, maintained at iana.org, is the shared reference that operating systems and most software use for these names.
The difference is simple. A fixed offset never moves. An IANA name carries the region's rules with it, including its daylight saving switches. TradingView says as much: using IANA notation "is a more strong way to specify a session's time zone than using a fixed GMT notation," because it adjusts automatically for annual daylight saving switches and for future updates to time zone boundaries. The documentation recommends IANA notation in most cases.
Their worked example is the one to remember. Take a BINANCE:BTCUSD chart, where the symbol's exchange runs on a fixed GMT+0 clock all year. Add two sessions that both mean "New York trading hours", 09:30 to 16:00. The first uses GMT-4, the second uses America/New_York. During daylight saving time the two boxes sit exactly on top of each other. Outside it, per the same page, they differ by one hour, because New York moves from GMT-4 to GMT-5.
So the fixed-offset version isn't broken in summer. It's broken from the first Sunday in November to the second Sunday in March, and it gives no warning when the switch happens. Today, 6 November 2026, New York has been on GMT-5 since 1 November. A session box pinned to GMT-4 is already an hour off on your chart right now.
How can you tell which zone type a script you didn't write is using?
Three checks, in order of effort.
Open the settings. For TradingView's built-in indicator the "Session time zone" field is right there in the Inputs tab, and what's typed in it tells you the format. Community scripts vary: some expose a zone input, some hard-code the zone in the source, and some ask for an offset in hours. If the field says GMT-4 or a bare number, it's a fixed offset. If it holds a region name, it's IANA.
Leave-it-empty behaviour. There's a third case that catches people out. According to TradingView, if the time zone field is left empty, the indicator uses the IANA zone of the exchange for the symbol currently open on the chart. So the same saved layout can silently change its anchoring when you switch from a New York stock to a Frankfurt one. Neither is wrong, but you should know which you're getting.
Scroll across a switch date. This is the test that doesn't depend on reading anyone's description. Pick a liquid exchange-listed symbol, drop to a 5-minute chart, and scroll back to a week in July and a week in January. In both weeks, the box that's meant to represent the US cash session should begin on the 09:30 bar, the first bar with the opening auction's volume burst. If the left edge is on the 09:30 bar in July and the 08:30 or 10:30 bar in January, you've found a fixed offset. It takes about two minutes and it settles the question with the chart itself.
The documentation for one well-known community script, Sessions (New York, London, Asia), is a good example of doing it properly. It states its defaults in prose: Asia 20:00 to 05:00, London 03:00 to 12:00, New York 09:30 to 16:00, all in America/New_York, with a note that TradingView handles the clock change for that zone. That clarity comes from the author writing it down, not from anything the indicator displays on the chart. A lot of scripts and product pages don't bother. One indicator product page we looked at lists London, Frankfurt and US times with no time zone stated anywhere and no mention of daylight saving at all.
Why the London and New York overlap changes shape, not just position
Here's where a fixed offset costs real accuracy. The US and the UK don't change their clocks on the same dates. The US moves on the second Sunday in March and the first Sunday in November. According to the UK government's clock-change page, the UK moves forward at 1am on the last Sunday in March and back at 2am on the last Sunday in October.
For a few weeks twice a year, one country has switched and the other hasn't. In those weeks London and New York sit four hours apart instead of the usual five.
These are the actual windows, taken from the gov.uk table (UK dates) and the US rule above:
- 2026 spring: the US switched on 8 March, the UK on 29 March. For 21 days (8 to 28 March), the gap was four hours.
- 2026 autumn: the UK went back on 25 October, the US on 1 November. For 7 days (25 to 31 October), the gap was four hours.
- 2027 spring: the US switches on 14 March, the UK on 28 March. Fourteen days (14 to 27 March) of a four-hour gap.
- 2027 autumn: the UK goes back on 31 October, the US on 7 November. Seven days (31 October to 6 November).
Those dates move with the calendar, so don't copy this list into a script. Derive them from the zone rules, which is exactly what an IANA name does for you.
Now the overlap. Take the exchange hours: the NYSE core session runs 9:30 a.m. to 4:00 p.m. Eastern, per the NYSE's published trading hours page, and the London Stock Exchange's continuous trading runs 08:00 to 16:30 London time. Put both in one reference zone, America/New_York. When we compared the two sets of hours side by side in that single zone, the overlap arithmetic fell straight out.
- Normal weeks (five hours apart): London 08:00 to 16:30 is 03:00 to 11:30 Eastern. The overlap with the US cash session is 09:30 to 11:30 Eastern, two hours.
- Mismatch weeks (four hours apart): London 08:00 to 16:30 is 04:00 to 12:30 Eastern. The overlap is 09:30 to 12:30 Eastern, three hours.
So the overlap isn't merely shifted in those weeks. It's an hour longer, and it ends an hour later on a New York chart. A rule like "mark the London/New York overlap" gives the wrong answer for exactly those weeks if either session is hard-pinned to a fixed offset.
There's a second trap hidden in that community script's defaults. London is set to 03:00 to 12:00 in America/New_York. That's correct in a normal week and an hour early in a mismatch week, because London's own clock hasn't moved yet when New York's has. The cleaner fix is to anchor each session to its own exchange's zone: Europe/London for London, America/New_York for New York. Then each box follows its own market's clock and the overlap sorts itself out.
Chart time zone and session time zone are two separate settings
The next most common reason for a shifted box has nothing to do with daylight saving. TradingView has a chart time zone, which controls how the time axis and crosshair labels are displayed, and the indicator has its own session time zone, which controls how the window is interpreted. They don't talk to each other.
Change only the chart zone to your local time and the bars don't move, but every label does, so a box that "starts at 09:30" in the settings now appears to start at 19:00 or 15:00 on the axis. That's correct behaviour and it looks like a bug. Change only the session zone and the box genuinely moves relative to the bars. When a box looks shifted, work out which of the two you touched last before you blame the script.
A habit that avoids the confusion: set the chart zone to the exchange's zone of the symbol you trade most, and leave sessions on IANA names. Then the axis labels, the box edges and the exchange clock all agree.
The instrument matters more than the session label
The indicator highlights bars that exist. That sounds obvious until you put it on two different symbols.
On a 24-hour instrument like the BINANCE:BTCUSD chart from TradingView's own example, there's continuous data through the Tokyo, London and New York windows. All three boxes fill completely, and the "New York" box on a crypto pair is just a window over a market that never closed.
On an exchange-listed symbol, there's no data outside that exchange's own hours, apart from any extended-hours bars you've switched on. A London box on a NYSE-listed stock covers only whatever pre-market bars exist. A Tokyo box on the same chart is mostly empty. The script isn't failing. There's simply nothing to draw.
The same indicator therefore paints very different pictures on different symbols, and neither picture is a statement about which session matters. The box tells you when a window was open on that symbol's clock, nothing more. We'd go further: the session label is a convenience, and the instrument's own trading hours are the real constraint.
A note on volume. The NYSE page tells you when the US cash session opens and closes. Quantzee's own ICT page makes the qualitative point that the New York window lines up with heavier index-futures volume, but we don't have a first-party measurement of session ranges or session volume to put a number on it, so this post doesn't claim that one session is more volatile or more tradeable than another. The box is a ruler, not a forecast.
What is a session box actually for?
A session box earns its place when you use it as a defined reference range: a high and a low that existed before something else happened, which a later move can be measured against. That's the same logic as an opening range, where the first few minutes set a boundary and you study what happens when price crosses it.
If that's how you plan to use it, the box edges stop being decoration and start being an input, and an hour of error in the start time changes which bars define the range. That's a different range, with a different high and low, and any result you attach to it belongs to the wrong window.
Our opening-range comparison of 5, 15 and 30-minute ranges treats range length as a tested parameter rather than a default, and the same discipline applies to the clock. Start time and zone are parameters too. If you can't state them precisely, you can't reproduce the range, and a range you can't reproduce is a range you can't test.
For the vocabulary side, the ICT one-page framework map sorts killzone and session terms into their layers, and it also covers what happens when you apply killzone windows to a 24-hour crypto chart. That page owns the session-timing vocabulary. This one owns the configuration. If you're building a wider toolkit, our guide to day trading indicators shows where a session box sits next to the other tools.
Quick reference: the main windows in one named zone
Methodology: every time below is stated in America/New_York only, derived from the published exchange hours cited above, and it was current when this was written on 6 November 2026. Check the exchange pages before relying on any of it, since hours and holidays change.
- US cash session (NYSE core): 09:30 to 16:00. Source: the NYSE trading hours page.
- London continuous trading: 08:00 to 16:30 London time, which is 03:00 to 11:30 Eastern in a normal week and 04:00 to 12:30 Eastern in a mismatch week.
- London/New York overlap: 09:30 to 11:30 Eastern in a normal week, 09:30 to 12:30 in a mismatch week.
- Tokyo: TradingView's default third session. Japan doesn't use daylight saving, so a fixed
GMT+9andAsia/Tokyogive the same result. It's the one place where the offset-versus-name choice makes no difference.
On that last point, it's worth remembering that the fixed-offset trap only bites for regions that change their clocks. That's why a script author who tests on a Tokyo or a Dubai chart can ship an offset bug without ever seeing it.
Configuration checklist before you trust a session script
- Confirm the zone type. Region name or fixed offset? If it's an offset, find out whether the author handles the switch some other way, or treat it as wrong for part of the year.
- Anchor each session to its own market. London on
Europe/London, New York onAmerica/New_York. Never describe one market's hours in another market's zone. - Check the chart zone. Know what the axis is showing, and know it's separate from the session setting.
- Test against a known open. On a liquid exchange-listed symbol, the box's left edge should land on the 09:30 bar for the US cash session. Check once in summer and once in winter.
- Check the instrument. A 24-hour market fills every box. An exchange-listed symbol only fills the boxes that overlap its own hours.
- Re-check after the next clock change. The next US switch is the second Sunday in March, 14 March 2027. The next UK switch is 28 March 2027. Look at the chart in the two weeks in between.
If you're sanity-checking an indicator's timestamps against the official clock, the US government's time.gov shows the current official time for each US zone. The point of all six steps is the same. A session box looks authoritative because it's colourful and precise, and it's only as precise as the zone setting behind it.
Session boxes are also repaint-free by construction, since they're drawn from timestamps rather than from price. If you want to test whether a different indicator on your chart rewrites its past signals, our repainting test walkthrough covers the method. Quantzee's tools are built as analytical software for reading charts, not as trading advice, and as with any tool, paper trade first before you let any chart rule near real money.