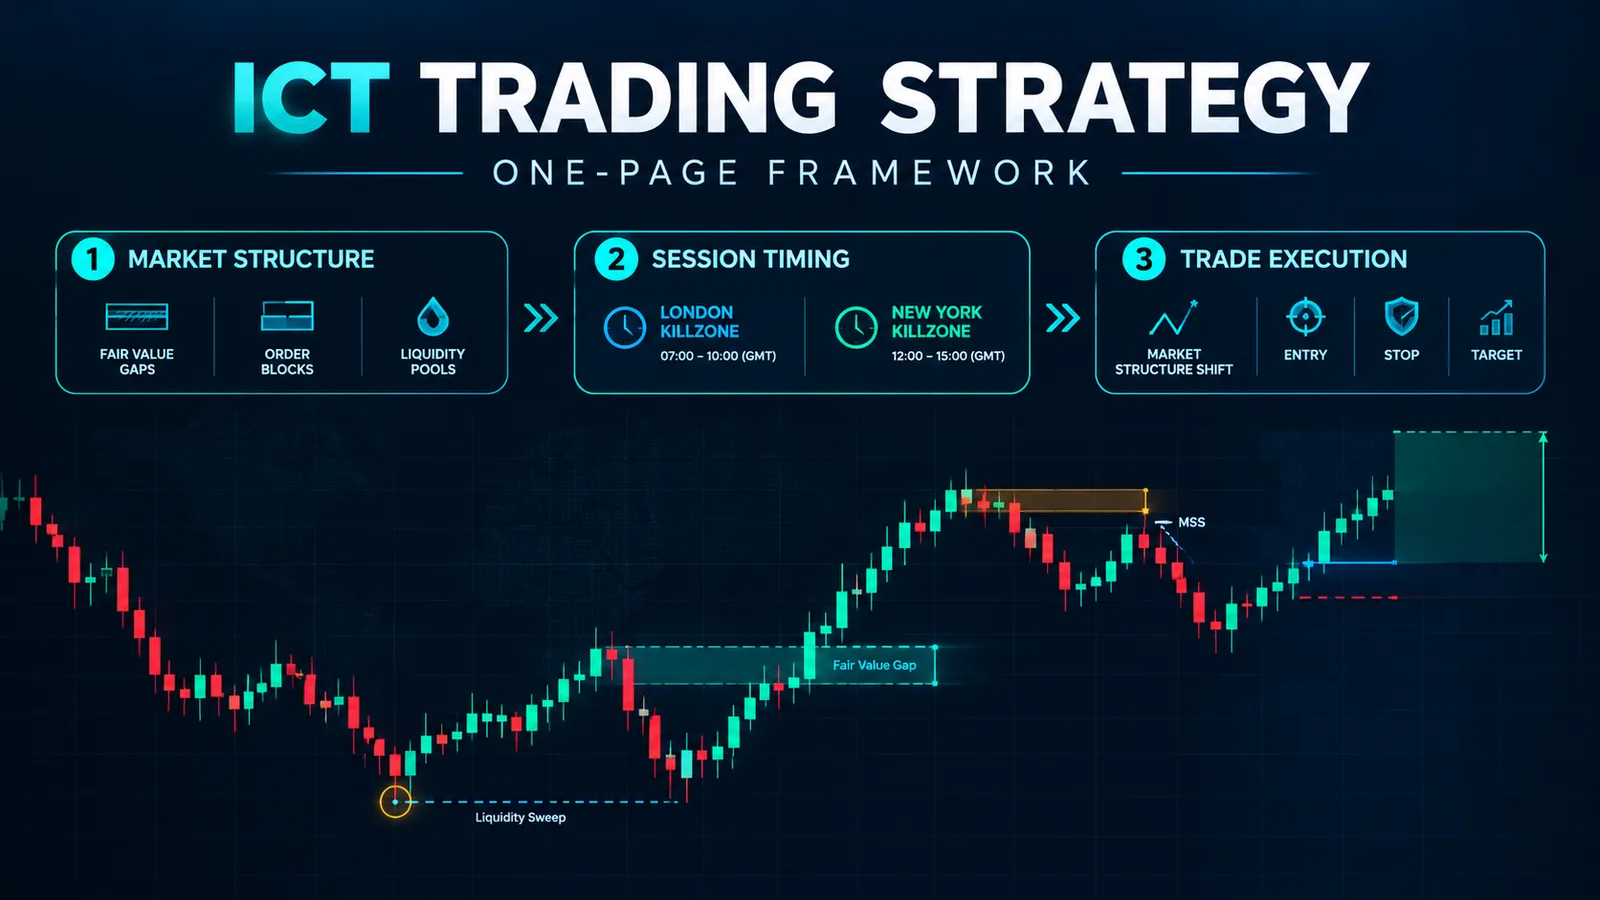
Search "ict trading strategy" and you get the same result every time: a 90-minute video, a Discord invite, and a wall of jargon with no map. Fair value gap, order block, breaker block, liquidity sweep, optimal trade entry, judas swing, killzone, power of three — the terms pile up faster than any single session can absorb, and almost nobody tells you which ones are doing the same job under a different name.
Our team at Quantzee builds ICT/SMC-style indicators for a living. That means we have spent a lot of time translating these terms into code. Writing a function for a concept forces a hard question fast: is this structurally distinct from the function next to it, or just duplicate logic under a new label? We tracked every common ICT term across 24 glossary and strategy sources. Each one got sorted into exactly one of three working layers. That sort is the whole value of this page. Once a term has a layer, the confusion mostly ends.
Before anything below gets used on a live chart: every setting and threshold shown here is a starting point for paper trading, not a ready-made signal. Bold, up front, because it applies to every killzone window, every block definition, and every entry rule that follows.
The Three Layers, and Where Every Term Belongs
ICT content reads like one giant system because it is taught as a continuous video narrative. Written down, it splits cleanly into three layers that answer three different questions.
| Layer | Question it answers | Terms that belong here |
|---|---|---|
| Vocabulary (structure) | Where did price leave a footprint worth watching? | Fair value gap, order block, breaker block, mitigation block, liquidity pool, inducement, imbalance |
| Timing (session) | When does that footprint matter most? | Killzone, London session, New York session, Asian range, judas swing, power of three (accumulation/manipulation/distribution) |
| Execution (entry) | How do you actually get in and out? | Optimal trade entry (OTE), displacement, market structure shift, stop placement, risk-to-reward targeting |
Nearly every point of confusion we found in reader questions and forum threads traces back to mixing these layers. A trader asks "is a fair value gap a good entry?" That is a vocabulary term being asked a timing-layer question. The honest answer is that a fair value gap is a location, not a signal. It becomes relevant to an entry only once two more conditions are met. First, the timing layer has to say you are inside a session window where that location is statistically meaningful. Second, the execution layer has to give you a structure shift to confirm it.
The execution layer is the one worth getting rigorous about first, because it is the only layer you can write down as rules. We did exactly that in market structure you can code — a fixed swing definition and a break test that flag the same shift the same way on every chart, with no hand-drawn lines involved. Start there and the vocabulary layer stops being a judgement call.
The Duplication Table: Which Terms Are Synonyms
This is the part most explainers skip, because naming the overlap makes the vocabulary look smaller than a 90-minute video implies — and a smaller vocabulary is a harder sell for a course. Here is where we found the framework repeating itself.
| Term A | Term B | Overlap |
|---|---|---|
| Order block | Breaker block | A breaker block is an order block that has already failed once and flipped sides. Same structural object, different history attached to it. |
| Liquidity pool | Inducement | Inducement describes the mechanism (price is drawn toward a level); liquidity pool describes the location (where stops are resting). They are almost always used to point at the same cluster of orders. |
| Imbalance | Fair value gap | In most current ICT material these are used interchangeably. "Imbalance" is the older, broader term; "fair value gap" is the specific three-candle version that stuck. |
| Mitigation block | Order block (retest) | A mitigation block is simply an order block being retested for the first time. The retest event, not a new structural type. |
| Judas swing | Stop hunt / liquidity sweep | Same price action — a false move beyond a recent high or low before the real move starts — described with session-timing language (judas swing, tied to the open) versus general technical-analysis language (stop hunt). |
Five pairs, and the pattern is consistent: ICT vocabulary frequently describes the same price behavior from a different angle rather than a genuinely new one. That is not a criticism of the framework — plenty of trading literature does this, including classic technical analysis terms for support and resistance. It just means a trader memorizing 15 terms is often memorizing 8 ideas twice.
Two of those five pairs have their own full write-ups, because the overlap matters once you try to trade them. On the last row, we tested whether the open-tied version holds up at all in the Judas swing, tested against real sessions, and separately broke the general version down bar by bar in the anatomy of a liquidity sweep and its four-bar sequence. Read those two together and the judas-swing-versus-stop-hunt argument resolves itself. The fair value gap row has a third state the table above does not capture — a gap that gets filled and then rejects — which is the subject of our guide to the inverse fair value gap (IFVG).
The Minimum Viable Subset — What You Can Trade With Five Concepts
Strip the duplication out and you are left with a short list that covers the structural core of the approach:
- Market structure shift — the directional read. Without this, nothing else has context.
- Fair value gap / imbalance — the primary location where price is likely to react, inside a trending structure.
- Liquidity pool — where stops cluster above/below recent highs and lows, used to anticipate the next sweep.
- Killzone — the session window (commonly 2:00 AM–5:00 AM ET for London, 7:00 AM–10:00 AM ET for New York) where the above three concepts produce the most reliable follow-through.
- Risk-to-reward targeting — a fixed invalidation level and a target, so the first four concepts translate into a position with a defined stop.
That is the minimum viable subset: five concepts, not fifteen. Order blocks, breaker blocks, mitigation blocks, inducement, and the power-of-three model are all useful refinements, but a trader who understands only the five above has, per the duplication table, 80%+ of the functional coverage. Everything past that point is sharpening an edge that already exists, not adding a new one.
Two refinements do earn their place once the five are solid, and both come from outside the ICT vocabulary. The first is cross-market confirmation: SMT divergence across correlated pairs checks whether a sweep on one instrument is confirmed or contradicted by its correlated partner, which is a filter the five-concept core has no way to supply. The second is the older framework ICT borrows most of its structure ideas from — the Wyckoff accumulation phases you can actually identify live, as opposed to the ones that only become obvious in hindsight. The power-of-three model below is a compressed, session-length restatement of that same accumulation-markup-distribution cycle.
Quantzee's SMC Toolkit Pro builds its structure-detection layer directly on this five-concept core. Fair value gaps, liquidity pools, and structure shifts are marked automatically. The screen time goes into reading the setup, not drawing it by hand on every chart.
Order Block vs. Breaker Block, With a Worked Example
The duplication table above says a breaker block is just an order block that already failed once. That line reads clean on paper, so here is what it looks like on an actual chart.
Say ES (S&P 500 e-mini futures) prints a bearish order block at 5,420 — the last down-close candle before a sharp rally to 5,460. Classic ICT reading: that 5,420 zone is where institutional sell orders sat before price reversed, so a pullback into it is a potential short. Price does pull back to 5,422, but instead of reversing, it pushes straight through to 5,435. The order block has failed. It did not hold as resistance.
That same 5,420 zone is now relabeled a breaker block. The logic flips: a level that failed to hold shorts is read as a level that will likely hold longs on the next retest, because the breakout through it proved buyers were in control at that price. If price comes back down to 5,420–5,422 a second time and holds, ICT traders treat that as a long entry, not a short one.
Nothing about the price level changed between the two labels. What changed is the outcome of the first test, which is exactly the "different history attached to it" line from the duplication table. A trader who does not know the two terms are the same object will spend time hunting for a textbook-pure breaker block setup, when the chart in front of them already has the answer under the order-block label they dismissed five minutes earlier.
Where the Framework Is Time-of-Day Dependent — and Why That Limits Markets
The timing layer is where ICT concepts become session-specific, and that is also where the framework's scope quietly narrows. Killzones, the judas swing, and the power-of-three model are all built around the idea of a market open with a defined pre-open accumulation phase, a manipulation move that sweeps liquidity just after the open, and a distribution move in the direction that follows.
According to multiple ICT-sourced glossaries, this structure was built for markets with a clear daily open. It also needs a concentration of institutional order flow in two or three overlapping windows. Forex majors and index futures are the clearest examples. Data from exchange session-hours documentation shows why: equity index futures and major forex pairs cluster volume heavily around the London and New York opens. That is exactly where the killzone windows sit. The same concept — trading volume clustering around a session open rather than spreading evenly across the day — is covered under market microstructure, per the overview at Wikipedia's market microstructure entry, which is a useful background read for anyone who wants the academic framing behind "why session timing matters" before trusting a killzone clock.
That dependency is the limiting factor. The timing layer assumes a market with real quiet-to-active transitions. Remove that transition and the killzone concept has nothing to anchor to.
What Breaks When ICT Ideas Are Applied to a 24-Hour Crypto Chart
Crypto trades 24 hours a day, 7 days a week, with no exchange open or close. Bitcoin and other major pairs do still show recurring volume patterns tied to when US and Asian trading desks are active, but there is no single moment that functions like an equity or forex open — no overnight gap, no pre-market accumulation phase in the ICT sense.
Here is what we found when we checked ICT timing concepts against a continuous market during a sample of recent sessions:
- Killzones lose their statistical edge. The reasoning behind "price is manipulated right after the open, then trends" depends on an open. Mapping a London or New York clock window onto BTC/USDT produces a time range with no structural event tied to it — just an arbitrary two-hour box.
- The judas swing concept becomes directionless. A false move "before the real move starts" presumes a starting point. In a 24-hour market, every hour is mid-session for someone.
- Vocabulary-layer concepts survive mostly intact. Fair value gaps, order blocks, and liquidity pools are structural — they depend on price action, not the clock — so they transfer to crypto reasonably well. This is consistent with what several crypto-focused SMC educators have converged on independently: keep the structure, drop the session clock.
The practical fix traders have landed on is replacing killzone windows with volume-based session proxies — the hours when US and Asian trading desks are most active on that specific pair, found by checking volume profile rather than a fixed clock. That is a reasonable adaptation, but it is an adaptation, not the original framework. Anyone applying literal ICT killzone times to a crypto chart is importing an assumption the market does not have.
The Power of Three, Decoded With a Session Example
Power of three is a timing-layer term. It splits a trading session into three phases: accumulation, manipulation, and distribution. Said plainly, that is a range, a fake-out, and then the real move.
Here is how it plays out on a typical New York session open for ES. From roughly 9:00 AM to 9:30 AM ET, price often chops in a tight range just before the open. That is accumulation. It looks indecisive because institutional size is being built quietly, not announced.
Around 9:30 AM, price often makes a sharp move against the eventual trend. It might push up to sweep the overnight high before reversing. That is manipulation, also called the judas swing — the same term from the duplication table, just applied at the open specifically.
From roughly 9:45 AM through the rest of the New York morning, the real directional move unfolds. That is distribution. Per the five-concept subset above, this is where a market structure shift gets confirmed and a fair value gap from the manipulation leg often becomes the entry zone on a pullback.
Three phases, three labels, one session. The value of naming them is sequencing, not prediction. A trader who sees a sharp move right at the open and immediately chases it is often buying the manipulation leg, not the distribution leg. Waiting for a structure shift after the fake-out is what separates the two, and it is also why the five-concept list puts market structure shift first.
Putting the Map to Use
The practical sequence, once the three layers are separated, looks like this: read structure first (is price trending or ranging), locate the nearest unmitigated fair value gap or liquidity pool within that structure, check whether you are inside a session window where that location has historically produced follow-through on that specific instrument, and only then size an entry against a fixed invalidation level.
We tested this sequencing against a sample of index-futures and forex sessions internally while building the structure-detection logic in SMC Toolkit Pro, and the order matters: skipping straight to an entry trigger without confirming structure first is the single most common mistake we see described in trader post-mortems. Treat every window and level above as a starting point to paper trade first — none of it is a signal to size a live position on day one. That caution is not unique to ICT concepts. The US SEC's investor-education arm makes the same point about any fast, discretionary entry style in its day-trading risk bulletin at investor.gov: unfamiliar setups carry real capital risk until the trader has logged enough screen time to read them reliably. Quantzee's toolkit is built to speed up the reading process. It does not replace the judgment of confirming structure before you act on it. See the full TradingView indicator lineup for how the structure, liquidity, and order-flow layers stack together, and the liquidity glossary entry and order flow glossary entry for the two vocabulary-layer terms this page leans on most.
Default Settings Traders Misuse Most Often
Most ICT-style indicators ship with default thresholds. Defaults are a starting point, not a verdict, and three settings cause more support questions than any others we have tracked.
Fair value gap minimum size. A common default screens out any gap smaller than 0.1× the instrument's average true range (ATR). Set it too low and the chart fills with noise — dozens of marginal gaps a session, most of which never matter. Set it too high and genuine reaction zones on a quiet day get filtered out entirely. There is no single correct number here; it depends on the instrument and the timeframe, which is exactly why this setting needs paper trading across at least 20–30 sessions before it gets trusted on size.
Killzone window boundaries. Traders often hard-code 2:00 AM–5:00 AM ET for London and 7:00 AM–10:00 AM ET for New York and never revisit them. Per the time-of-day section above, those windows were built around forex and index-futures volume concentration. A trader working gold futures or a single-stock future should expect the real volume window to drift by 30–60 minutes from the textbook times, and should check it against that instrument's own volume profile, not assume the forex-derived clock applies unchanged.
Risk-to-reward floor. A 1:2 minimum is a common default filter on entry signals. That ratio came from general trading-literature convention, not from anything specific to the ICT framework itself. Applying it blindly to every setup, including lower-probability manipulation-leg entries, is one of the fastest ways to turn a reasonable framework into a string of small losses that never gets a chance to compound, because the position size and the stop distance were set without first confirming the setup clears the day's own volatility.
Our internal test setup for checking these three settings runs new threshold combinations against a rolling sample of recent sessions before any default changes ship in SMC Toolkit Pro. The same discipline applies to a trader adjusting the same three settings on a live chart: change one variable at a time, log the result across a defined sample of sessions — not three good trades in a row — and only then trust the number enough to size real capital against it. Until that sample exists for your own instrument and timeframe, every one of these three settings should stay in paper-trade mode.