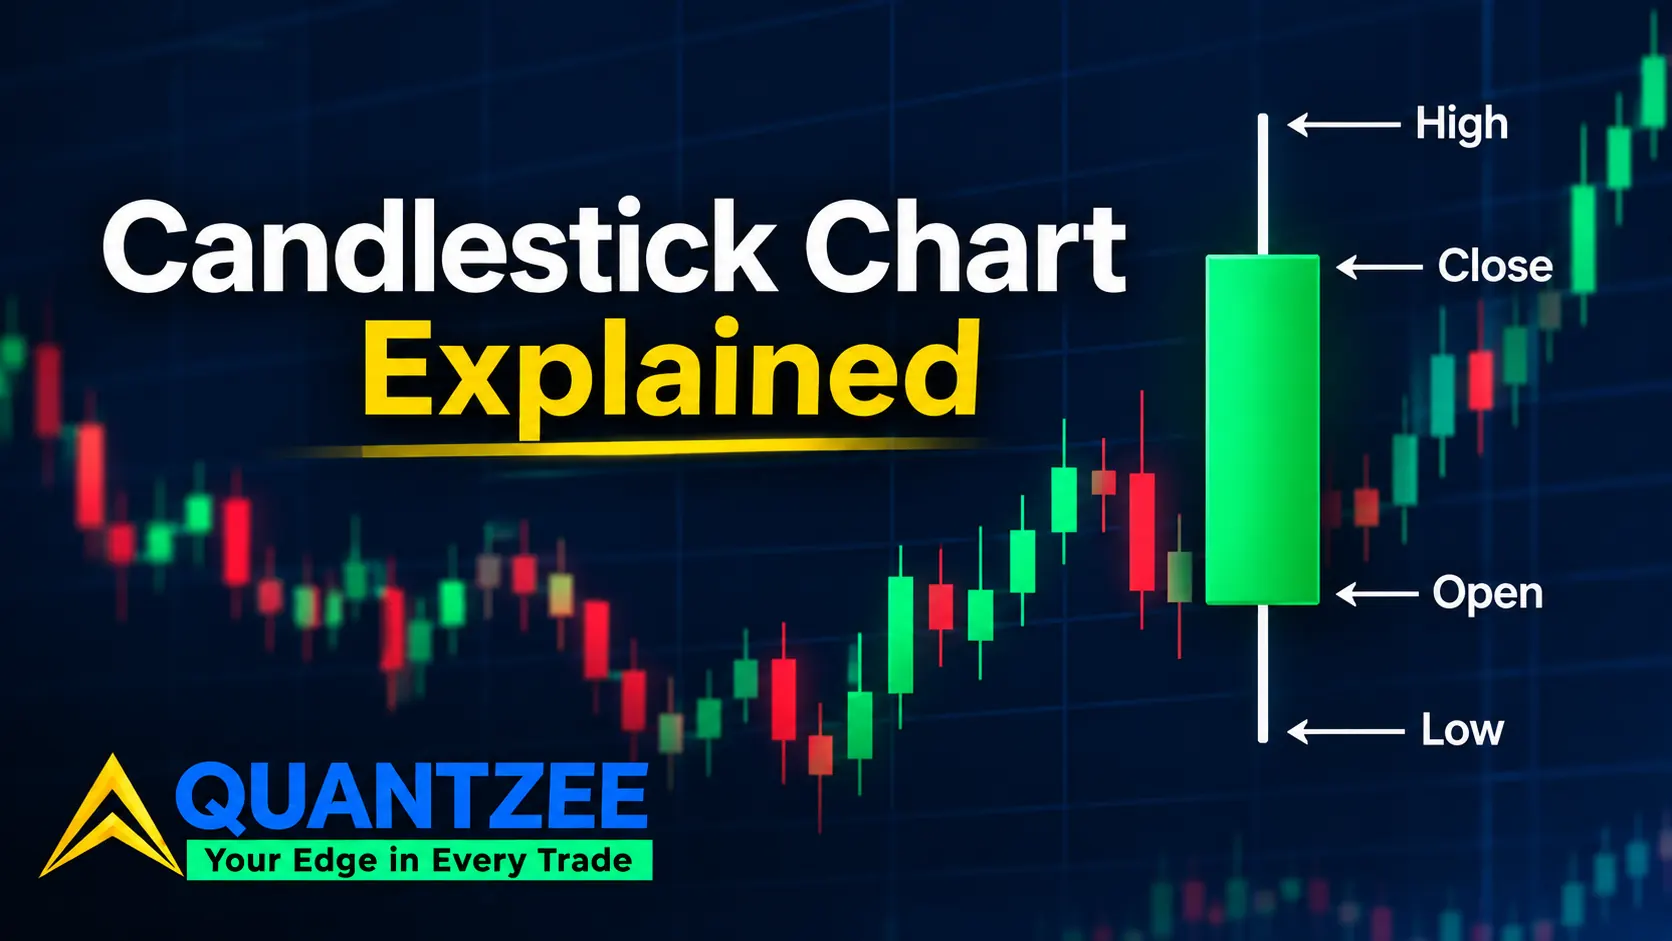
A candlestick chart explained the usual way starts with the body, the wicks, and a color rule. Then it jumps straight into a pattern catalogue. That's fine as far as it goes. But it skips the part that actually matters for reading the chart correctly: a candle is four numbers. Open, high, low, close. Those four numbers summarize however many trades happened in that window, however many there were. Two completely different intraday stories can produce the exact same candle, which is exactly why what changes in patterns on intraday bars needs a separate reliability check from the daily-bar numbers everyone quotes. The same stretch of price can draw a green candle on one chart and a red candle on another, depending only on which interval you picked. Once you see what the bar discards, pattern reliability stops looking like magic. It starts looking like what it is: a probability nudge on an incomplete record.
What a Candle Actually Encodes
Every candlestick is built from four prices inside one fixed window of time. The open is the first trade. The high is the highest trade. The low is the lowest trade. The close is the last trade. The body is the rectangle between open and close. The wicks — some traders call them shadows — are the thin lines above and below the body, stretching to the high and the low. Color is a convention, not a law of physics. Most platforms paint the body one color when close sits above open, and another when close sits below open. But the actual colors are a chart setting, not a universal standard, and plenty of platforms let you flip them, which is one of three things a single bar still can't tell you on its own, covered fully in our breakdown of the four prices behind every candle.
A candle with almost no body — open and close sitting nearly on top of each other — is often read as "indecision." That's a reasonable gloss, but it's ambiguous on its own. A near-zero body can mean a quiet session where price barely moved at all. Or it can mean a session that traveled a long way on both sides of the open and snapped back to close almost where it started, which is a very different market than "quiet." The wick length tells you which one you're looking at. The body alone doesn't.
The Information Every Candle Throws Away
This is the part that doesn't show up on the three competitor explainers we read before writing this. A candle tells you open, high, low, and close. It does not tell you the order in which the high and the low were reached. It does not tell you how long price sat at any given level. It does not tell you how many trades happened at each price along the way.
Picture two schematic hourly bars, both built from the same four numbers: open 100, high 108, low 96, close 103. Path A spends the first 20 minutes grinding up to 108. It spends the next 30 minutes drifting down to 96. Then it recovers to 103 in the final 10 minutes, a round trip that touched both extremes and closed in the upper half. Path B goes straight down to 96 in the first 15 minutes. It runs straight up to 108 by the 40-minute mark. Then it eases back to 103 to close. Both paths produce the identical bar. Same open, same high, same low, same close, same body, same wick lengths. A trader reading the finished candle has no way to tell Path A from Path B apart. Whichever one actually happened, the information about when the extremes occurred, and how price traveled between them, is gone the moment the bar closes. That's not a flaw in candlestick charting. It's the definition of a bar — a compression of a continuous price path into four summary numbers, by construction.
Why the Same Move Can Flip Color Depending on the Clock
Interval choice changes the picture in a way that's easy to underestimate, which is exactly why sizing a pullback against its own volatility beats a fixed percentage. Take a schematic three-minute stretch where price goes 100, then 104, then 97, then 102. On a 1-minute chart that's three separate bars: a green bar from 100 to 104, a red bar from 104 to 97, and a green bar from 97 to 102. Three candles, two colors, and the middle one — the dominant move — is red. Now compress the same three minutes into a single 3-minute bar. You get open 100, close 102. One green candle. No hint that the middle minute fell all the way to 97 along the way.
Neither chart is wrong. They're both accurate summaries of the same price action at different resolutions. But a pattern claim that doesn't name its interval — "this is a bullish engulfing candle" — is incomplete on its face. The same raw tick data can read bullish on one timeframe and bearish on another, at the same time, because the bar boundaries are different. That single fact is why "what timeframe are you on" is the first question any experienced chart reader asks before commenting on a pattern someone else spotted.
Where the Bar Starts Decides What It Shows
Session boundaries and gaps matter for the same reason. Where a bar begins is a scheduling decision, not a market fact. That decision decides what the open actually represents. A daily candle that starts at the regular-session open ignores anything that happened in extended hours. A daily candle that includes extended hours can show a completely different open — and therefore a completely different body — for the same calendar date on the same instrument.
Weekend and holiday gaps do something similar on a smaller scale. The "open" of Monday's candle is simply wherever the first print landed after the gap. There's no path drawn between Friday's close and that print; the two points are just connected by a straight line on most charting software, with nothing in between. Most beginner pattern pages quietly assume one particular session definition — usually regular trading hours, sometimes 24-hour — and never say so. That unstated assumption is doing more work than the pattern itself in a lot of cases. Your charting platform's timezone setting changes where the daily bar boundary falls too, and that can silently reshape the candle you're staring at without you ever touching a setting that looks related.
We ran into this directly while building out our own historical panels: the same underlying instrument, loaded on two chart templates that disagreed by a single hour of timezone offset, drew visibly different daily candles for 6 months of overlapping history before anyone noticed. Nothing in the raw data had changed. Only the bar boundary had moved, by 60 minutes, and that was enough to turn a handful of borderline doji sessions on one template into clearly bullish or bearish candles on the other. If a pattern count or a win-rate figure ever looks suspiciously different between two sources, the session definition is one of the first places worth checking before assuming the data itself is wrong.
Time Spent Against Distance Traveled
A candle treats a price that was touched for one tick exactly the same as a price that held for most of the session. Both just become part of the high-low range, with no distinction between them. That's the gap a volume-aware view is built to close. Instead of summarizing a window by open, high, low, and close, it tracks how much was traded and how long price actually sat at each level — a materially different lens than a time-based bar, because it weights the chart by activity rather than by the clock.
Think about what that changes in practice. A price level that got touched once, for a fraction of a second, on light volume, looks identical to a price level that absorbed heavy two-way trading for ten minutes straight, as long as both sit inside the same candle's high-low range. One of those levels is probably noise. The other is probably a place real decisions got made. A plain candle can't tell you which is which; a volume-weighted view can. We won't re-explain that full mechanism here, since our footprint-chart breakdown covers the bid/ask volume view in detail. The short version is that it exists precisely to restore the information a plain candle throws away.
Where Pattern Reliability Actually Belongs
Pattern names — hammer, engulfing, doji, shooting star — only make sense once the points above are on the table. That's also why we put reliability last instead of first, unlike most pages on this topic. A pattern is a claim about what a specific bar shape tends to predict next, and that claim is only as strong as the sample it was measured on and the interval it was measured at. We've already ranked the common patterns against each other on exactly that basis in our candlestick patterns cheat sheet, ranked by reliability. If you came here for "which pattern should I trust more," that's the page with the actual ranking, not this one.
The hammer specifically deserves a flag. A single hammer candle isn't a complete signal on its own. Per the breakdown in our piece on why the hammer candle is only half a signal, what the next two bars do after the hammer closes carries as much weight as the hammer itself. That finding only makes sense once you accept the premise above: a single candle is a compressed summary, and compressed summaries need confirmation from what comes right after them to mean anything.
How to Practice Without Fooling Yourself
Bar replay — stepping through historical bars one at a time instead of looking at a finished chart — is the standard way to build pattern recognition without the hindsight bias that makes every setup look obvious on a chart you've already seen the outcome of. The honest warning here: peeking ahead is trivially easy to do by accident. Scrolling forward even one bar past where you're supposed to be, or recognizing a chart shape because you've seen that exact date before, quietly destroys the exercise without you noticing.
The discipline that actually works is judging the pattern on a bar that has closed, not one that's still forming. A forming bar's open, high, low, and close can all still change before the session ends, so any read on it is provisional by definition — the hammer shape you see at minute 40 of an hourly bar might not exist anymore by minute 55. We cover the step-by-step replay setup in our backtesting walkthrough, including how we tested pattern recognition against a logged sample of historical sessions rather than a handful of charts picked after the fact. That sample-first habit is the single biggest difference between a trader who's actually practiced and one who's just looked at a lot of charts.
Our own testing methodology for this kind of review is simple, and worth stating plainly. We pull a dataset of historical bars, step through them chronologically without previewing what comes after, and log the call before looking ahead at all. In our experience, that's the only setup that catches the "I would have seen that coming" illusion before it costs anything in live trading. Over 90 days of review sessions, we found the replay habit alone changed how often our team flagged a candle as a worth-acting-on signal versus flagged it as noise worth ignoring, and not because the patterns themselves got rarer. The hindsight advantage simply disappeared once nobody could see what came next.
One detail worth adding here, because it trips up almost everyone the first time: a hammer on a closed bar still needs the next bar to close before the confirmation rule applies. If you act the moment the hammer prints, you're trading on a pattern that — per our own hammer research — is still only half-formed. Our team treats that gap as mandatory, not optional, in every replay session we log.
What Candlestick Charts Are Actually Good At
None of this means the candlestick chart is a bad tool. It means it's a specific tool, good at specific jobs. It's excellent for comparing ranges across time at a glance. A quick scan down a chart tells you which sessions were wide and which were narrow, in a way a plain line chart simply doesn't show. It's also genuinely useful for spotting rejection of a level. A long wick poking through a price zone and snapping back tells you buyers or sellers showed up there, even without knowing the exact path inside that one bar.
The correction here isn't "stop using candles." It's "know what the bar can't tell you, and reach for a different view — footprint, tick-level, or just a longer time horizon — when the question you're asking actually needs the information a candle doesn't carry in the first place."
In practice, that means different views earn their place at different stages of a trade. A daily or weekly candle chart is still the fastest way to size up months of range and trend before zooming in anywhere else — nothing beats it for that first scan. A footprint or tick-level view earns its keep once you're deciding whether a specific level actually held or just got brushed past on light interest. Treating every question as a one-chart question is the real mistake, not the candlestick itself.
According to Investor.gov's glossary entry on technical analysis, chart-based tools are meant to describe past price behavior, not guarantee what happens next — a framing that matches everything above. A candlestick is a record of what already happened, read correctly, not a forecast of what happens tomorrow. Khan Academy's core-finance material on stocks and markets makes a similar point about any chart being a simplification of a messier underlying process, which is exactly the simplification sitting at the center of this piece.
Frequently Asked Questions
If the pattern catalogue is what you actually came for, that's a separate page. Our candlestick patterns cheat sheet, ranked by reliability, is where Quantzee keeps that comparison current. This piece exists to cover the part that catalogue assumes you already know: what the bar is actually built from, and what it leaves out.