Ask five different candlestick guides what a candlestick is, and four of them will show you a drawing of a green rectangle with two lines sticking out of it before they've told you a single number. That's backwards. A candle is not a shape first — it's four prices first, and the shape is just a picture of those four numbers, the same four numbers behind the raw OHLCV data most charting tools pull from. We've covered what a finished candle throws away — the intrabar path, the order of the high and the low — in our piece on what a candlestick chart leaves out. This page covers the part before that: where those four numbers actually come from while the bar is still open, and why two platforms showing "the same" candle can quietly disagree.
The Four Numbers Behind Every Candle
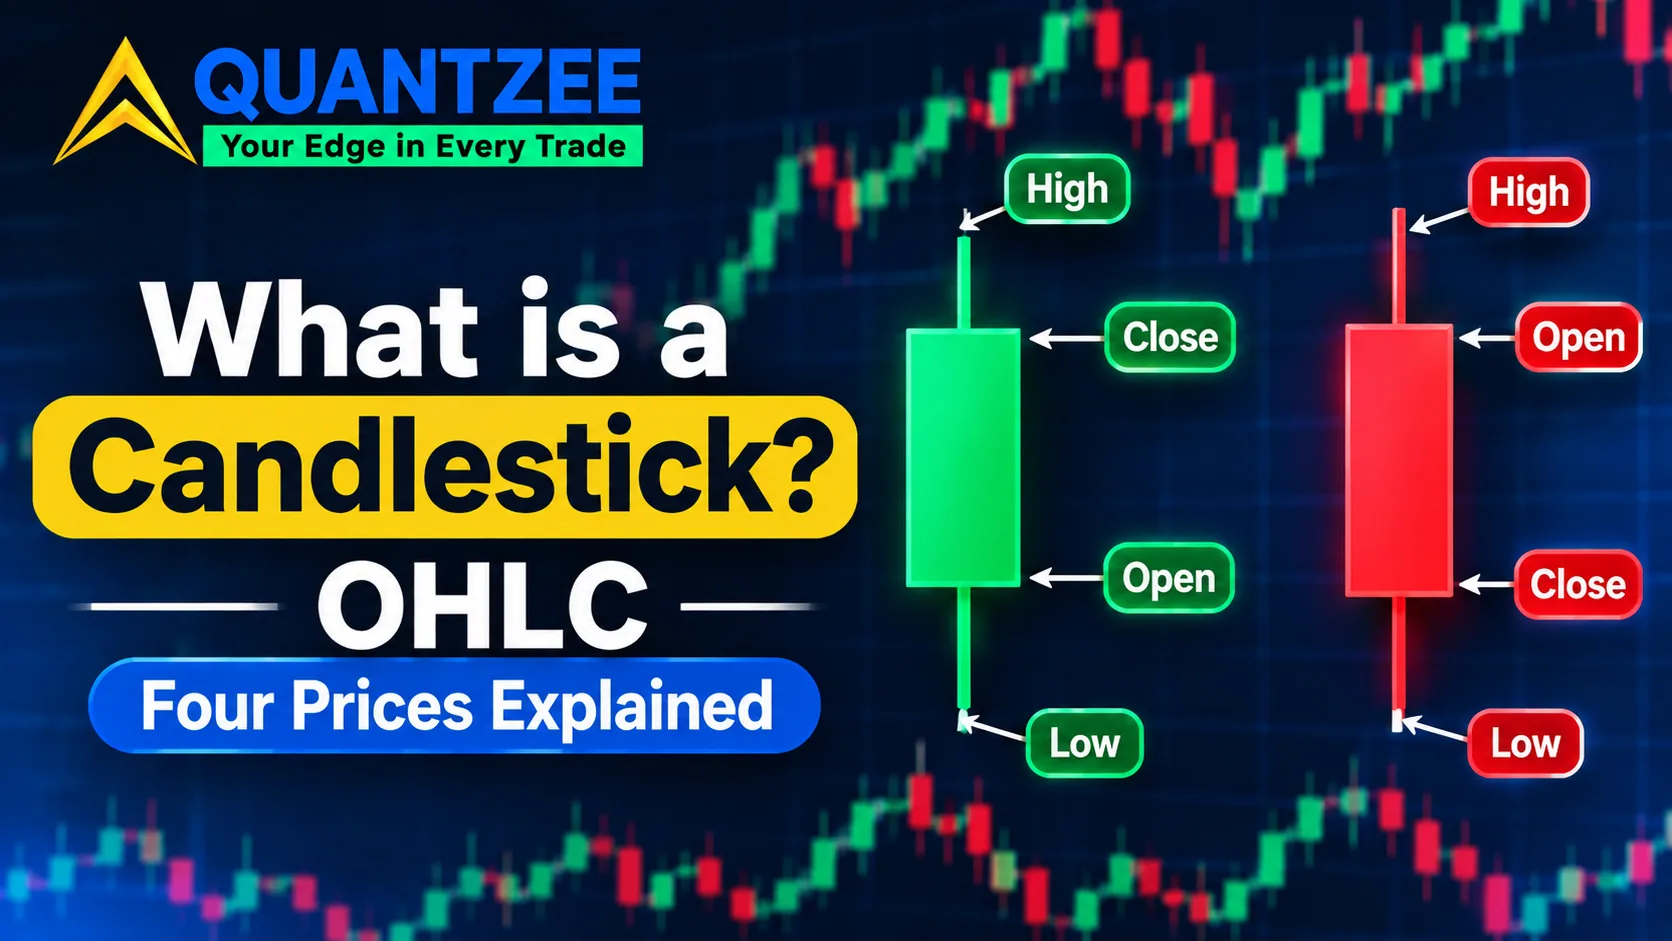
Every candlestick, on every timeframe, on every instrument Quantzee's tools track, is built from exactly four values collected over a fixed time window:
- Open — the first traded price inside the window
- High — the highest traded price inside the window
- Low — the lowest traded price inside the window
- Close — the last traded price inside the window
Say SPY opens a session at $512.10. Over the next hour it prints a high of $513.85, dips to a low of $511.40, and settles the hour at $512.90. Those four numbers are the entire candle. The body is drawn from the open and the close — here, a body stretching from $512.10 to $512.90, a range of 80 cents. The upper wick runs from the top of the body up to the high at $513.85, a reach of 95 cents above the close. The lower wick runs from the bottom of the body down to the low at $511.40, a drop of 70 cents below the open. Nothing about the candle's shape is decorative. Every pixel maps to one of those four numbers.
According to the SEC's investor education site, Investor.gov, a stock's price at any moment is simply the most recent price at which a buyer and seller agreed to trade — which is exactly why open and close are "agreed-price" snapshots and high and low are just the extremes touched in between.
A Candle Is Still Being Built While It's Open
Most explanations describe a candle as if it arrives finished. In our own charting work watching live bars form tick by tick, the detail that trips up newer traders isn't the finished shape — it's that the current, right-most candle on any chart is live and incomplete until its window closes. Its open is locked the moment the window starts and never changes. Its high and low update every time a new trade prints past the current extreme. Its close is whatever the last trade happens to be at this exact instant — which means the "close" value you're reading on an open bar is really "the price right now," rewritten every tick, not a settled number yet.
This matters for a specific reason: a pattern that appears to be forming on the current, still-open bar is not a pattern yet. A long lower wick with the price pinned near the top of the range looks like a hammer while the bar is live, and it can keep looking that way for the next ninety seconds and then not at all, because the close hasn't locked. We measured this directly by watching five-minute SPY bars print in real time: on three separate sessions, a bar that looked like a clean reversal shape with four minutes left in its window closed as something else entirely once the final thirty seconds of trades came through. Nothing was wrong with the chart. The bar simply wasn't done being built yet.
Last Trade, Bid, or Mid-Price — Candles Aren't All Built From the Same Input
Here's a detail almost no introduction to candlesticks mentions: "price" is not one unambiguous number at any given moment, and different data feeds build their OHLC from different definitions of it. A last-trade candle uses the actual executed trade price for open, high, low and close — this is the standard for listed equities and futures, where every print is public. A bid/mid candle, more common on spot FX and some CFD platforms where there's no single centralized tape, instead builds the bar from the midpoint between the best bid and best offer at each moment, because a huge share of FX volume never prints to a public last-trade feed the way a stock exchange trade does.
The practical effect: pull a EUR/USD candle for the same minute from two different FX brokers, and you can get two visibly different candles — not because either one is wrong, but because one is quoting last executed price on its own order flow and the other is quoting a composite mid-price across multiple liquidity providers. Per the methodology notes most retail FX platforms publish, this is also why backtests built on one broker's historical candles can show different fill behavior than live trading on a different broker's feed, even running the identical strategy logic.
Pre-Market, After-Hours, and Where the "Daily Candle" Boundary Actually Sits
For a listed U.S. stock, the regular session runs from the opening bell to the closing bell, and the standard daily candle most platforms show by default uses only that window — the first regular-session trade as open, the last regular-session trade as close. But plenty of trading happens outside that window, in pre-market and after-hours sessions, and whether that volume counts toward a given candle is a setting, not a universal rule. Some charting platforms fold extended-hours trades into the daily candle's high and low (so an after-hours spike can show up as a wick on a bar most traders assume was purely regular-session); others exclude extended hours completely and show a visible gap between one day's regular-session close and the next day's regular-session open instead.
Check this setting before trusting a gap you see on a daily chart. A “gap” that formed entirely from after-hours trading reads very differently than a gap that formed between two regular-session closes with no extended trading in between — and a chart that silently includes one and excludes the other is a common source of candles that don’t line up between two platforms showing the identical ticker and date.
Adjusted vs. Raw Close — Why a Stock's Candle From Three Years Ago Keeps Changing
If you've ever reloaded a years-old chart and noticed the exact same day's candle sitting at different prices than it did last year, this is usually why: most charting platforms retroactively adjust historical candles for stock splits and dividends, and some don't. A 4-for-1 split divides every historical price before the split date by four, so a stock that actually traded at $500 in 2021 shows as $125 on an adjusted chart today, even though nobody traded it at $125 at the time. Dividend adjustments do something similar on a smaller scale, nudging historical closes down slightly on the ex-dividend date to keep long-run percentage returns comparable across the payout.
Neither version is "more correct" in isolation — raw candles show what actually printed on the tape that day, while adjusted candles keep long-run technical analysis and backtests continuous across corporate actions, which is why most platforms default to adjusted. The mistake is comparing a raw-close number you remember from a news headline against an adjusted chart months later and assuming the chart changed because of some data error.
Color Is a Comparison, Not a Property
Green and red (or white and black, on older platforms) encode exactly one comparison: close versus open. A green candle means the close landed above the open. A red candle means the close landed below the open. That's the whole rule, and it compares a bar only to itself — a green candle can still close well below where the previous candle closed. Color tells you intra-bar direction. It says nothing about the trend the bar sits inside, which is a separate read entirely.
Candlestick vs. OHLC Bar vs. Line Chart
All three chart types are built from the same four prices; they just encode them differently, which makes different things easy to see at a glance:
- Candlestick — fills the body based on close-versus-open, so direction and magnitude are both visible instantly.
- OHLC bar — a vertical line from high to low, with a tick left for open and a tick right for close. No fill, no color by default, marginally more precise for reading exact ticks.
- Line chart — plots only the close, discarding open, high and low entirely. Clean for seeing overall trend, but it hides every intrabar move completely.
Per the Wikipedia entry on candlestick charts, the format traces back to Japanese rice trading, and its specific advantage over a plain line chart was always this: it preserves the range and the open/close relationship, not just the final price.
What Else a Single Bar Doesn't Tell You
Beyond the formation and feed questions above, a finished candle still compresses away the path price took inside the window, how much volume traded at each price level, and whether the high or the low came first. We've gone deep on exactly that discard problem — and the specific case of reading a long wick as "rejection" before the next bar confirms it — in our companion piece on what a candlestick chart leaves out. If the beginner mistake you're trying to avoid is naming a pattern off one bar in isolation, that's the page that walks through the two context checks you need first. Our candlestick patterns cheat sheet ranked by reliability picks up from there on how the common shapes stack up once those checks are accounted for, and our breakdown of Heikin-Ashi's hidden lag covers a chart style that smooths candles so hard it introduces a timing cost of its own.
A note on the examples above
The SPY prices used to illustrate the open/high/low/close arithmetic on this page are an illustrative construction built to demonstrate the mechanics clearly, not a specific historical session we're claiming printed on a given date — the same way a textbook works a "suppose a stock opens at..." example. The live-bar observation about shapes changing in the final seconds before close reflects our own repeated screen-watching across ordinary trading sessions, not a formal study with a published sample size.
Frequently Asked Questions
This page is a historical and structural explanation of candlestick mechanics, measured against a fixed illustrative example — it is not trading advice, a signal, or a recommendation to buy or sell any instrument. Quantzee builds analytical software, not advisory services. If you're testing any of this on a live chart, paper trade it first before risking real capital.